ORGANIC WASTE AS FERTILIZER TO INCREASE - THE NUMBER OF PEANUTS (Arachis hypogaea L.) FLOWERS
←
→
Page content transcription
If your browser does not render page correctly, please read the page content below

Jurnal Biodjati 6(1):153-161, May 2021               e-ISSN : 2541-4208
                                                                                      p-ISSN : 2548-1606

                               http://journal.uinsgd.ac.id/index.php/biodjati

         ORGANIC WASTE AS FERTILIZER TO INCREASE
      THE NUMBER OF PEANUTS (Arachis hypogaea L.) FLOWERS

                                 Enceng Sobari1*, Ferdi Fathurohman2

Received : November 28, 2019         Abstract. Peanut has high economic value and a significant role
Accepted : April 28, 2021            in food needs. the national food supply needs for peanuts to date
                                     have not been sufficient. This study aimed to determine the effect of
DOI: 10.15575/biodjati.v6i1.6538
                                     organic waste which in this case is mushroom baglog compost and
1,2
    Agroindustry Department of State sheep manure on the flowers and pods of peanuts. The study was
Polytechnic Subang Jl. Brigjen conducted on March-July 2018 in Subang district using the simple
Katamso No. 37 Dangdeur, Subang experimental plot method and group-randomized factorial design
41211 West Java, Indonesia           with two factors with each treatment done triplicate. The first fac-
                                     tor is the baglog compost (soil without baglog compost, 90 g/plants,
e-mail:                              120 gr/plants); the second factor is sheep manure dose (without
*1ncesobari@gmail.com
                                     sheep fertilizer, 90 gr/ plants, 120 gr/plants). The results showed
2
  ferdifathurohman@yahoo.com
                                     that the application of baglog compost and sheep manure fertilizer
*Corresponding author                at concentrations of 90 g and 120 g, respectively increased the num-
                                     ber of flowers and potential pods. Moreover, Sheep manure ferti-
                                     lizer at a concentration of 120 g/plant, increased the dry weight
                                     of pods, seed, and 100 seeds even though was not significant.

                                      Keywords: Arachis hypogaea L., flowers, organic fertilizer, peanuts.

Citation
Sobari, E. & Fathurohman, F. (2021). Organic Waste as Fertilizer to Increase the Number of
Peanuts (Arachis hypogea L.) Flowers. Jurnal Biodjati, 6(1), 153-161.

              INTRODUCTION                               tik (BPS), in the last five years, the peanut
                                                         harvested area in Indonesia has decreased by
      Peanut (Arachis hypogaea L.) is one of             an average of 4.63% per year. According to
the leading commodities in Indonesia. Peanut             ARAM II data in 2016, the productivity of
has 25-30% protein, 40-50% fat, 12% carbo-               peanuts in Indonesia was 13.21 q/ha or de-
hydrate, and vitamin B1 (Sembiring et al.,               creased by 0.90% compared to the previous
2014). About 85% of peanut production is                 year. In the same period, the average produc-
widely used in the food industry such as bread,          tivity of peanuts in Java reached 12.86 q/ha
jam, oil, and peanut flour (Sobari, 2018).               from a harvest area of 357.028 Ha. During
Ginting et al. (2015) mentioned that peanut is           this period the number of national peanut
one of the important requirements in fulfilling          exports averaged 3.39 thousand tons while
the required societies’ food nutrition. Thus, it         the number of imports reached 235.81 thou-
indicated that the quality and quantity of pea-          sand tons. The development of peanut export
nut can be considered as one of the important            volume in the 2011-2015 period experienced
sources of food for everyone.                            an average increase of 18.30% per year, but
      The national peanut demand has not                 the tendency for import remained higher than
been fulfilled. Based on Badan Pusat Statis-             export volumes (Sholihah, 2016). Indonesia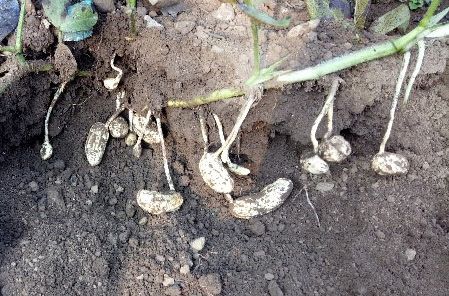
Jurnal Biodjati 6(1):153-161, May 2021

                           http://journal.uinsgd.ac.id/index.php/biodjati

through the Indonesian Ministry of Agri-             of oyster mushroom baglog waste and sheep
culture must import more than 230 million            dung as an alternative to compost are expec-
kgs of peanuts in neighboring countries such         ted to have good prospects to the higher ferti-
as Vietnam, China, India, and Australia which        lizers and agricultural needs.
reach more than 225 million USD (Dinarto &                  The baglog waste from the mushroom
Astriani, 2012).                                     has nutritional contents including 37.241%
        Due to the production of peanuts de-         water content, nitrogen of 0.931%, phospho-
creased, the existence of harvested areas            rus of 2.070%, potassium 8.515%, and C / N
have decreased as well. Soil fertility factors       ratio of 37.199 (Bellapama et al., 2015). Solid
become a serious problem to the decline of           sheep manure has nitrogen levels of 0.60%,
peanut production. Hard soil contour causing         phosphorus of 0.30%, potassium 0.17%, and
hampered root development and resulting in           water 60% (Rahmah et al., 2014). This com-
the disability of peanut to grow as the for-         position has benefits in improving the ferti-
mation of pods cannot penetrate the soil, this       lity structure in the soil. This study aimed to
is cause of peanut production results are not        assess the potential of organic fertilizer made
optimal (Sembiring et al., 2014). Additionally,      from mushroom baglog waste and sheep
the efforts to increase the productivity of pea-     manure as a planting medium to increase
nuts can be implemented by fertilizing the soil      the number of flowers as one of the prospec-
with organic matter-derived fertilizer that can      tive peanut pods and the efforts to improve
help change the physical, chemical, and bio-         national peanut productivity.
logical properties of the soil. (Hulopi, 2006).
Fertilization using organic matter is also an             MATERIALS AND METHODS
effort in improving soil structure and fertility
(Sudarto et al., 2014).                                    The study was conducted in Tambakan
        Sheep manure is a livestock waste bene-      Village, Jalan Cagak, Subang Regency,
ficial to plants as it can be a decomposer and       West Java, with a height of 518 meters
has an organic content that can be used as           above sea level. from March to July 2018
nutrients for plants such as the N, P and K          using a variety of peanut seeds, mushroom
elements. Sheep manure will be far more              baglog, and sheep manure waste. The results
optimal if the composting process is carried         of the chemical analysis are as follows
out first, because the nature of the dense sheep     Table 1.
dung reduces pathogenic microorganisms and                 The experimental method used was a
facilitates absorption by plant roots (Hidayati      factorial randomized block design with two
et al., 2013).                                       factors and three replications. The first factor
        Mushroom baglog is a medium used             of treatment is baglog waste composition (K)
for the cultivation of oyster or Champignon          and the second factor is sheep manure (D),
mushrooms, it was made from sawdust that             each consisting of; K0 (soil without baglog
has been sterilized and compacted in plastic         waste), K1 (90 g/plant), K2 (120 g/plant), and
packaging. Mushroom baglogs that have been           D0 (soil without sheep fertilizer), D1 (90 g/
used previously cannot be used again, and            plant), and D2 (120 g/plant).
even tend to become unused waste. The use

Sobari & Fathurohman                                                                             154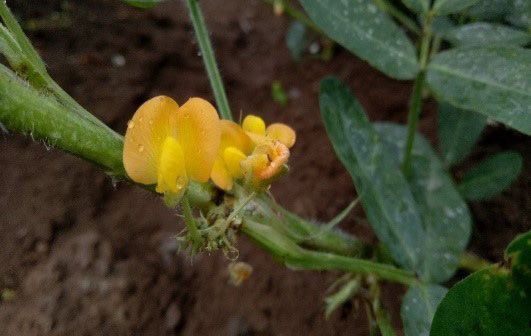
Jurnal Biodjati 6(1):153-161, May 2021

                             http://journal.uinsgd.ac.id/index.php/biodjati

Table 1. Biomass and ammonium content of 12 cyanobacteria strains

       Content            Unit           Mushroom Baglog    Sheep Manure      Soil      Description (*)
 pH                          -                  9.35             7.97        4.24*        Very acid
 C-Organik                   %                  1.79            35.25         7.6*        Very high
 N                           %                  1.20             0.97        0.34*         Normal
 C/N Rasio                   -                   1                36          22*           High
 P2O5                        %                  0.81             2.56           -             -
    P2O5 HCL 25%         mg/100g                  -                -          55*           High
 K2O                         %                  1.97             0.14           -             -
    K2O HCL 25%          mg/100g                  -                -         17.5*          Low
 Ca                          %                  1.87             7.49           -             -
 Mg                          %                  0.57             0.40           -             -
 Fe                        ppm               7485.34           6007.60          -             -
 Cu                        ppm                  38.1             32.0           -             -
 Zn                        ppm                 130.5            116.8           -             -
 B                         ppm                181.42             9.24           -             -
 S                           %                  0.14             0.00           -             -
 Pb                        ppm                  13.8             20.8           -             -
Source: Personal Data (2018)

       Planting used was 27 experimental                            RESULTS AND DISCUSSION
plots, each 80 cm × 60 cm in size with a dis-
tance of 40 cm per bed, 50 cm between the                        The number of environmental para-
beds the number of 8 plants for every treat-               meters was measured during study, inclu-
ment, with a distance of 20 cm × 30 cm or                  ding temperature, duration of solar illumi-
equivalent to 166.666 plant populations. The               nation, and wind speed. At the time of the
observed variables included height, number                 study the average temperature obtained was
of flowers, number of empty pods, number                   27.27°C (Figure 1). According to Faronika
of filled pods, pod dry weight (g), seed dry               et al. (2013) the temperature requirement
weight (g), the weight of 100 seeds (g). The               for peanut growth ranged from 25–35°C,
obtained data were analyzed using para-                    while during the flowering phase need tem-
metric analysis by first testing the normality             perature ranged from 24–27°C.
using Kolmogorov-Smirnov with SPSS 23.0
of the average distribution of observations                The Number of Flowers.
value with the provisions of the data having                     The emergence of peanut plant flowers
a normal distribution if the Sig. ≥ 0.05 (San-             occurs at the age of 28 days after planting.
toso, 2016). The data were then analyzed Us-               The observations were conducted at 5, 6, and
ing the analysis of variance (ANOVA) table                 7 WAP (Weeks after planting) which inten-
F 0.05. If the variables showed a significant              ded to determine the maximum number of flo-
effect, then a Duncan's Multiple Range Test                wers that appeared. The number of flowers
(UJBD) at the 5% significant level was then                will affect the number of pods formed. Ac-
carried out.                                               cording to Sobari et al. (2018), optimizing
                                                           pollen from male flowers to the pistil (polli-

Jurnal Biodjati 6(1):153-161, May 2021                                                                    155
Jurnal Biodjati 6(1):153-161, May 2021
http://journal.uinsgd.ac.id/index.php/biodjati
nation) on flowers will be a major factor in the a perfect flower structure (hermaphroditic)
process of fruit formation. As reproduction helps in the process of pollination to form
in nuts by self-pollination (self-pollination), ovaries (Stalker et al., 2016).
.
.
.
.
.
.
.
Figure 1. Climate data during the study (T: Average temperature (°C); ss: Duration of
solar illumination (hours); ff: Average wind speed (m/s))
(a) (b)
(c)
Figure 2. Flower growth of Arachis hypogaea L. (a). Flower forming Phase (b). Forming Pods
Phase (c). Development phase of seed on pods
Sobari & Fathurohman 156Jurnal Biodjati 6(1):153-161, May 2021
http://journal.uinsgd.ac.id/index.php/biodjati
Table 2. Number of Peanut Flowers at 5 WAP, and 7 WAP
Number of flowers
Treatment
5 WAP 7 WAP
Mushroom Baglog Compost
K0 12.94 ± 2.25 a 4.08 ± 0.32 a
K1 13.99 ± 1.59 a 4.50 ± 1.05 a
K2 12.43 ± 0.24 a 3.15 ± 0.75 a
Sheep Manure Compost
D0 12.40 ± 0.34 a 3.97 ± 0.13 a
D1 12.50 ± 1.30 a 3.60 ± 0.42 a
D2 14.46 ± 1.92 b 4.17 ± 1.66 a
Description: WAP (Weeks after planting); Values are mean ± standard error. Values marked with the same letter are
not significantly different according to Duncan's Multiple Range Test at the 0.05 level.
The result of this study showed that wers, fruits, and seeds (Sawara et al., 2012).
treatment of sheep fertilizer D2 (120 g/plant)
significantly increased the number of flowers The Number of Empty Pods
that appear in peanut plants with an average This value was obtained by counting all
value of 14.46 per hectare compared to treat- the pods formed, both those that have not yet
ments of D0 and D1 (Table 2). Flower forma- fully formed seeds and those that have already
tion starts from the formation of primordia or formed seeds.
generative buds to anthesis flowers (blooms), As presented in Figure 3, shows there
the process of flower blooming occurs gra- is a relationship between the number of flo-
dually (Putri & Pramono, 2013). The changes wers that appear with the formation of pods.
of flowers in plants with autogamy are most It can be assumed that the potency of peanut
difficult to observe, thus it is very important pod formation is influenced by the amount of
in determining the right time of maturation for flowers and the success of flower develop-
circulation and pollination so the fertilization ment into a gynophore that reaches the soil
can run well. This is the basis that the num- (Sobari et al., 2018). The previous research by
ber of flowers can be influenced by the age of Zharare et al. (2010) explained that the gyno-
flower maturity (Onwubiko et al., 2013). phore carries the results of pollination in the
The provision of available sheep fertili- form of an ovary, at the end, it bends and ex-
zer at the beginning of flowering can improve tends downward then penetrates the ground.
flower formation and development. This due After the ovary buried as deep as 5-10 cm,
to the phosphorus content derived from the then, the embryo begins to expand and fruit
sheep fertilizer of 2.56% (Table 1) that mixed enlargement occurs. The development of gy-
with soil that already has relatively high nophore is influenced by the structure and fer-
phosphorus content. This is in line with what tility of the soil where the provision of organic
Setiawati et al. (2010) stated, the content of matter has an important role in improving the
phosphorus absorbed will help the process of physical, chemical, and biological properties
plant metabolism and accelerate flowering in of the soil. By increasing soil aggregation,
the generative phase. Moreover, phosphorus improve aeration and percolation, will make
plays a role in cell nucleus formation, cell soil structure crumb, and increase soil fertili-
division, increasing the growth of root, flo- ty, so that the development of gynophore into
Jurnal Biodjati 6(1):153-161, May 2021 157Jurnal Biodjati 6(1):153-161, May 2021
http://journal.uinsgd.ac.id/index.php/biodjati
the soil takes place optimally (Sawara et al., can affect growth and yield. (Marliah et al.,
2012). The spacing also determines the suc- 2012). The higher the plant density, the higher
cessin the number of pods formed. Reducing the competition among plants affecting plant
plant density per hectare will result in changes growth and yield, and decrease the number of
in the microclimate around the plant which pods per plant produced (Tamura et al., 2017).
Figure 3. The number of peanut flowers Arachis hypogaea L. and empty
pods after treatment of organic waste mixtures
The Number of Fully Formed Pods tal factors that are more dominant compared
These numbers obtained by counting to genetic factors. The genetic factors cause
fully formed pods that have clear, dense, seed- differences such as diversity in the appea-
filled pods (Sobari, 2016). Experimental data rance of plant phenotypes by displaying
show (Table 3), that the treatments of baglog special characteristics that differ from each
compost and sheep fertilizer did not signifi- other (Mahdiannoor et al., 2017). As for the
cantly affect the number of fully formed pods. environmental factors basically change
The treatments showed no significant characteristics in plants themselves (Sobari &
effect on the number of fully formed pods in Wicaksana, 2017).
peanut. It may be influenced by environmen-
Table 3. The Number of fully formed pods/plant
Treatment Number of fully formed pods/plant
Mushroom Baglog Compost
K0 13.53 ± 2.97 a
K1 15.47 ± 4.59 a
K2 13.03 ± 2.60 a
Sheep Manure Compost
D0 13.60 ± 1.81 a
D1 12.71 ± 1.97 a
D2 15.72 ± 5.22 a
Description: WAP (Weeks after planting); Values are mean ± standard error. Values marked with the same letter
are not significantly different according to Duncan's Test at the 0.05 level.
Sobari & Fathurohman 158Jurnal Biodjati 6(1):153-161, May 2021
http://journal.uinsgd.ac.id/index.php/biodjati
Dry Weight of Pods, Seed, and 100 Seeds that the treatments K1 and D2 (Table 4) have a
The treatments of baglog compost and higher value than other treatments (K0K2 and
sheep fertilizer did not provide a significant D0D1). As has been reported by Barus et al.
effect on the dry weight of pods, seed, and 100 (2014), the haviest weight of 100 mung bean
seed (Table 4). However, The dry weight of seeds obtained from TSP fertilizer was at a
100 seeds increased along with the increase of dose of 30 g/plant compared to control treat-
sheep manure fertilizer application. The lar- ment and 15 g plant.
gest value of each observation variable shows
Table 4. The Dry Weight of Pods, Seeds, and 100 Seeds.
Treatment Dry Weight of Pods (g) Dry Weight of Seeds (g) Dry Weight 100 Seeds (g)
Mushroom Baglog Compost
K0 16.62 ± 5.02 a 9.87 ± 2.05 a 30.61 ± 1.90 a
K1 20.57±7.32 a 13.94 ± 4.43 a 32.53 ± 0.75 a
K2 15.69 ± 3.25a 9.96 ± 2.56 a 29.73 ± 1.97 a
Sheep Manure Compost
D0 16.28 ± 2.02 a 10.55 ± 1.66 a 30.03 ± 1.58 a
D1 15.55 ± 2.90 a 10.47 ± 2.38 a 30.59 ± 2.72 a
D2 21.06 ± 8.38 a 12.75 ± 5.76 a 32.24 ± 0.58 a
Description: WAP (Weeks after planting); Values are mean ± standard error. Values marked with the same letter are
not significantly different according to Duncan's Test at the 0.05 level.
Each observation variable in this study is important especially in the photosynthesis
is closely related to each other. During the and other physiology activities of plants such
seed filling period in this study, the increase as cell division, tissue development, and plant
in accumulation of dry matter and nutrient growth. The weight yield of seeds is a fac-
deficiencies resulted in disruption of seed tor that determines the high productivity of
development. This occurs due to the availabi- yields per hectare. The factor is influenced by
lity of water as a solvent in the soil is limi- the complex inheritance and can also involve
ted, so that the need for nutrients absorbed by other factors (Boer, 2011). Harvesting time
plants is insufficient. The water is a univer- can also affect the weight of seed yield, as ex-
sal solvent, and can dissolve various types of pressed by (Butar & Lubis, 2018).
chemical compounds (Putri et al., 2017). Taken together, it can be concluded
Another thing is the rainfall during the that the application of baglog compost and
experiment was relatively low with an ave- sheep manure fertilizer increased the number
rage of 134.32 mm/month causing nutrients of flowers and empty pods. Sheep manure
in the soil difficult to dissolve. Elements such treatment at concentration of 120 g/plant at 5
as phosphorus and potassium are essential for Weeks after planting significantly increased
plants to develop seeds and roots. Potassium number of flowers. Moreover, Sheep manure
also serves to form flowers, fruit and helps fertilizer at a concentration of 120 g/plant, in-
fight disease (Sondakh et al., 2012). As ex- creased the dry weight of pods, seed, and 100
plained by (Widarti et al., 2015), that to com- seeds even though was not significant.
pile 0.1-0.4% of the dry matter of plants, the
element of phosphorus is needed, this element
Jurnal Biodjati 6(1):153-161, May 2021 159Jurnal Biodjati 6(1):153-161, May 2021
http://journal.uinsgd.ac.id/index.php/biodjati
ACKNOWLEDGEMENTS Monograf Balai Penelitian Tanaman
Aneka Kacang dan Umbi, 13, 394–406.
The authors would like to thank the Hidayati, Y. A., A. K., Tb. B. & Harlia, E.
Directorate Research and Community Ser- (2013). Analysis of Total Bacteria and
vice, Directorate General of Research and Identification of Bacteria in Liquid
Strengthening Development of the Ministry of Fertilizer with the Addition of Sheep
Research, Technology, and Higher Education Feces Saccharomyces cereivisiae.
through Beginner Lecturer Research Grant Jurnal Ilmu Ternak Universitas Padja-
Program in 2018 for funding this research. djaran, 13(2), 1–3.
Hulopi, F. (2006). Pengaruh Penggunaan Pu-
REFERENCES puk Kandang dan NPK Terhadap Per-
tumbuhan dan Hasil Tanaman Kacang
Bellapama, I. A., Hendarto, K. & Widyastuti, Tanah. Buana Sains, 6(2), 165–170.
R. A. D. (2015). Pengaruh Pemupukan Mahdiannoor, Istiqomah, N. & Syahbudin.
Organik Limbah Baglog Jamur dan (2017). Growth and Yield Two Soybean
Pemupukan Takaran NPK Terhadap Varieties (Glycine max L.) with Bio-
Pertumbuhan dan Produksi Pakchoy fertilzer Application. Zaraa’ah, 42(3),
(Brassica chinensis L.). J. Agrotek 257–266.
Tropika, 3(3), 327–331. Marliah, A., Hidayat, T. & Husna, N. (2012).
Boer, D. (2011). Genetic Variability and Path The Effect of Some Varieties and Spa-
Coefficient Analysis for Some Agro- cing on Growth of Soybean (Glycine
nomic and Physiology Characters of max (L.) Merrill). Agrista, 16(1), 22–23.
Seed Yield on Genetic Diversity of 54 Onwubiko, N. C., Uguru, M. I., Ngwuta, A.
Accessions of Maize from East Indo- A., Inyang, E. T. & Nnajiemere, O. J.
nesia. Agroteknos, 1(1), 35–43. (2013). Floral biology of Bambara
Butar, D. V. B. & Lubis, I. (2018). Response groundnut [Vigna subterranea (L.)
of Soybean Genotypes (Glycine max L. Verdc]. African Journal of Dairy Far-
Merrill) from Various Countries to En- ming and Milk Production, 1(3), 57–58.
vironmental Condition at The Experi- Putri, K. P. & Pramono, A. A. (2013). (Stage of
mental Field IPB Sawah Baru. Buletin Flower, Fruit and Reproductive Success
Agrohorti, 6(2), 258–269. of Adenanthera pavonina L.). Peneli-
Dinarto, W. & Astriani, D. (2012). Produktivi- tian Hutan Tanaman, 10(3), 147–154.
tas Kacang Tanah di Lahan Kering Pada Putri, L. M. A., Prihandono, T. & Supriadi, B.
Berbagai Intensitas Penyiangan. Agri- (2017). Pengaruh Konsentrasi Larutan
sains, 3(4), 33–43. Terhadap Laju Kenaikan Suhu Larutan.
Faronika, M., Siregar, L. A. M. & Hasyim, Pembelajaran Fisika, 6(2), 147–153.
H. (2013). Evaluasi Produktifitas dan Rahmah, N. L., Anggarini, S., Pulungan, M.
Kualitas Beberapa Varietas Kacang H., Hidayat, N. & Wignyanto. (2014).
Tanah (Arachis hypogaea L.) Di Tanah The Making of Oyster Mushroom Log
Bertekstur Liat. Agroekoteknologi, 1(2), Waste Cpmpost: Study on Goat Manure,
201–213. EM4 Concentration and Reversal Time.
Ginting, E., Yulifianti, R. & Utomo, J. S. Teknologi Pertanian, 15(14), 59–66.
(2015). Standar Mutu Kacang Tanah. Santoso, S. (2016). Buku panduan SPSS 23.
Sobari & Fathurohman 160Jurnal Biodjati 6(1):153-161, May 2021
http://journal.uinsgd.ac.id/index.php/biodjati
Jakarta: Elex Media Komputindo. Stalker, H. T., Tallury, S. P., Seijo, G. &
Sawara, Nurmas, A. & A. J., M. D. (2012). Leal-Bertioli, S. C. M. (2016). Bio-
Growth and Yield of Soybean (Glycine logy, Speciation, and Utilization of
max L.) All Guano Fertilizer and Tall Peanut Species. In Peanuts: Genetics,
Grass Mulsch. Agroteknos, 2(2), 97– Processing, and Utilization. USA: Aca-
105. demic Press and AOCS Press
Sembiring, M., Sipayung, R. & Sitepu, F. Sudarto, Hipi, A. & Herawati, N. (2014). Pen-
E. (2014). Growth and Peanut Pro- garuh Teknologi Pemupukan Terhadap
duction With Provision of Empty Hasil Kacang Tanah Di Lahan Kering
Palm Bunches at different Pile Up Lombok Timur. Prosiding Seminar
Frequency. Jurnal Online Agro- Hasil Penelitian Tanaman Aneka Ka-
ekoteknologi, 2(2), 598–606. cang dan Umbi, 4 (Oldeman 1980),
Sholihah, S. (2016). Kacang tanah. In Out- 687–690.
look Komoditas Pertanian Sub Sektor Tamura, P., Soelistyono, R. & Guritno, B.
Tanaman Pangan. Jakara: Pusat Data (2017). Effect of Plant Spacing and Dose
dan Sistem Informasi Pertanian Kemen- Giving Chicken Manure on Growth and
terian Pertanian. Yield of Soybean (Glycine max L.).
Sobari, E. (2016). Panduan Teknik Pengola- Produksi Tanaman, 5(8), 1329–1337.
han dan Pengawetan Pangan. Yogya- Widarti, B. N., Wardhini, W. K. & Sarwono,
karta: Deepublish. E. (2015). Pengaruh Rasio C/N Bahan
Sobari, E. (2018). Teknologi Pengolahan Baku Pada Pembuatan Kompos dari
Pangan. Yogyakarta: Andi Publisher. Kubis dan Kulit Pisang. Integrasi Pro-
Sobari, E. & Wicaksana, N. (2017). Genetic ses, 5(2), 75–80.
Diversity and Relationship of Bambara Zharare, E. G., Blamey, F. C. P. & Asher, L. C.
Groundnut (Vigna subteranea L.) Geno- (2010). Some Observations on The Cul-
type Landraces of West Java. Jurnal ture of Attached Groundnut (Arachis
Agro, 4(2), 90–96. hypogaea L .) Gynophores in Simpli-
Sobari, E., Fathurohman, F. & Hadi, M. A. fied Nutrient Solutions. African Journal
(2018). The Character Growth of Pea- of Plant Science, 4(8), 296–299.
nut (Arachis hypogaea L.) with Com-
post Mushroom Baglog and Manure of
Lamb. Agrin, 22(2), 116–122.
Sondakh, T. D., Joroh, D. N., Tulungen, A.
G., Sumampow, D. M. F., Kapugu, L.
B. & Mamarimbing, R. (2012). Peanut
(Arachis hypogaea L.) Yield on Some
types of Organic Fertilizer. Eugenia,
18(1), 64–72.
Jurnal Biodjati 6(1):153-161, May 2021 161You can also read