Technical Advisory Group Summary of Advice - 16 April 2020 - Gov.Wales
←
→
Page content transcription
If your browser does not render page correctly, please read the page content below

Technical Advisory Group

Summary of Advice
16 April 2020

 © Crown copyright 2021
NOT WELSH GOVERNMENT POLICY TAC ADVICE ONLY
Technical Advisory Cell: Summary of Advice
16 April 2021
Top-line summary
The most recent estimate of the Rt for Wales from SAGE for the period ending
30th March is between 0.7 and 1.2 (90% confidence interval). As at 14 April, Rt
estimated by Public Health Wales (PHW) which is less lagging but uses case
data only, is 0.8 (95% confidence interval: 0.7 to 0.9).
Currently cases, admissions and deaths are relatively low and Wales is on a
consistent down-wave, which means Rt is becoming more volatile and as a result
of local outbreaks rather than being an indicator of widespread community
transmission. At this time, it is more useful to look at incidence and prevalence
measures than Rt.
Case numbers appear to have stabilised at a low level, with more than half
of Wales’ local authorities at less than 15 cases per 100k and at a national level
Wales is at 17.9 cases per 100k. Following the peak of the first wave on 10 April
this level was first seen on June 3 2020, marking the beginning of proposals to
allow the public to safely use a range of outdoor spaces.
As reported by PHW in the most recent week, case incidence has decreased or
remained stable in all age groups, although the highest case incidence continues
to be in the oldest age groups.
As reported by PHW, as at 18 April over 1.6 million first doses of COVID-19
vaccine and over 0.6 million second doses have been given in Wales.
Recent analysis by ONS suggests that as at 28 March 2021, 49.1% of the 16+
population tested positive for antibodies to COVID-19 from a blood sample
(95% credible interval: 43.2% to 54.9%).
For the week of 4 to 10 April 2021, the COVID-19 infection survey estimates that
community Covid-19 infection rates in Wales have decreased further to around
1 in 920 (95% credible interval: 1 in 2,080 to 1 in 510).
Confirmed cases of COVID-19 in hospital and ICU beds continue to decrease
and are at levels last seen in mid-September 2020. COVID-19 deaths reported
by PHW rapid mortality surveillance up to 12 April are decreasing slightly, with 9
deaths reported for the preceding 7 day period.
As at 16 April, VOC-20DEC-01 (B.1.1.7, first identified in the UK) remains the
dominant variant in Wales. There have been 35 genomically confirmed and
probable cases of VOC-20DEC-02 (+6) (B.1.351, the variant linked to South
Africa) and 10 cases of the variant VUI-21FEB-03 (B.1.525, linked to Nigeria)
(+4). 1 case of the variant VUI-21JAN-01 (P.1, first identified in Brazil via Japan)
has been identified in Wales.
Mobility data has increased sharply in several categories from the 12th April –
for example movement of Facebook users on Saturday 17 April were the
highest for a Saturday since 29 August 2020 whilst request for driving
Page 2 of 24
NOT WELSH GOVERNMENT POLICY TAC ADVICE ONLY
directions from Apple on Friday 16 April were the highest for a Friday since 18
September 2020.
Reproduction number and Growth Rate
SAGE estimate
SAGE have stated that as prevalence falls, individual clusters and outbreaks will
have a greater effect on regional estimates rather than community transmission.
As a result estimates of R and daily growth rate become less useful as a guide
to the state of the epidemic when there is more variability in the population.
The most recent estimate of the Rt for Wales from SAGE on 13 April (as at
30 March) is between 0.7 and 1.2 (90% confidence interval).
The most recent daily growth rate for Wales from SAGE estimates that the
infection rate in Wales is changing by between -5% and +1% per day (90%
confidence interval).
The Reproduction number (Rt) is the average number of secondary infections
produced by a single infected individual. Rt is an average value over time,
geographies, and communities. This should be considered when interpreting the
Rt estimate for the UK given the differences in policies across the four nations.
The estimate of Rt is shown as a range (90 or 95% confidence intervals) without
a central estimate and is a lagging indicator.
Growth rate reflects how quickly the numbers of infections are changing day by
day. It is an approximation of the percentage change in the number of infections
each day. Growth rate is also a lagging indicator and shown as a range (90 or
95% confidence intervals) without a central estimate. Figures are shown as either
doubling if R is above 1, or halving if Rt is below 1.
Care should be taken when interpreting Rt and growth rate estimates for the UK,
due to their inherently lagged nature, their correlation with testing incidence and
that national estimates can mask regional variation in the number of infections
and rates of transmission.
Currently cases, admissions and deaths are relatively low and Wales is on a
consistent down-wave, which means Rt is becoming more volatile and as a
result of local outbreaks rather than being an indicator of widespread
community transmission. At this time, it is more useful to look at incidence and
prevalence measures than Rt.
For more information on the models that are used to create the SPI-M/ SAGE
consensus on R, please see the UK Government website.
The table below shows the Growth rate and Rt estimated by SAGE on 7 April
across the 4 UK Nations.
No UK estimates for Rt or growth rate are available. This is because as
restrictions are lifted independently across the 4 nations SPI-M advises that Rt
and growth rates for the four nations and NHS England regions are more robust
and useful metrics than those for the whole UK.
Page 3 of 24
NOT WELSH GOVERNMENT POLICY TAC ADVICE ONLY
Growth rate per
Nation Rt (90% CI)
day (90% CI)
Wales* 0.7 to 1.2 -5% to +1%
England 0.7 to 1.0 -6% to -1%
Scotland* 0.8 to 1.0 -4% to 0%
Northern Ireland* 0.7 to 1.0 -6% to -1%
*Particular care should be taken when interpreting these estimates as they are based on low
numbers of cases and / or dominated by clustered outbreaks and so should not be treated as
robust enough to inform policy decisions alone.
Public Health Wales (PHW) estimate
PHW also estimate Rt for Wales using data on the number of positive Covid-19
testing episodes for the last 7 day rolling period. Like the SAGE estimate these
figures should be interpreted with caution as the number of positive cases
detected can be a reflection of the amount of testing. It is assumed there is no
change in testing patterns for the duration of these estimates.
Halving times have also been calculated using 14 days of rolling data. The most
recent 3 days of data were excluded to account for testing and reporting lag.
Predictions were then extended. The R package “Incidence” was used to
calculate doubling times. https://www.repidemicsconsortium.org/incidence
As at 14 April, PHW estimates Rt in Wales to be 0.8 (95% CI: 0.7 to 0.9). The
growth rate time is estimated to be halving every 32 days (95% CI: 12 to -52).
Case numbers
The figure below shows weekly COVID-19 cases per 100k population (7 day
rolling sum). The most recent data up to 12 April shows a decrease in cases to
17.6 cases per 100k population, a 5% decrease from the previous 7 day period.
Source: Welsh Government dashboard, Data from PHW
Page 4 of 24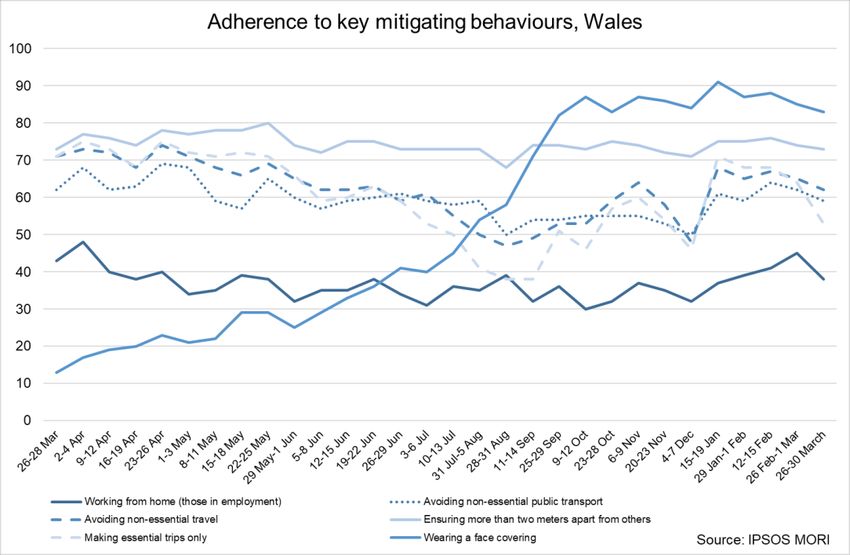
NOT WELSH GOVERNMENT POLICY TAC ADVICE ONLY
Age profile
The Figure below shows the number of weekly cases per 100,000 population, by
age group and local authority up to 10 April. Incidence has decreased or
remained stable in all age groups, with 90+ and 80-89 at the highest incidence
at 36.05 and 26.45 respectively.
Source: Welsh Government dashboard, Data from PHW
Wales Local Authority Update
Note that at low incidence levels changes between weeks will be more variable,
as a result of the impact of localised outbreaks against a background of low
cases.
Recent surveillance data for Wales for the 7 day period ending 12 April
suggests that COVID-19 case incidence across almost much of Wales
continues to decrease or remain stable, although there have been increases in
some areas caused by local outbreaks (see below table).
Case incidence per 100,000 population for the whole of Wales during this
period was 17.9, a small reduction from the previous period. Cases for all-
Wales are still in the 15 to
NOT WELSH GOVERNMENT POLICY                                                                 TAC ADVICE ONLY

  Cases and Tests - All confirmed episodes - For the 7 day period ending 12-04-2021
                                                   Case                   Change                                  Test
                                      % of All               Incidence                 Test       Positivity
                    Health                       Incidence                  from                               Incidence
Local Authority              Number   Wales                  threshold               positivity   threshold
                    Board                           per                   previous                                per
                                       Total                  reached                  (%)         reached
                                                  100,000                   week                                100,000
                                                                                                    2.5 to
   Gwynedd          BCUHB      38      0.067       30.5      25 to < 50    41% ↑       0.032                        940.1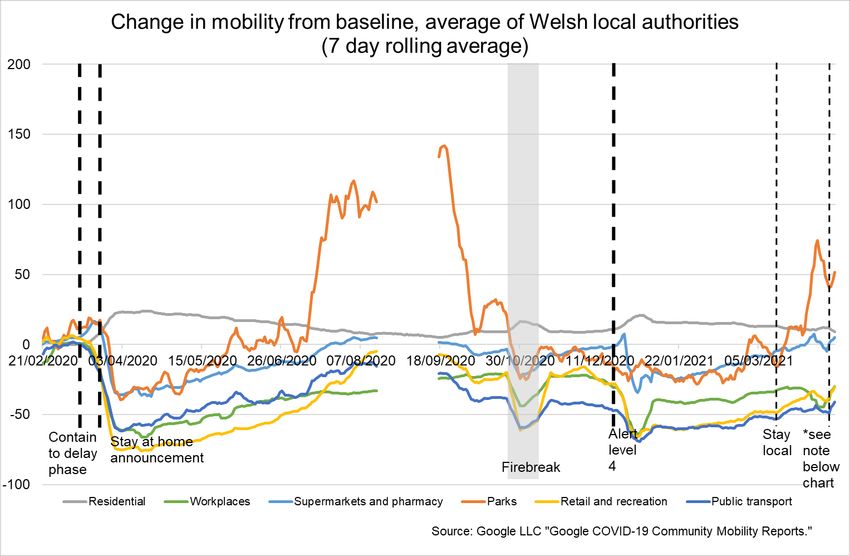
NOT WELSH GOVERNMENT POLICY TAC ADVICE ONLY
been confirmed with a positive laboratory test and the clinician suspects COVID-
19 was a causative factor. It does not include patients who may have died from
COVID-19 but who were not confirmed by laboratory testing, those who died in
other settings, or Welsh residents who died outside of Wales as a result the true
number of deaths will be higher.
Source: Welsh Government dashboard, Data from PHW
ONS: Deaths registered weekly in England and Wales
The Office for National Statistics (ONS) reports on both suspected and confirmed
COVID-19 deaths using data available on completion of the death registration
process and is more complete, albeit subject to a greater time lag. Figures are
based on the date the death was registered, not when it occurred. There is
usually a delay of at least five days between occurrence and registration.
Trends in this week’s release should be interpreted with caution. Because of the
movement of Easter, Good Friday does not always fall in Week 13 so may not
be included in the average.
In Wales, the total number of deaths registered decreased from 651 in the
previous week to 483 in the week ending 2 April.
In Wales, the number of weekly registered deaths involving COVID-19
decreased by 53% to 15 from 32, accounting for 3.1% of all deaths compared
with 4.9% the previous week.
Source: ONS, Deaths registered weekly in England and Wales, provisional:
week ending 2 April 2021
Variant Update
VOC 202012/01 (B.1.1.7, first identified in Kent) has been detected in all parts of
Wales and continues to grow; 11,126 genomically probable or confirmed cases
Page 7 of 24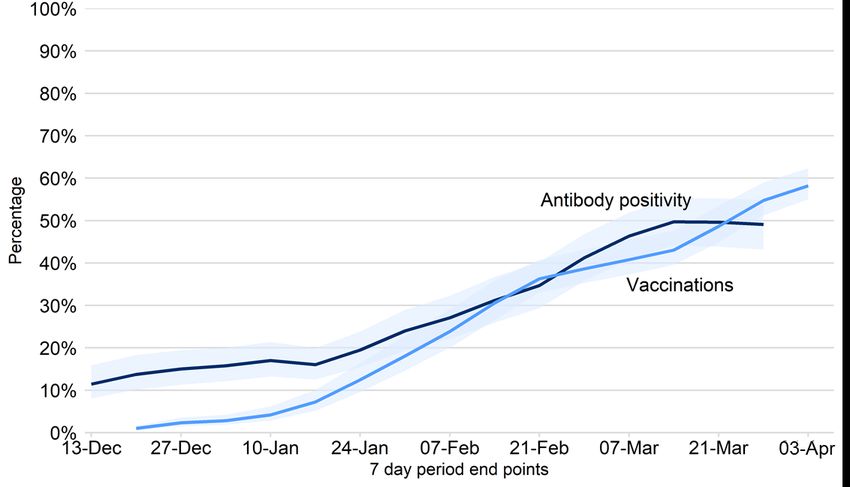
NOT WELSH GOVERNMENT POLICY TAC ADVICE ONLY
have been identified as at 15/04/2021 (Note these now 2,346 historical cases
sequenced by the Wellcome Sanger Institute not previously reported).
There have been 35 genomically confirmed and probable cases of VOC-20DEC-
02 (B.1.351, first identified in South Africa) in Wales as at 16 April, an increase
of 6 cases since the previous report.
There have been 10 genomically confirmed and probable cases of the variant
VUI-21FEB-03 (B.1.525, first identified in Nigeria) in Wales, an increase of 4
cases since the previous report.
There has been 1 genomically confirmed and probable cases of the variant VUI-
21JAN-01 (P.1, first identified in Brazil via Japan) has been identified in Wales.
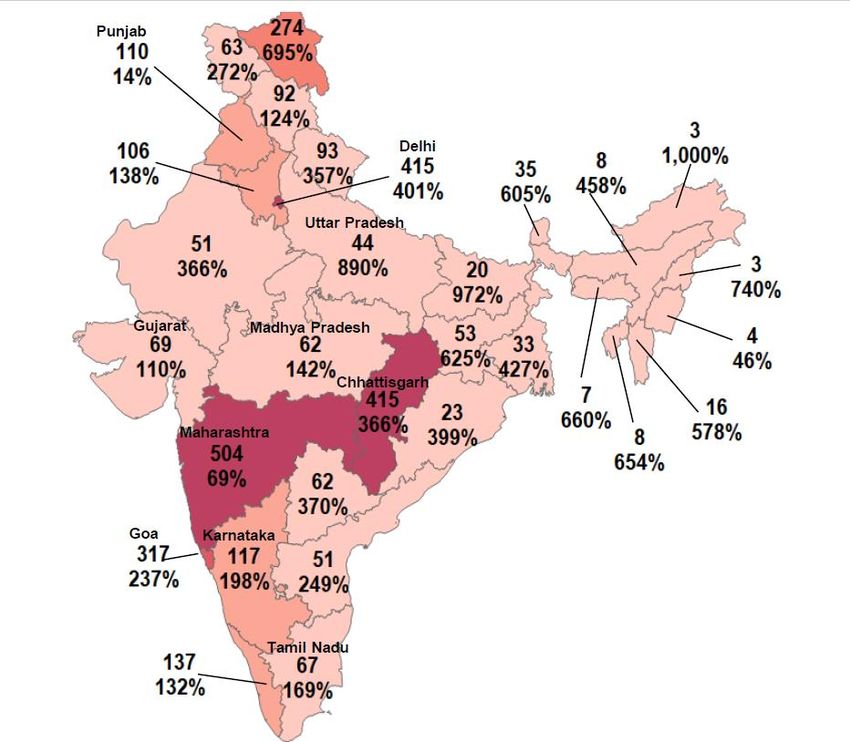
International update
The latest data from Europe (ECDC) shows the continued rise in cases across
most countries in central and eastern Europe.
The vaccination rate across the globe is increasing but Israel has slowed
considerably as they reach the end of their programme and only have the
younger cohorts to vaccinate
Page 8 of 24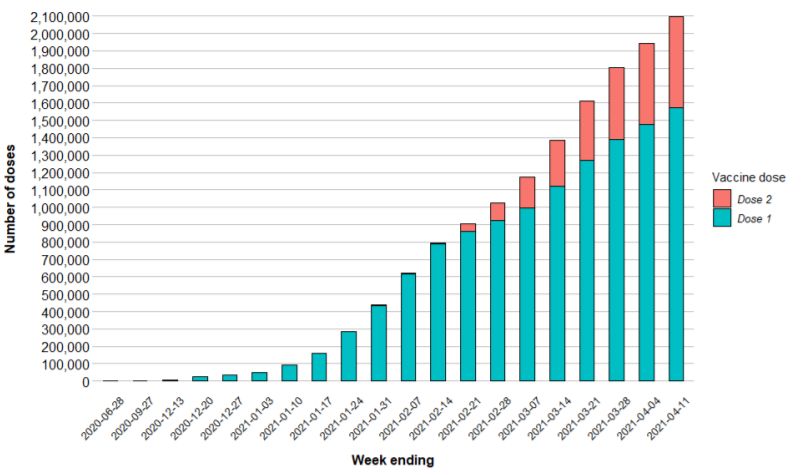
NOT WELSH GOVERNMENT POLICY TAC ADVICE ONLY
Some countries that are experiencing a surge in cases like Iran are still to ramp
up vaccination due to access to supply issues.
China administers over 4.3 million vaccines a day, India and the US 3.4M a day
and Brazil over 1M a day.
Of the 841M vaccines used so far globally the US has used the bulk at over
195M doses. China 180M and India has used 114M, while Europe 165M in total
combined 77% of global supply. The UK has used just over 40M.
With only 2% of the world fully vaccinated there is a long way still to go
India Spotlight
As Delhi enters a six-day lockdown we examine the current spread of the virus
and VOC in the country. On April 16th India recorded 219,000 new cases
pushing the total so far to 14.2 million. - Fig. 1 Cases per million in India
Page 9 of 24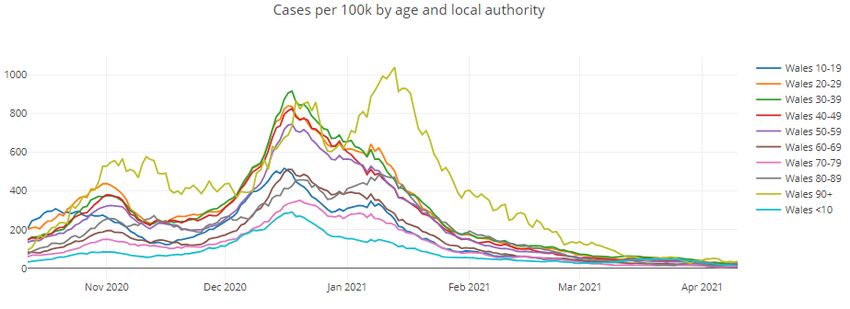
NOT WELSH GOVERNMENT POLICY TAC ADVICE ONLY
Fig 1. Cases per million in India (Source: Our World in Data)
India’s second wave has overtaken the spike of the first wave by surging past
the 100,000 daily new cases mark in the past week, 80% of new cases were in
Maharashtra, Chhattisgarh, Karnataka, Uttar Pradesh, Tamil Nadu, Delhi,
Madhya Pradesh, Punjab and Gujarat. Whilst the rise in cases is quicker than
during the first wave, the spread has been felt most acutely in these 9 states.
(see Fig 2. below)
As of 16 April, India had administered 124m vaccinations to its population of
1.366 billion. 28m of these doses have been administered to healthcare and
frontline workers (first and second doses). The current administration rate
stands at approximately 2m vaccines per day.
Though India’s case fatality rate has remained below 1.35%, it is rising across
many Indian states and as deaths lag behind cases the next couple of weeks
will be crucial to see whether the case fatality rate will rise across the country.
The government has attributed the surge to individual behaviour. Health
officials have also cited large scale election rallies, new variants, limited
knowledge of the dynamics of immunity and pandemic fatigue.
Whilst India lacks the ability to conduct testing and variant sequencing at scale,
B.1.1.7 and emerging variants (e.g. B.1.617) are thought to be behind the
significant increase in cases, particularly in Maharashtra
Vaccination manufacturing efforts are set to increase as Russia ’s Sputnik V
vaccine has been granted emergency use status. India is set to become a
manufacturing hub for Sputnik V as other domestic pharmaceutical companies
(Bharat Biotech) conduct trials of an intra nasal Covid 19 vaccination.
Page 10 of 24NOT WELSH GOVERNMENT POLICY TAC ADVICE ONLY
Fig. 2. The 7 day average and percentage change after 14 days in Indian
states (12th April) Source: COVID19 India API
Covid-19 Infection Survey results (Office for National Statistics)
The latest estimates for Wales from the Coronavirus (COVID-19) Infection
Survey (CIS) have been published on the Welsh Government statistics and
research web pages and the Office for National Statistics website. The results
include estimates for the number and proportion of people in Wales that had
COVID-19 in the latest week, 4 to 10 April 2021.
Estimates are provided for the ‘community population’, i.e. private households
only; residents in care homes, communal establishments and hospitals are not
included.
Please note that there is a greater lag in data from the infection survey than from
other sources such as Public Health Wales.
It is important to stress the uncertainty around these figures. Since the survey
picks up relatively few positive tests overall, the results can be sensitive to small
changes in the number of these positive tests.
Latest estimates and recent trends for Wales:
For the week 4 to 10 April 2021, an average of 0.11% of the community
population had COVID-19 (95% credible interval: 0.05% to 0.20%).
This equates to approximately 1 person in every 920 (95% credible interval: 1
in 2,080 to 1 in 510), or 3,300 people during this time (95% credible interval:
1,500 to 6,000).
Page 11 of 24NOT WELSH GOVERNMENT POLICY TAC ADVICE ONLY
The trend in the percentage of people testing positive in Wales has decreased
in recent weeks.
In the most recent week, the trend is uncertain for people testing positive for
strains compatible with the UK variant, not compatible with the variant and
cases where the virus is too low for the variant to be identifiable.
Please note that there is a greater lag in data from the infection survey than
from other sources such as Public Health Wales.
It is important to stress the uncertainty around these figures. Since the survey
picks up relatively few positive tests overall, the results can be sensitive to
small changes in the number of these positive tests.Wales, estimated %
testing positive for Covid 19 since 28 February
Age analysis:
Rates of positive cases vary by age, but appear to have decreased in all age
groups in recent weeks.
In the data used to produce these estimates, the number of people sampled in
the different ages who tested positive for COVID-19 was lower relative to Wales
overall. This means there is a higher degree of uncertainty in estimates for
individual age groups over this period. Caution should be taken in over-
interpreting any small movements in the latest trend, particularly where
confidence intervals are large.
The percentage testing positive by age The percentage testing positive by age on 7
on 3 March 2021 April 2021
Page 12 of 24NOT WELSH GOVERNMENT POLICY TAC ADVICE ONLY
Latest estimates for the UK countries
At the midpoint of the most recent week (4 to 10 April 2021) rates were low
across all four countries. The highest estimated percentages of the community
population with COVID-19 among the nations of the UK were in England (0.21%)
and Scotland (0.20%) whilst Wales appeared to have the lowest.
In the most recent week, rates have decreased in England, Scotland and
Northern Ireland. Wales has also seen a decrease in recent weeks.
Positivity rates (%) across UK countries since 28 February 2021
Incidence of new positive cases was highest in England and Scotland during the
week ending 3 April 2021, and lowest in Wales.
Across the UK, the incidence rate appears to be level in Wales in the week up to
3 April and has decreased in Scotland and Northern Ireland. There are also early
signs of a decrease in England.
Credible intervals can be wide due to relatively small sample sizes, and care
should be taken in interpreting results. When prevalence is very low it may not be
possible to produce an estimate.
Source: Coronavirus (COVID-19) Infection Survey, ONS
Page 13 of 24NOT WELSH GOVERNMENT POLICY TAC ADVICE ONLY
Antibody data from the Coronavirus (COVID-19) infection Survey (CIS) in Wales: 22
to 28 March 2021
The latest antibody estimates for Wales from the Coronavirus (COVID-19)
Infection Survey (CIS) have been published on the Welsh Government statistics
and research web pages and the Office for National Statistics website.
The latest results provide estimates of the number and proportion of people in
Wales that have tested positive for antibodies to SARS-CoV-2 between 22 and
28 March 2021.The estimates can be used to identify individuals who have had
the infection in the past or have developed antibodies as a result of vaccination.
Estimates of antibody positivity have been produced using a new model. Further
information on the new method used to model antibody estimates can be found
on the ONS website. Estimates of the percentage of people who have reported
via the survey that they have received one or more doses of a COVID-19
vaccination are also included for context.
1. Key results for Wales
Between 22 and 28 March 2021, 49.1% of the 16+ population tested positive for
antibodies to COVID-19 from a blood sample (95% credible interval: 43.2% to
54.9%).
Though there is uncertainty with the estimates, it appears that the antibody rates
have levelled off recently. This may be due to the estimates not yet showing the
impact of individuals receiving their second vaccination doses.
As more people become vaccinated the number of people with antibodies is
expected to increase. However the detection of antibodies alone is not a precise
measure of immunity protection acquired from vaccinations
Antibody levels in the blood can decline over time, meaning that some people
who have previously had COVID-19 may subsequently test negative for
antibodies. For this reason, these figures should be regarded as estimates of
monthly prevalence, not cumulative exposure.
Page 14 of 24NOT WELSH GOVERNMENT POLICY TAC ADVICE ONLY
Estimated percentage of the population in Wales testing positive for
coronavirus (COVID-19) antibodies, December 2020 to March 2021
Source: Coronavirus (COVID-19) Infection Survey, ONS
The blue bars give point estimates and the vertical lines indicate the 95% credible intervals.
Estimates shown for 7 day periods from 7 December 2020 to 28 March 2021.
Antibody positivity and vaccinations over time
The modelled estimates suggest that the antibody rate has levelled off recently,
whereas the percentage of people that have reported they have had at least one
dose of a COVID vaccine continued to increase.
Between 22 and 28 March 2021, 54.8% of people aged 16 and over reported to
have had one or more dose of a COVID-19 vaccine (95% credible interval: 51.3%
to 59.0%)
This levelling off in antibody positivity may be due to the estimates not yet
showing the impact of individuals receiving their second vaccination doses. In
addition, it is important to note that antibody positivity is defined by a fixed
amount of antibodies in the blood. Most vaccinated individuals will have
increased their antibody levels but this may not have reached or stayed above
the threshold.
The vaccinations estimates are not the same as the published figures from Public
Health Wales on recorded vaccinations. There will be differences between these
modelled estimates and the official figures due to differences in coverage,
methods and timeliness. The estimates produced from the survey are helpful to
compare with other characteristics, such as testing positive for antibodies
Antibody data presented is a week behind vaccination data as there is a time lag
on when antibody data is received, whereas vaccine data is self-reported and
more readily available.
Page 15 of 24NOT WELSH GOVERNMENT POLICY TAC ADVICE ONLY
The denominators used for vaccination estimates are the total people in the
survey sample at that particular time point, then it is post-stratified by the mid-
year population estimate.
Estimated percentage of the population in Wales reporting receipt of
vaccination and testing positive for coronavirus (COVID-19) antibodies since
December 2020
Source: Coronavirus (COVID-19) Infection Survey, ONS
The blue line and shading represent the modelled trend and 95% credible
intervals for people testing positive for antibodies (dark blue) and people reported
having had at least one dose of a COVID vaccine (light blue).
Antibody positivity and vaccinations by age
Between 22 and 28 March, the highest percentage of people testing positive for
antibodies was in those aged 65 to 69 years at 79.7% (95% credible interval:
72.9% to 85.3%).
The percentage of people testing positive for antibodies for those aged 16 to 64
years ranged from 31.3% to 63.6%. For those aged 65 years and over, antibody
positivity ranged from 68.0% to 79.7%.
The reduction in positivity rates for the older age groups may be due to the
estimates not yet showing the impact of individuals receiving their second
vaccination doses. In addition, it is important to note that antibody positivity is
defined by a fixed amount of antibodies in the blood. Most vaccinated individuals
will have increased their antibody levels but this may not have reached or stayed
above the threshold.
It is noticeable that the proportion of people reporting they have had at least one
dose of a COVID vaccine was also highest in the older age groups. Therefore it is
Page 16 of 24NOT WELSH GOVERNMENT POLICY TAC ADVICE ONLY
likely that high antibody rates in these age groups are due to higher vaccination
rates.
In the younger age groups, the proportion of people testing positive for antibodies
is generally higher than the proportion reporting to have had at least one dose of
a COVID vaccine. This may imply that antibody rates in the younger ages are
more likely to be driven by COVID infections than vaccinations.
This survey does not include those that live in care homes, one of the priority
groups identified by the Joint Committee on Vaccination and Immunisation
(JCVI). Daily and weekly counts of vaccine doses administered by nation can be
seen in the Public Heath Wales (PHW) dashboard.
Caution should be taken in over-interpreting the latest estimates. Credible
intervals are wide and the sample size is relatively low, meaning there is higher
uncertainty in these figures.
An interactive tool that visualises the percentages testing positive for COVID-19
antibodies by single year of age over time is published in the antibody article on
the ONS website.
Estimated percentage of the population in Wales reporting receipt of
vaccination and testing positive for coronavirus (COVID-19) antibodies by age
group, 22 to 28 March 2021
Source: Coronavirus (COVID-19) Infection Survey, ONS
The bars give estimates for people testing positive for antibodies (blue) and that reported
having had at least one dose of a COVID vaccine (dark blue) the horizontal lines indicate the
95% credible intervals. Estimates shown for the 7 day period from 22 to 28 March 2021.
Page 17 of 24NOT WELSH GOVERNMENT POLICY TAC ADVICE ONLY
Vaccination in Wales
Whilst numbers will be higher due to ongoing data entry, as at 18 April 2021
1,692,463 first doses of COVID-19 vaccine have been given in Wales and 602,807
second doses have been given.
Source: PHW Covid-19 Rapid Surveillance Dashboard
Source: Wales COVID-19 Vaccination Weekly Surveillance Summary
Adherence and understanding of current measures
The data from IPSIS MORI is the same as last week.
The most recent IPSOS MORI data for the period 26 – 30 March for Wales
shows reductions in some categories compared to the last survey wave which
was 4 weeks prior (26 February - 1 March). Most notably a reduction in those
making essential trips only – this follows the change in guidance from stay at
Page 18 of 24NOT WELSH GOVERNMENT POLICY TAC ADVICE ONLY
home in the last survey to being able to travel within Wales/staying local. It
should be noted that this is self-reported adherence and will be affected by
individuals understanding of the rules and the circumstances that apply to them.
Some restrictions were lifted on 27 March, during the data collection period, as
a result of the 12 March review cycle (e.g. stay local requirement and first
phased reopening of the tourist sector).
The figure below represents data collected online by IPSOS MORI as part of a
multi-country survey on the Global Advisor platform. Each of the waves has
included c.500 respondents in Wales. The sample is broadly representative of
the adult population aged 16-74. Data is weighted to reflect the age and gender
profile of the Welsh population aged 16-74. All samples have a margin of error
around them. For a sample of around 500, this is +/- 4.8 percentage points.
Mobility
The most recent mobility data covers the first week or so after the changes in
guidelines from the 12 April, which include no travel restrictions, schools
returning following Easter and non-essential retail re-opening. Mobility
increased sharply in several categories from the 12th April – for example
movement of Facebook users on Saturday 17 April were the highest for a
Saturday since 29 August 2020 whilst request for driving directions from Apple
on Friday 16 April were the highest for a Friday since 18 September 2020.
Page 19 of 24NOT WELSH GOVERNMENT POLICY TAC ADVICE ONLY
Mobility of Facebook users in Wales shows movement was 1% below the
baseline for the week to the 17 April. This is lower than the week before (14%
below the baseline). The percentage of users staying put (near to home) was
24%, down from the week before (29%). The baseline is the average value, for
the corresponding day of the week, during the 4-week period 2 February – 29
February 2020.
Apple data for the week to the 17 April shows that requests for driving directions
in Wales were higher than the previous week at 18% above the baseline (up
from 5% above the baseline). Requests for walking directions and requests for
public transport directions also increased compared to the previous week
relative to the baseline. The baseline is the 13th of January 2020.
The Google mobility data to the week of the 14 April for residential (i.e people
spending time at home) were lower than the week before at 9% above the
baseline (down from 12%). Workplaces rose relative to the baseline by 15
percentage points (at 30% below the baseline). Note that the previous week to
the 7 April includes two bank holidays during the Easter period. Retail &
recreation mobility was up from the previous week (30% below the baseline, up
from 38%) and supermarkets & pharmacy also rose (at 5% above the baseline,
up from 1% above). Public transport mobility increased whilst parks decreased
over the week relative to the baseline.
The figure below shows the change in mobility in Wales using Google mobility
data. The figures are based on the average of the local authorities that have
data. The baseline is the median value, for the corresponding day of the week,
during the 5-week period Jan 3–Feb 6, 2020. The data for several categories
is not available for August 16th – September 10th due to the data not meeting
quality thresholds.
Page 20 of 24NOT WELSH GOVERNMENT POLICY TAC ADVICE ONLY
*Changes include no travel restrictions, schools returning and non-essential retail re-opening.
Anonymised and aggregated mobile phone data from O2 for the week to the 9
April shows a decrease in trips compared to the week before. Trips starting in
Wales fell by 2 percentage points to 69% of the baseline. The baseline for the
O2 data is the same day of the week in the first week of March.
COVID-19 weekly surveillance and epidemiological summary from Public
Health Wales (as at 14 April)
The proportion of calls to NHS 111 and NHS Direct related to possible COVID-
19 symptoms have decreased compared to the previous week.
Overall GP consultations for any Acute Respiratory Infection (ARI) have
remained stable in the most recent week and suspected COVID consultations
have decreased.
The overall number of ambulance calls and calls possibly related to COVID- have
decreased in the most recent week.
The all-Wales number of lab confirmed COVID-19 episodes has decreased in
the most recent week. Sample positivity for testing episodes was 1.9% in week
14.
Confirmed case incidence has decreased or remained stable in all regions of
Wales. Testing episode positivity continues to decrease nationally.
During week 14, incidence decreased or remained stable in all age groups.
Incidence was highest in those aged 85+.
Page 21 of 24NOT WELSH GOVERNMENT POLICY TAC ADVICE ONLY
At a national level, confirmed case admissions to hospitals and confirmed cases
who are inpatients in hospital decreased compared to the previous week. In the
most recent week, admissions to critical care wards also decreased compared
to the previous week.
Recent surveillance data suggest that COVID-19 infections in Wales are
decreasing in all regions of Wales. Cases remain geographically widespread,
however the majority of local authority (LA) areas are seeing decreasing overall
trends in confirmed case incidence in the most recent week.
Although the distribution of cases at MSOA level in the most recent week still
suggests geographically wide-spread activity, the number of MSOAs with
confirmed cases and the number of cases per MSOA continue to decrease.
There was a decrease in the number of incidents logged in Tarian in the most
recent week.
Influenza is not currently circulating in Wales and RSV has not circulated over
the 2020-21 winter period.
Hospital occupancy
The figure below shows the hospital occupancy of suspected and confirmed
Covid-19 positive patients over the first and second wave of the pandemic (7
day rolling average, as at 9 April).
For the most recent 7 day period ending 16 April the average weekly Covid-19
confirmed hospital occupancy was 56, a 42% reduction from the previous
period.
The Figure below shows the invasive ventilated bed occupancy of confirmed
COVID-19 positive patients (7 day rolling average, as at 31 March).
For the most recent 7 day period ending 16 April the average Covid-19
confirmed ICU occupancy was 12, a 20% reduction from the previous period.
Page 22 of 24NOT WELSH GOVERNMENT POLICY TAC ADVICE ONLY
The number of people in hospital recovering from COVID-19 also continues to
decrease overall and is at 212 as at 16 April, a 41% reduction from the previous
7 day period.
The Figure below shows the number of people admitted to hospital who are either
suspected or confirmed as having Covid-19 (COV+). The purple line represents
the total number over a rolling 7 day average, whilst the fainter grey lines show
the actual figures at that time.
The 7 day daily average hospital admissions as at 9 April was 16, an 11%
reduction from the previous period.
The Figure below shows the number of hospital discharges of people who are
either suspected (SUS) or confirmed as having Covid-19 (COV+). The purple line
represents the total number over a rolling 7 day average, whilst the fainter grey
lines show the actual figures at that time.
The 7 day daily average hospital discharges as at 16 April was 13, remaining
stable with the previous 7 day period.
Page 23 of 24NOT WELSH GOVERNMENT POLICY TAC ADVICE ONLY
The Figure below shows patients admitted to Level 3 ICU and are either
suspected (SUS) or confirmed as having Covid-19 (COV+). The purple line
represents the total number over a rolling 7 day average, whilst the fainter grey
lines show the actual figures at that time.
The 7 day daily average as at 16 April was 0.4, a 43% reduction from the
previous 7 day period.
Source: Welsh Government dashboard, Data from StatsWales
Professional Head of Intelligence Assessment (PHIA) probability
yardstick
Where appropriate, TAC advice will express Likelihood or confidence in the
advice provided using the PHIA probability yardstick to ensure consistency
across the different elements of advice.
Page 24 of 24You can also read