Osteopathy modulates brain-heart interaction in chronic pain patients: an ASL study - Nature
←
→
Page content transcription
If your browser does not render page correctly, please read the page content below
www.nature.com/scientificreports
OPEN Osteopathy modulates brain–heart
interaction in chronic pain patients:
an ASL study
Francesco Cerritelli1,3, Piero Chiacchiaretta1,2*, Francesco Gambi1,2, Raoul Saggini4,
Mauro Gianni Perrucci1,2 & Antonio Ferretti1,2
In this study we used a combination of measures including regional cerebral blood flow (rCBF) and
heart rate variability (HRV) to investigate brain–heart correlates of longitudinal baseline changes
of chronic low back pain (cLBP) after osteopathic manipulative treatment (OMT). Thirty-two right-
handed patients were randomised and divided into 4 weekly session of OMT (N = 16) or Sham (N = 16).
Participants aged 42.3 ± 7.3 (M/F: 20/12) with cLBP (duration: 14.6 ± 8.0 m). At the end of the study,
patients receiving OMT showed decreased baseline rCBF within several regions belonging to the
pain matrix (left posterior insula, left anterior cingulate cortex, left thalamus), sensory regions
(left superior parietal lobe), middle frontal lobe and left cuneus. Conversely, rCBF was increased in
right anterior insula, bilateral striatum, left posterior cingulate cortex, right prefrontal cortex, left
cerebellum and right ventroposterior lateral thalamus in the OMT group as compared with Sham.
OMT showed a statistically significant negative correlation between baseline High Frequency HRV
changes and rCBF changes at T2 in the left posterior insula and bilateral lentiform nucleus. The same
brain regions showed a positive correlation between rCBF changes and Low Frequency HRV baseline
changes at T2. These findings suggest that OMT can play a significant role in regulating brain–heart
interaction mechanisms.
Osteopathy is a wide-spread complementary medicine that steadily increased during the last decade, especially
in pain t reatment1. Several clinical studies explored the effects of osteopathic manipulative treatment (OMT)
in different pain conditions and specifically in low back pain (LBP). OMT showed significant benefit on pain
intensity2, functional d
isability3, health-related quality of l ife4, functional r ecovery3,5 and drugs c onsumption6,7.
A recent systematic review showed that the use of OMT is clinically effective in pain relief (mean difference
− 12.91; 95% CI − 20.00 to − 5.82) and functional status (standardized mean difference − 0.36; 95% CI − 0.58 to
− 0.14) in acute and chronic nonspecific LBP8. These data led to the updating of US Guidelines for OMT in LBP
patients, establishing the clinically relevant effects of OMT9. However as suggested by the Task Force on the Low
Back Pain Clinical Practice Guidelines “more research is needed to understand the mechanics of OMT and its
short- and long-term effects”9.
Short-term neurobiological effects seem to show that OMT has a peripheral parasympathetic anti-inflam-
matory effect10–19.
Despite these clinical studies, only few papers were published investigating the effect of OMT using MRI.
Recently, using Blood Oxygen Level Dependent (BOLD) fMRI, Cerritelli and colleagues showed that 4 sessions
of osteopathic treatment induce a specific and distinct effect on brain activation in areas related to interoception
(bilateral insula and anterior cingulate cortex) as well as in the right middle frontal gyrus and left s triatum20.
However, there is only one study that used MRI and regional cerebral blood flow (rCBF) to investigate the
post-treatment effects of OMT in asymptomatic v olunteers21. Tamburella and colleagues showed an effect of
OMT on rCBF, indicating that brain perfusion was reduced in the posterior cingulate cortex and superior
parietal lobule immediately after treatment, implying a possible involvement of the central autonomic network,
indicating a potential central role of autonomic nervous system (ANS). However, the authors stressed the need
to investigate the effects of OMT on both the ANS and CBF. The current study is designed to meet this need by
1
Department of Neuroscience, Imaging and Clinical Sciences, “G. D’Annunzio” University of Chieti-Pescara, Via dei
Vestini, 33, Chieti Scalo, Italy. 2ITAB‑Institute for Advanced Biomedical Technologies, “G. D’Annunzio” University
of Chieti-Pescara, Chieti, Italy. 3Clinical‑Based Human Research Department, Foundation C.O.ME. Collaboration,
Pescara, Italy. 4School of Specialty in Physical and Rehabilitation Medicine, “G. D’Annunzio” University of
Chieti-Pescara, Chieti, Italy. *email: p.chiacchiaretta@unich.it
Scientific Reports | (2021) 11:4556 | https://doi.org/10.1038/s41598-021-83893-8 1
Vol.:(0123456789)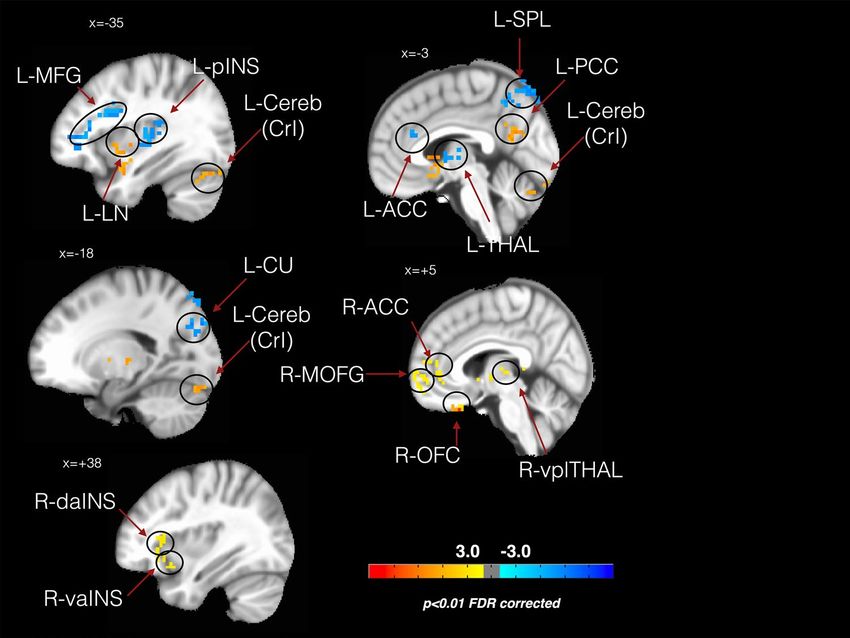
www.nature.com/scientificreports/
Study group (OMT) Control group (Sham) p < |t|
Age 41.8 ± 6.6 42.7 ± 8.0 0.73
Male 9 (60) 11 (73.3) 0.70*
BMI 24.1 ± 3.5 25.5 ± 2.4 0.19
LBP duration (m) 15.1 ± 9.2 14.1 ± 6.7 0.72
General scores
STAI-Y1 42.4 ± 3.4 42.7 ± 2.9 0.85
STAI-Y2 41.3 ± 3.0 41.1 ± 3.7 0.87
TEMPS-A 8.8 ± 3.4 9.27 ± 4.1 0.48
Pain scores
VAS—T0 63.1 ± 21.4 57.5 ± 17.3 0.10
VAS—T1 31.3 ± 21.7 47.5 ± 15.4 < 0.001
VAS—T2 18.3 ± 20.5 53.7 ± 23.6 < 0.001
Oswestry—T0 24.9 ± 3.3 26.0 ± 5.2 0.51
Oswestry—T1 16.4 ± 2.6 25.2 ± 4.1 < 0.01
Oswestry—T2 10.8 ± 2.1 24.5 ± 3.7 < 0.001
Roland-Morris—T0 15.5 ± 4.0 15.3 ± 4.9 0.90
Roland-Morris—T1 11.4 ± 3.4 15.0 ± 3.8 < 0.01
Roland-Morris—T2 8.7 ± 2.6 14.9 ± 4.6 < 0.001
Table 1. Clinical characteristics of study population. Numbers in table are mean ± SD or *N(%). P values from
Student t test and *Chi square. BMI body mass index, LBP low back pain, VAS visual analogue scale.
using Arterial Spin Labeling (ASL) to assess regional brain perfusion, and simultaneous measurement of cardiac
and respiratory activity to derive ANS indexes such as the heart rate variability (HRV).
Although fMRI based on the BOLD contrast can detect subtle signal variations due to graded stimulation with
high sensitivity22–24, it is unable to offer a quantitative measure of brain activity associated to a single condition.
In this regard, BOLD is severely limited when it is not possible to alternate control and experimental conditions.
This is particularly true for chronic pain studies, where it is not possible to switch on and off different pain levels
at will as required by standard BOLD paradigms. In contrast, noninvasive measurement of regional CBF using
ASL25, offers the opportunity to obtain a measure of a well-defined physiological variable that can quantify both
baseline and task induced variation of brain activity. Importantly, CBF can be measured for each condition
independently, even when they are separated by days or months with good long term r eproducibility26, making
ASL a technique naturally suitable to study chronic pain or a ging27–29. Thus, examining changes in rCBF over
time has been considered a relevant option to study pain processing29–31. In this study we use a combination of
measures including rCBF and HRV to investigate brain and heart rate correlates of changes in baseline levels of
chronic LBP (cLBP) after OMT.
A recent meta-analysis of fMRI data reported that chronic pain patients showed a major role of the following
structures related to the pain matrix: bilateral precentral (BA6&BA44) and postcentral gyri (BA40), bilateral
insula, left S2, left dorsal ACC (BA32), left cingulate gyrus, right medial frontal gyrus (MFG), left anterior cer-
ebellum, bilateral basal ganglia and bilateral t halamus32.
According to Tanasescu and colleagues, the most frequently reported brain areas involved in chronic pain
were the right posterior insula (BA13) (63% of all chronic pain research), the left BA13 and the bilateral inferior
parietal lobule (S2; BA40) in 37–50% of all studies. About a third of the study reported bilateral putamen as well32.
Interestingly enough, some of these brain areas, such as bilateral midcingulate cortex, left posterior and right
anterior insula and left amygdala, are recognized as core regions of the central control of autonomic s ystem33.
Indeed, Beissner et al. synthetized, in a seminal paper, the features of the so called central autonomic network
(CAN), which controls the sympathetic and parasympathetic divisions that have largely divergent specific regula-
tory networks, differentially involved in affective, cognitive, and somatosensory–motor tasks33.
We hypothesized that the OMT, as compared to the control condition, would induce a decrease in rCBF in
a widespread network of brain regions, including (but not exclusively) those of the pain matrix and an increase
in parasympathetic activity as measured by HRV.
Results
Description of the sample at the baseline. Thirty-two right-handed patients were randomised and
divided into the study (N = 16) and control group (N = 16). Two patients (1 in the study group and 1 in the con-
trol group) dropped out during the study, leading to a final sample size of 30 patients (Figure S1). At the base-
line, there were no statistically significant differences between groups in terms of age, gender, BMI and clinical
characteristics of pain in (Table 1). Only the 10% of the patients correctly guess the group allocation (OMT: 2/15;
Sham: 3/15; X2 = 0.24, p = 0.62).
At the end of the study period, the pain scales showed significant differences between the two groups (Table 1).
Table 2 reports rCBF values among the different groups and time points.
Scientific Reports | (2021) 11:4556 | https://doi.org/10.1038/s41598-021-83893-8 2
Vol:.(1234567890)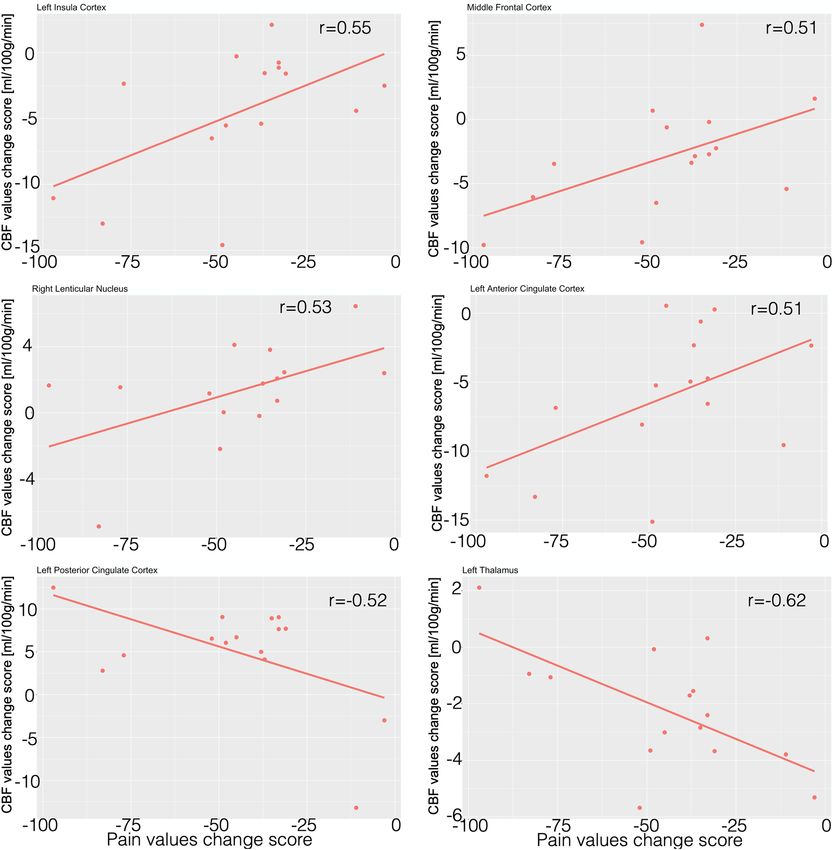
www.nature.com/scientificreports/
OMT SHAM
ROI T0 T1 T2 T0 T1 T2
Left posterior insula 52 ± 3 52 ± 2 47 ± 5 51 ± 3 52 ± 4 50 ± 2
Left anterior cingulate cortex 52 ± 3 51 ± 2 45 ± 5 50 ± 2 51 ± 5 49 ± 3
Left posterior cingulate cortex 46 ± 2 46 ± 2 51 ± 5 46 ± 2 47 ± 2 46 ± 3
Left lentiform nucleus 49 ± 2 49 ± 1 51 ± 3 50 ± 2 49 ± 3 47 ± 2
Left middle frontal lobe 49 ± 4 49 ± 3 46 ± 5 48 ± 3 47 ± 4 47 ± 4
Left cuneus 51 ± 3 48 ± 3 46 ± 4 49 ± 3 48 ± 4 48 ± 2
Left superior parietal lobe 50 ± 4 49 ± 4 53 ± 5 49 ± 4 48 ± 7 46 ± 4
Right lentiform nucleus 48 ± 2 48 ± 2 49 ± 4 48 ± 3 48 ± 2 46 ± 1
Left thalamus 49 ± 2 49 ± 3 46 ± 2 49 ± 3 49 ± 2 51 ± 2
Left cerebellum (crus 1) 44 ± 5 43 ± 4 47 ± 5 42 ± 3 42 ± 3 40 ± 1
Right anterior cingulate cortex 52 ± 3 51 ± 3 54 ± 2 54 ± 3 54 ± 3 50 ± 3
Right ventral anterior insula 51 ± 2 50 ± 2 53 ± 3 53 ± 2 54 ± 5 50 ± 3
Right dorsal anterior insula 51 ± 4 50 ± 3 53 ± 4 53 ± 4 55 ± 5 52 ± 4
Right mid orbital gyrus 51 ± 3 50 ± 2 53 ± 2 52 ± 3 53 ± 3 50 ± 4
Right orbito frontal cortex 41 ± 1 42 ± 1 43 ± 3 42 ± 2 43 ± 3 41 ± 2
Right ventro postero lateral thalamus 46 ± 2 46 ± 2 48 ± 2 48 ± 2 48 ± 2 46 ± 2
Table 2. rCBF values. Regional CBF values on region of interests (ROI) in both study groups at different time
points. Values are expressed in ml/100 g/min. T0 baseline, T1 immediately after the first session, T2 at the end
of the study period.
The effect of osteopathic treatment on CBF. The control contrast T0_OMT vs T0_SHAM revealed no
significant differences between the two groups for rCBF values at baseline.
The whole brain analysis (Fig. 1) showed differences between groups in CBF values on specific regions
only for the following contrasts (T2_OMT–T0_OMT) vs (T2_SHAM–T0_SHAM) and (T2_OMT–T1_OMT)
vs (T2_SHAM–T1_SHAM): the left posterior insula (L-pINS), right ventral anterior insula (R-vaINS), right
dorsal anterior insula (R-daINS) left anterior cingulate cortex (L-ACC), left superior parietal lobe (L-SPL) and
the left middle frontal lobe (L-MFL, a subregion of the left frontal cortex), the left and right striatum, specifi-
cally the lentiform nuclei (L-LN, R-LN), the left posterior cingulate cortex (L-PCC), the left cuneus (L-CU), left
thalamus (L-THAL), right ventroposterior lateral thalamic nucleus (R-vplTHAL), right orbito-frontal cortex
(R-OFC), right anterior cingulate cortex (R-ACC), right mid orbital frontal gyrus (R-MOFG) and the left cer-
ebellum crus 1 (L-Cereb(CrI)).
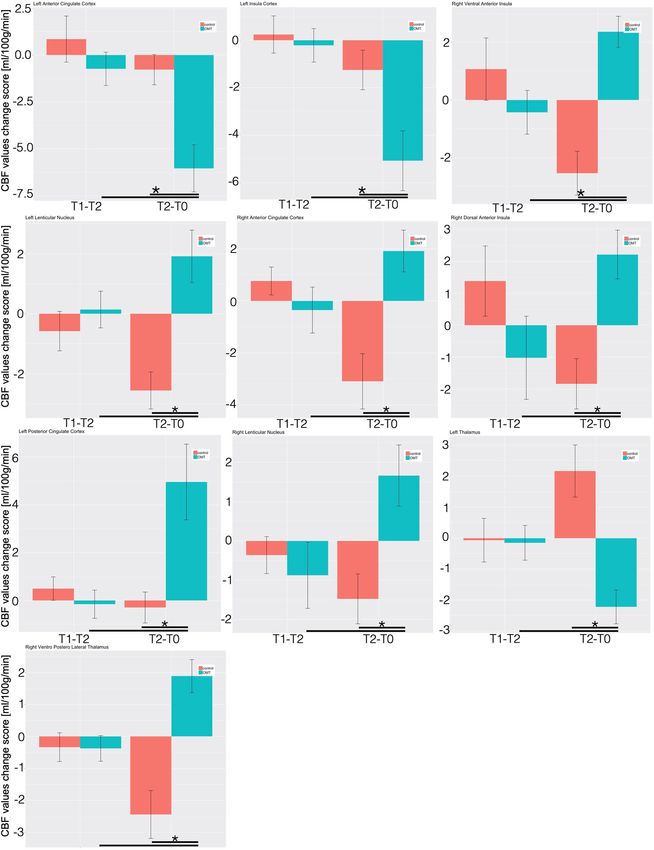
Considering the region of interest (ROI) analysis, the mixed effect regression (MER) analysis showed that, as
compared with control group, patients that received OMT demonstrated decreased regional CBF in the L-pINS,
L-ACC, L-MFL, L-THAL and the L-CU (Fig. 2 and Table S1).
Conversely, rCBF was increased in the L-LN, R-LN, L-PCC, L-SPL, R-vaINS, R-daINS, R-vplTHAL, R-OFC,
R-ACC, R-MOFG and L-Cereb (CrI) in OMT patients as compared with controls (Table S1, Fig. 2 and Figure S2).
Post-hoc analysis revealed that these changes were statistically significant only at T2 and not immediately
after the first treatment session.
Table S2 showed post-hoc effect size computation with a large effect size for the majority of the ROI. Besides,
post-hoc calculation of study power demonstrated an adequate power for almost all the ROI included.
Relationships between rCBF and self‑reported pain. Considering regions in which CBF changes due
to treatment were significantly different between groups, 6 ROIs showed a significant correlation of CBF varia-
tion with variation of VAS pain score (both evaluated for T2–T0) (Table 3). This significance was demonstrated
to be only present in the OMT group and not in the control group.
Specifically, baseline CBF changes at T2 in the OMT group were significantly correlated with the correspond-
ing changes in VAS scores in the L-pINS (r = 0.55; p = 0.03), L-ACC (r = 0.51; p = 0.04), L-MFL (r = 0.50; p = 0.04),
R-LN (r = 0.53; p = 0.04), L-PCC (r = − 0.52; p = 0.04) and L-thalamus (r = − 0.62, p = 0.01) (Fig. 3).
No correlation was demonstrated to be statistically significant at T1, i.e. immediately after the first session,
for both groups.
HRV results. MER showed a statistically significant difference between groups on the nuHF (p < 0.001)
(Fig. 4). Tukey post-hoc analysis revealed that OMT group significantly increased nuHF-values compared to
sham at T2 (p < 0.01) but not at T1.
Similarly, statistically significant differences were revealed for nuLF (p < 0.01), LH/HF ratio (p < 0.01) and
DFA-a1 (p < 0.05). Tukey post-hoc analysis demonstrated that in all the HRV parameters the OMT group had a
significant effect compared to sham at T2 but not at T1.
Scientific Reports | (2021) 11:4556 | https://doi.org/10.1038/s41598-021-83893-8 3
Vol.:(0123456789)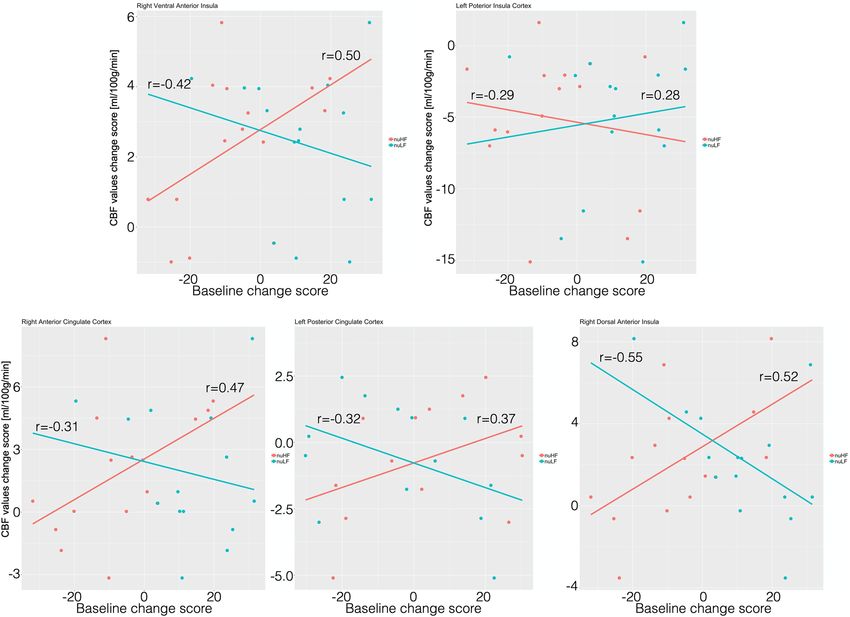
www.nature.com/scientificreports/
Figure 1. The effects of osteopathic treatment on regional cerebral flow. The figure shows CBF changes
baseline-controlled group differences between treatment and sham group at T2 (referring to the contrast
described in the text as (T2_OMT–T0_OMT) vs (T2_SHAM–T0_SHAM)—p < 0.01, false discovery rate
(FDR) corrected). L-MFG left middle frontal gyrus, L-pINS left posterior insula, L-LN left lentiform nucleus,
L-Cereb(CrI) left cerebellum (Crus I), L-ACCleft anterior cingulate cortex, L-SPL left superior parietal
lobe, L-PCC left posterior cingulate cortex, L-THAL left thalamus, L-CU left cuneus, R-ACCright anterior
cingulate cortex, R-MOFG right mid orbitofrontal gyrus, R-OFC right orbito frontal cortex, R-vplTHAL right
ventroposterior lateral thalamus, R-daINS right dorsal anterior insula, R-vaINS right ventral anterior insula.
In addition, other time domain parameters (Table S3) showed similar results, including heart rate (p < 0.05),
RMSSD (p < 0.05), NN50 (p < 0.01), pNN50 (p < 0.001). Sample entropy did not show any statistically significant
difference (p = 0.19).
Relationships between rCBF and HRV parameters and pain. Only in the OMT group, a statistically
significant negative correlation (Fig. 5) was found between rCBF changes and baseline nuHF changes at T2 in
L-pINS (r = − 0.29; p = 0.05), whereas positive correlations were shown for L-PCC (r = 0.37, p = 0.03), R-vaINS
(r = 0.50, p = 0.01), R-daINS (r = 0.52, p = 0.01) and R-ACC (r = 0.47, p = 0.02).
Furthermore, the same brain regions showed opposite correlations at T2 between rCBF changes and nuLF
changes: L-pINS (r = − 0.28; p = 0.05), L-PCC (r = − 0.32, p = 0.05), R-vaINS (r = − 0.42, p = 0.03), R-daINS
(r = − 0.55, p = 0.01) and R-ACC (r = − 0.31, p = 0.05).
Also, data showed a positive correlation between nuHF and pain (r = 0.27; p = 0.002) in the OMT group but
not in the control sample (r = − 0.17; p = 0.08).
Again, no statistically significant correlations were depicted at T1 between all parameters above-mentioned.
Discussion
Results from this trial showed that OMT has a two-fold effect: central, that is a change in the brain by modifying
the CBF in some but not all the areas related to the pain matrix, and peripheral, that is an autonomic effect as
measured by a change in HRV, specifically on HF and DFA-a1.
To our best knowledge, this is the first experimental evidence of such combined modifications, providing
suggestions that a mutual interconnection response might mainly mediate this brain-and-heart effect due to the
administration of osteopathic treatment.
After the OMT sessions there was a significant CBF decrease in some brain areas related to pain, that is
L-pINS, L-ACC and L-thalamus, an increase of CBF values in the L-PCC, lentiform nuclei, R-vaINS, R-daINS and
R-vplTHAL (Figs. 2, 3 and Table 2). In addition, the CBF modification in 6 pain-related areas showed significant
correlations with reduction of baseline VAS pain in the OMT group but not in the controls. Specifically, positive
correlations were found on L-pINS, L-ACC, L-MFL, right lentiform nucleus, whereas a negative correlation was
detected for the L-PCC and L-thalamus.
Scientific Reports | (2021) 11:4556 | https://doi.org/10.1038/s41598-021-83893-8 4
Vol:.(1234567890)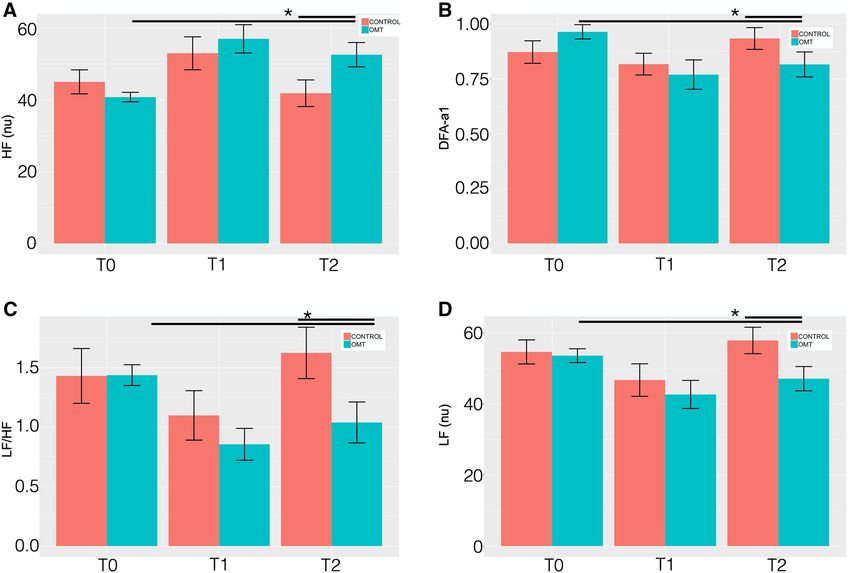
www.nature.com/scientificreports/

                                  Figure 2.  Longitudinal CBF delta changes. The figure shows the longitudinal CBF mean change within the
                                  regions of interest for the two groups. *Statistically significant differences (p < 0.05) between groups.

Scientific Reports |   (2021) 11:4556 |               https://doi.org/10.1038/s41598-021-83893-8                                               5

                                                                                                                                          Vol.:(0123456789)
www.nature.com/scientificreports/
OMT p values SHAM p values
Left posterior insula 0.55 0.03 − 0.07 0.79
Left anterior cingulate cortex 0.51 0.05 0.14 0.62
Left posterior cingulate cortex − 0.52 0.04 0.05 0.84
Left lentiform nucleus 0.35 0.20 0.16 0.58
Left middle frontal lobe 0.51 0.05 − 0.36 0.20
Left cuneus − 0.04 0.87 0.05 0.84
Left superior parietal lobe − 0.06 0.83 0.33 0.25
Right lentiform nucleus 0.53 0.04 − 0.27 0.35
Left thalamus − 0.62 0.01 − 0.07 0.80
Left cerebellum (crus I) 0.19 0.50 0.30 0.28
Right anterior cingulate cortex − 0.40 0.13 − 0.25 0.37
Right dorsal anterior insula − 0.14 0.61 − 0.04 0.88
Right ventral anterior insula − 0.08 0.75 0.23 0.40
Right mid orbital gyrus 0.04 0.89 − 0.27 0.32
Right orbitofrontal cortex − 0.30 0.28 0.17 0.53
Right ventro postero lateral thalamus 0.27 0.33 − 0.02 0.94
Table 3. Correlation values between baseline change response of rCBF and VAS pain score at T2. Bold values
showed statistically significant changes.
These findings expand the results reported from previous fMRI studies in the same group of cLBP p atients20
and in asymptomatic healthy subjects21,34–36. Interestingly, Tamburella and colleagues reported that a single
OMT session produced an immediate blood flow changes in L-PCC and L-SPL21. The present study extends
this previous work by examining effects in chronic LBP patients, over an extended period and combining HRV
measurements. That is, while previous research has used CBF measurements immediately after a single OMT
session and after three days, here we report not only that larger CBF changes are observed in response to a longer
osteopathic treatment period (4 sessions over a 1-month treatment period) but that these effects are linked to a
change in autonomic response. We interpret the accompanying decrease of CBF in pain-related areas as reflect-
ing the positive influence of osteopathic treatment on heart rate variability and pain perception on LBP patients’
physiological state, hypothesizing a potential OMT effect on central mechanisms of endogenous pain modulation.
Further support of our hypothesis that OMT might act on CBF through the ANS by reducing the inflamma-
tory milieu of the tissue comes from the analysis of the CBF values in combination with autonomic reactions.
Our findings are in line with previous studies demonstrating an increase in CBF on areas related to chronic
pain. Indeed, the increase of CBF in pain-related areas was also observed in neuralgia pain patients and positively
correlated to pain intensity37. The insula, S1, and thalamus were previously linked to both acute and chronic
pain38,39, and it was reported that these regions encode discriminative sensory components of acute pain in
terms of both intensity and somatotopy40–42. Additionally, INS and S1 consistently show increased activity in
chronic pain43,44. A 2016 meta-analysis demonstrated that in chronic pain studies the following areas were most
frequently reported: bilateral INS—in particular the right posterior insula and the left insula, left inferior pari-
etal lobule, left dorsal ACC (BA32), bilateral precentral (BA6&BA44) and postcentral gyri (BA40), right medial
frontal gyrus, bilateral basal ganglia, i.e. putamen, bilateral thalamus and left anterior cerebellum32. Thus, CBF
increases in several pain conditions, specifically in the pain regions. Our data showed that the use of 4 sessions
of osteopathic treatment produced significant variations of baseline CBF values in some but not all the areas
related to pain. This result might mean distinct regulation of the blood flow with a specificity of response, that
is a decrease in L-pINS, L-ACC and left thalamus and an increase in L-PCC, right anterior insula, bilateral basal
ganglia, right thalamus.
Nevertheless, these variations might be linked to significant changes in the control of the central autonomic
network (CAN). Beissner and colleagues in a 2013 metanalysis focusing on CAN suggested that the prefrontal,
anterior, and midcingulate, right ventral anterior insular and left posterior insular cortices are involved with
sympathetic activity whereas the PCC, lateral temporal cortices, bilateral dorsal aINS with parasympathetic
responses33. These brain areas appear to be distinctively associated with cognitive output (ACC, INS, SPL) or to
somatosensory output (PCC) of CAN. These findings were recently confirmed and extended by Valenza et al.,
who identified additional regions such as the precuneus, angular gyrus, and c erebellum45.
Therefore, we might argue that the central effect of OMT—which elicited a change in brain perfusions within
specific areas also related to CAN, specifically bilateral ACC, R-vaINS, R-daINS, L-pINS, L-PCC—can be linked
to the regulation of CAN on both sympathetic and parasympathetic components. Beissner et al.’s proposal on
the distinction between sympathetic and parasympathetic might explain the different behaviours we found on
CBF reactions in the current s tudy33. However, we need to consider that Beissner and c olleagues33 as well as
Valenza and colleagues45 summarized studies mainly based on healthy subjects, with and without CBF data, in
rest and task-based paradigms. Interestingly, Chouchou et al., recently showed that stimulation of the anterior
insula mainly induced a cardiovagal-mediated decrease in the heart rate, whereas stimulation of the posterior
insula mostly produced a sympathetically mediated increase46. This might also be consistent with our results
Scientific Reports | (2021) 11:4556 | https://doi.org/10.1038/s41598-021-83893-8 6
Vol:.(1234567890)www.nature.com/scientificreports/
Figure 3. Correlation between rCBF and pain. The figure shows the significant positive and negative
correlations between regional cerebral blood flow mean changes within ROI and pain intensity changes in the
treatment group.
where the OMT increased the perfusion of the right anterior insula, reduced the perfusion of the L-pINS and
increased nuHF, reflecting a decrease in heart rate.
Thayer and colleagues originally proposed the association between CAN and HRV within the Neurovisceral
Integration Model (NVI), a model where the variability of heart rate, as measured by HRV, is considered a valu-
able proxy for the brain state47. This model was further developed recently by Smith and colleagues who better
explored and contextualized the NVI model proposing eight neurofunctional hierarchical levels of control over
the vagus nerve (see Smith et al. for d etails48).
In particular, relevant for this discussion about the role of vagus nerve as parasympathetic output and central
autonomic control, is the level 6, which includes INS and ACC, that regulates processes incorporating perceptual
representations of one’s current bodily state, and level 7, which includes the PCC, that further regulates these
processes embracing conceptual interpretations of the meaning of both exteroceptive and interoceptive sensory
input. In sum, these higher-order brain areas hierarchically regulate the neurovisceral system by, among oth-
ers, controlling the cardiac autonomic output. Therefore, the fact that we observed cardiac autonomic effects
on chronic pain population and that these sequelae are associated to central patterns generates discussion on
(i) changes in the cross-organs relationship, more specifically brain and heart, after OMT, (ii) the relationship
between brain, heart and peripheral tissue.
Interestingly, examples of coordinated cross-organ reactions include the impact of cardiac functions on cer-
ebral activity49,50. Thus, modulating the cardiac output by a parasympathetic effect produces a direct effect on
Scientific Reports | (2021) 11:4556 | https://doi.org/10.1038/s41598-021-83893-8 7
Vol.:(0123456789)www.nature.com/scientificreports/
Figure 4. Heart rate variability changes between the study and control group. Heart rate variability (HRV)
findings for: (A) high frequency (HF) normalised units (nu); (B) detrended fluctuation scaling exponent
(DFAα1); (C) low frequency/high frequency ratio (LF/HF); (D) low frequency (LF—nu). Data presented are
means ± standard deviation (SD). *Statistically significant differences (p < 0.05) in OMT group compared to
sham and control groups.
cerebral activity. Our data showed that a sympathetic response is associated with a decrease of CBF in some brain
areas related to the pain matrix. This means that a relative reduction of blood flow might be arguably produced
based on a sympathetic response. This might be conceptually understood as pain patients express higher baseline
CBF values in these regions compared to asymptomatic-healthy subjects.
Clinical and laboratory research demonstrated the role of sympathetic branch in preventing increase of
CBF51–54, acting as a neurogenic modulator when hemodynamic changes challenge cerebral activity. Therefore,
applying a treatment, which produces a reduction of pain, might justify lower perfusion of these areas and thus a
relative decrease of blood flow51. On the contrary, exploring the cardiac data, the findings of the present study are
consistent with previous research on adults, which concluded that osteopathic approach produces an increase in
parasympathetic tone leading to a trophotropic e ffect12. Thus, a double effect seems to be produced where a pre-
vailing sympathetic response is observed centrally, whereas a major parasympathetic effect is showed peripherally.
To further explore this hypothesis, it has been argued that the osteopathic approach might act through an anti-
inflammatory and hyperparasympathetic effect mediated by i nteroception13. While we did not include a measure
of pro-inflammatory levels in this study, it has previously been reported that in a sample of LBP patients the use
of OMT can reduce cytokines levels16 and this reduction is associated to a reduction of pain p erception15. Our
sample showed a significant reduction of pain perception and better overall clinical conditions, possibly related
to a reduction of pro-inflammatory state in the tissue leading to a change in the neurogenic neuroinflammation55.
The ANS, CAN and interoception mediate all these processes. Modifying the metabolic state of the tissue, there-
fore, produces a proxy for unmyelinated c-fibers that in turn, through the spinothalamic tract, results into the
activation of the insular cortex, specifically the posterior lobe of the left i nsula56–59.
Interestingly, our data showed that the left posterior INS is a specific target of the osteopathic effect. Also, the
other areas involved after OMT are consistent with the hypothesis of the awareness model58, where the insula
receives input from other areas of the brain including hedonic areas (PCC, ACC). Therefore, we might argue
that the use of osteopathic treatment might produce a significant change in the cerebral activity, specifically on
key areas related to CAN and thus to interoception and interoceptive control.
The present study only examined the immediate and 1-month sustained effect of OMT on chronic pain
patients. Future work is needed to determine whether there are longer-term, clinically and brain significant,
benefits of this type of manual intervention and if so, what dose, in terms of frequency and duration, is required.
Systematic evaluation of the effects of OMT on chronic pain patients by Cerritelli and colleagues have deter-
mined that eight treatment sessions over a 6 month period are sufficient to decrease pain, disability and migraine
attacks per m onth60. Therefore, comparing immediate effects with long-term outcomes would shed light on the
Scientific Reports | (2021) 11:4556 | https://doi.org/10.1038/s41598-021-83893-8 8
Vol:.(1234567890)www.nature.com/scientificreports/
Figure 5. Correlation between heart rate variability changes and rCBF in the study group. The figure shows the
significant positive and negative correlations between regional cerebral blood flow mean changes within ROI
and nuHF (red line) and nuLF (cyan line) changes in the treatment group.
brain changes that might occur. Furthermore, although the post-hoc analysis showed an adequate power for the
majority of the ROIs, future CBF studies might benefit from an a priori power calculation.
In conclusion, osteopathic interventions can have some clinical benefits, but a greater understanding of the
neurobiological mechanisms is needed to optimize pain protocols and ameliorate the long-term negative conse-
quences of pain. The present study supports the hypothesis that OMT can induce CBF changes by acting through
autonomic responses, offering insight into the development and optimization of novel pain care strategies.
Methods
The study was designed as randomised placebo-controlled to explore possible mechanisms to explain the effect
of osteopathic manipulative treatment compared to sham treatment on cerebral blood flow in a sample of cLBP
patients.
Subjects. Adult patients with chronic Low Back Pain were recruited from a rehabilitation centre of the uni-
versity of Chieti (CUMFER). Inclusion criteria included any chronic (> 3 months) pain or discomfort localised
below the costal margin and above the inferior gluteal folds, with or without referred leg pain61. Exclusion crite-
ria were: clinical sign of neurological damage with sensorimotor impairments (i.e. radicular syndrome, paresis
or tingling in limbs); suspected or confirmed spinal pathology (e.g. tumour, infection, fracture or inflamma-
tory disease); history of spinal surgery (e.g. decompensation or stiffening); whiplash incidence within the last
12 months; cervical pain that reduces active movement to less than 30° rotation to each side; known vestibular
pathologies; major surgery scheduled during treatment; physiotherapy during the last 12 weeks; inability to fol-
low the procedures of the study: e.g. due to language problems, psychological/psychiatric disorders, dementia of
the participant; parallel participation in another study. At enrolment, eligible patients were assessed by a senior
MD to confirm the diagnosis and exclude psychiatric disease and/or any other exclusion criteria.
Eligible patients were randomly divided into two groups using a 1:1 ratio and assigned to the study (OMT)
group or the sham group. Block randomization was applied according to a computer-generated randomization list
using a block size of 10. All patients were not aware of any step of the study design as well as outcomes or group
Scientific Reports | (2021) 11:4556 | https://doi.org/10.1038/s41598-021-83893-8 9
Vol.:(0123456789)www.nature.com/scientificreports/
allocation. The randomization list was stored in a dedicated and protected web-based space and an information
technology consultant was in charge for the entire process.
Research staff were unaware of the study design and outcomes. Moreover, they were blinded to patients’
allocation, since all patients were touched by the practitioner. Only the osteopath was aware of the patients’
allocation. Moreover, the practitioner who performed OMT had no role in patient care decisions. Researcher
using the MRI and dealing with MRI data were unaware of patients’ allocation.
Ethics and reporting. The study was approved by the local ethics committee (University of Chieti-Pescara
number: 7/09-04-15) and all subjects provided informed written consent, in line with the Declaration of Hel-
sinki. The current protocol was registered on clinicaltrial.gov (ID: NCT02464475) on 08/06/2015. All methods
were carried out in accordance with relevant guidelines (CONSORT, TIDIER and SPIRIT) and regulations.
Prescan assessment. Before the MRI session, patients were asked to complete paper-based question-
naires. A socio-demographic questionnaire was used to collect baseline data.
The Edinburgh Handedness Inventory was utilized to investigate the hand d ominance62. The State-Trait
Anxiety Inventory (STAI-Y1 and Y2) was used to test trait anxiety63.
Furthermore, the TEMPS-A (Temperament Evaluation of the Memphis, Pisa, Paris and San Diego—Auto-
questionnaire) was administered to measure the affective temperament that defines the bipolar spectrum, with
depressive (D), cyclothymic (C), hyperthymic (H), irritable (I), and anxious (A) s ubscales64–66.
Several tools were specifically used to assess pain perception in patients: Visual Analogue Scale (VAS), the
Roland–Morris Disability Questionnaire and the Oswestry Low Back Disability Questionnaire (OSW) for the
ain67,68. Questionnaires were administered at enrolment, at each session and
physical disability due to low back p
at the end of the study period.
Experimental procedure. Patients eligible for the study were divided and randomised in an OMT and
Sham group. Patients allocated to the OMT group received 4 osteopathic sessions (approximately 30 min each).
Osteopathy is a drug-free manual medicine, where osteopathic practitioners use manual techniques to diagnose
and treat somatic (body framework) dysfunction (ICD-10 code: M99.0–99.9)69. Osteopathy is based on the struc-
tural assessment to diagnose somatic dysfunctions and a series of manipulative techniques for the t reatment70.
In the present research the treatment was administered by a licensed and registered osteopath. Among the
series of techniques, the techniques used in the current study were balanced-ligamentous, balanced-membranous
and fluidic techniques, in line with the principles and procedures available in the current osteopathic literature.
All treatment sessions took place in the CUMFER.
The sham group received an osteopathic-like manual assessment and treatment, that means the practitioner
applies a manual contact without using any type of specific osteopathic technique or procedure. After the evalu-
ation, the operator asked the patient to lay down on the plinth and gently placed the hands on a pre-defined set
of bodily parts without applying any type of technique but just using a gentle static or dynamic touch. The parts
identified in the protocol were: low back, sacrum, pelvis, diaphragm, upper thorax, cervical spine and cranium.
The sequence to apply during the session was decided by the operator before the session. This was planned to
prevent any possible chance from the patient to guess the group allocation. The sessions lasted 30 min, as for
the OMT, took place in the same location/room and were administered by the same practitioner. Besides, the
operator was instructed to maintain and establish the same type of patient-doctor relationship. This procedure
was used to avoid any possible contamination and to prevent allocation bias. Patients assigned to the sham group
received osteopathic treatment following completion of the trial.
During the study period, all patients were asked to avoid drug consumption.
As for a previous BOLD study20, the 3 time points were established (Supplementary material—Figure S1):
1. Baseline (T0): before the treatment
2. Immediate response (T1): Immediately after the first manual session
3. Sustained response (T2): at the end of the study period (after a month), which included 4 treatment sessions
After the clinical evaluation (enrolment) and at T2, patients were asked to fill in the paper-based
questionnaires.
Arterial spin labeling data acquisition. MRI was performed using a Philips Achieva 3 T scanner (Philips
Medical Systems, Best, Netherlands). A whole-body radiofrequency coil for signal excitation and an 8-channel
phased-array head coil for signal reception were used. A high-resolution structural volume was acquired using
a 3D fast field echo T1-weighted sequence (sagittal, matrix 256 × 256, FOV = 256 mm, slice thickness = 1 mm,
no gap, in-plane voxel size = 1 × 1 mm, flip angle = 12°, TR = 9.7 ms and TE = 4 ms). Then, Blood Oxygen Level
Dependent (BOLD) fMRI data were acquired. Perfusion imaging was performed using a pseudo-continuous
ASL (pCASL) sequence71 with the labeling parameters optimized according to a recent white paper72: postlabel
delay 1900 ms, label duration 1750 ms. Background suppression pulses were used at 2110 ms and 3260 ms after
start of labeling. Other imaging parameters were TR/TE = 4269/10 ms, SENSE factor 2.3, matrix 64 × 64, voxel
size 3.6 mm × 3.6 mm × 5 mm, 19 slices acquired in ascending order, 60 dynamics. The labelling plane was posi-
tioned 85 mm below the AC-PC line72. An equilibrium magnetization image (M0) with a long TR (10,000 ms)
was also acquired for calibration purposes using readout parameters identical to the pCASL sequence. The total
duration of the pCASL measurement was about 5 min.
Scientific Reports | (2021) 11:4556 | https://doi.org/10.1038/s41598-021-83893-8 10
Vol:.(1234567890)www.nature.com/scientificreports/
The MRI session also included the acquisition of BOLD data, part of which were recently published20. Impor-
tantly, we carefully controlled potential confounding factors requiring the subjects to refrain from caffeine, nico-
tine or alcohol consumption for at least 6 h before the MRI exam. In addition, the period within the day where
the acquisition was performed, and the time spent in the scanner before the ASL measurement was the same for
each subject and session to exclude effects due to circadian cycle, fatigue and menstrual cycle.
During all MRI measurements, respiratory and cardiac physiological activity was recorded using the built-in
scanner devices. Specifically, respiratory cycle was recorded with a pneumatic belt strapped around the upper
abdomen, whereas the cardiac cycle was registered with a pulse oximeter placed on a finger of the right hand.
Both signals were acquired during the pCASL sequence and sampled at 100 Hz, allowing a reliable assessment
of HRV73.
In addition, subjects were instructed to stay awake with their eyes closed and minds clear. Maximum care
was taken to avoid situations that may trigger abnormal pain. Subjects laid in a supine position on the scanner
table with head immobilized by foam padding.
ASL data preprocessing. Analysis of pCASL data was carried out using AFNI. Preprocessing was per-
formed on the tag and control ASL images separately74. First, motion correction was performed to realign all
tag/control time frames to a reference image represented by the first tag/control volume. Second, an additional
coregistration matrix between these two reference images was determined to account for possible head motion
between the two acquisitions, using a mutual information-based a pproach75. These preprocessed control/tag
timeseries were coregistered to the M0 image that was also used to determine a coregistration matrix between
perfusion images and the structural scan. To take into account intrasubject alignment across the three sessions,
the structural scan at T0 was used as the reference image for all coregistrations. Finally, individual subject data
were normalized to the MNI space using linear and nonlinear transformations (AFNI script “@SSwarper”).
Voxel-wise quantitative CBF maps were derived using a single compartment m odel72,76:
PLD
6000 (SIC − SIT )e T1A
CBF =
(ml/100 g/min)
− τ
2ααINV T1A M0 1 − e T1A
Here, SIC and SIT are the time averaged signals of control and tag images respectively, PLD is the post label
delay (1900–2800 ms, depending on the slice), T1A is the longitudinal relaxation time of arterial blood (1650 ms
at 3 T), α = 0.85 is the labeling efficiency72, αinv = 0.83 is a correction factor for the background suppression77,
M0 is the equilibrium magnetization signal, τ is the label duration (1750 ms) and λ is the blood–brain partition
coefficient (0.9 ml/g).
The calculated CBF maps were then normalized to the MNI space using the previously determined spatial
transformations.
The following contrasts between voxel-wise CBF maps were considered: (a) (T1_OMT–T0_OMT) vs (T1_
SHAM–T0_SHAM) describing the post first treatment vs. baseline, (b) (T2_OMT–T0_OMT) vs (T2_SHAM–T0_
SHAM) showing the end of study period vs. baseline, (c) (T2_OMT–T1_OMT) vs (T2_SHAM–T1_SHAM)
defining the end of study period vs. post first treatment. These contrasts represent treatment’s effects controlled
by baseline, i.e. T0, scans, and delayed effect, respectively. The additional contrast T0_OMT vs T0_SHAM was
performed to control for potential differences between groups at baseline. The group statistical maps obtained
from these contrasts were thresholded at p < 0.01 corrected for multiple comparisons using False Discovery
Rate (FDR).
HRV data. Standard 5 min recording (corresponding to the pCASL acquisition) was used to derive HRV
data. Inter-beat intervals were extracted from the pulse oximeter. Using customized software (Kubios automatic
artefact correction algorithm function based on nonlinear predictive interpolation), outliers, i.e. artefacts and
ectopic peaks, were identified and removed from the data. Specifically, to account for non-experimental move-
ments that might produce extreme values, individual participant’s datapoints that were more than three S.D.s
above or below the whole sample mean were identified. Such datapoints were determined to be additional arte-
facts and replaced by the mean of that participant’s non-artifactual epochs. The artifact percentage accepted for
each individual was set at 2%. Two participants (1 in the OMT group and 1 in the SHAM group) were identified
as having artifactual epochs, corresponding to 6.25% of period datapoints across participants. Intervals were
then imported in Kubios software (http://kubios.uef.fi) to compute HRV parameters. Standard 5-min record-
ings were considered for RR series. There were no significant differences in the percentage of artifactual epochs
identified between the two groups.
HRV analysis method, based on processing recorded RR intervals, was divided into linear analysis (time and
frequency domain) and nonlinear analysis78. The correction method was automatic as mentioned above, with
an acceptance threshold of 2%. The signal type was PPG. Regarding the QRS detection options, R-wave polarity
and prior guess for RR interval were set as automatic. The RR time series interpolation rate was set at 4 Hz and
the detrending method was the Smoothness priors, choosing a smoothing parameter equal to 500. The general
analysis settings included: (1) Standard analysis (all time-domain, frequency-domain and nonlinear analysis for
selected stationary samples), and (2) Time-varying analysis. For time-domain analysis methods, the window
width of the moving average filter was set at 5 beats. Also, the threshold used in the computation of NNxx and
pNNxx parameters was set at 50 ms, thus NN50 and pNN50). From power spectra (Fast Fourier transformation
-FFT- using Blackman Harris window) of equidistant linear interpolated (4 Hz) tachograms (resampled to 2 Hz),
the following frequency domain standard HRV indices were used for linear analysis: nuHF, from 0.15 to 0.4 Hz,
Scientific Reports | (2021) 11:4556 | https://doi.org/10.1038/s41598-021-83893-8 11
Vol.:(0123456789)www.nature.com/scientificreports/
i.e. signal of parasympathetic heart rate m odulation79,80; nuLF, from 0.04 to 0.15 Hz, i.e. predictor of sympathetic
modulation81; LF/HF ratio as being demonstrated a valid marker of ANS activity82. In addition, the spectrum
estimation option was 300 points/Hz, the FFT spectrum using Welch’s periodogram method has a window width
of 300 s and a window overlap of 50%. The AR spectrum used an AR model order of 16. The nonlinear analysis
options included embedding dimension at 2 beats with a tolerance of 0.2 times SD. The detrended fluctuation
analysis used a short-term parameter ranging between 4 and 12 beats and long-term fluctuations between 13
and 64 beats. Considering non-linear analysis, the DFAα1 parameter was computed. DFAα1 is considered a
sensitive parasympathetic index83 able to discriminate possible long-term correlations and complexity of RR
interval series84. A fractal structure of heart rate was quantified by estimating a short-term, alpha 1, fluctuations,
obtained from the range 4 ≤ n ≤ 16. The time-varying analysis settings were: HRV analysis window width equal
to 300 s with an effective data threshold at 50%. For the time-varying spectrum estimation, the well-known
spectrogram was chosen.
Statistical analysis. Sample size calculation. Due to lack of perfusion studies assessing the effects of
manual therapies on cLBP, the computation of a priori sample size was difficult. For this reason, we computed a
posteriori the effect size (Cohen’s d) for each ROI by using the baseline-T2 difference data in contrast between
OMT and sham group. In addition, β values were calculated using pwr.t.test function {pwr} in R considering
Cohen’s d, alfa = 0.05 and number of subjects equal to 16.
Arithmetic mean and standard deviation as well as median, percentage and range were used to explore the
general characteristics of the study population. To compare the OMT and sham group at enrolment, univariate
statistical tests, student t test and chi square test were performed.
HRV analysis. HRV analysis was performed in the present trial using the restricted weak stationarity (RWS)
test to assess s tationarity85, over M patterns. Shapiro test was applied to test the normality of R-R distribution
(p < 0.05). In case of non-normal distribution, a log transformation was applied. Then, M patterns were assessed
for normality. The patterns were randomly selected from a set of sequences of length L85. These patterns were
then used for the final analysis.
Perfusion data. To study the independent effect of osteopathic manipulative treatment on perfusion data, HRV
endpoints and pain data, a 2 × 3 repeated measure analysis based on MER model considering random effect for
groups (OMT-SHAM) and a fixed effect for period (T0–T1–T2) was used to further explore any difference. The
following confounding factors were considered in the analysis: age, gender, caffeine consumption, circadian
and menstrual cycle. Post hoc pairwise analysis adjusted by Holm–Bonferroni correction was utilised after any
statistical difference resulted from MER.
To indicate statistical difference, two-tailed P values of less than 0.05 was considered. This data analysis was
carried out using the R statistical program (v. 3.5.2).
Correlation analysis between regional CBF values, VAS scores and HRV parameters. To determine whether CBF
in the pain-related regions was correlated with pain intensity, Pearson correlation analyses between regional CBF
values and VAS scores at the different timepoints were performed. Further Pearson-based correlation analyses
were conducted exploring correlation between rCBF and HRV parameters as well as between HRV and pain.
Bonferroni correction for multiple comparison was used. In order to avoid circularity problems in the
analysis86, ROIs were defined as spherical nodes (6 mm of radius) using independent coordinates from the
literature32,45 (Supplementary materials—Table S2).
These ROIs showed a good spatial overlap with the pain-related regions revealed by the voxel-wise contrasts
in the above analysis.
Received: 2 June 2020; Accepted: 9 February 2021
References
1. Cicchitti, L., Martelli, M. & Cerritelli, F. Chronic inflammatory disease and osteopathy: A systematic review. PLoS ONE 10,
e0121327 (2015).
2. Licciardone, J. C. Osteopathic manipulative treatment in patients with low back pain. Clin. Rheumatol. 30, 871–872 (2011) (author
reply 873).
3. Licciardone, J. C., Gatchel, R. J. & Aryal, S. Recovery from chronic low back pain after osteopathic manipulative treatment: A
randomized controlled trial. J. Am. Osteopath. Assoc. 116, 144–155 (2016).
4. Verhaeghe, N., Schepers, J., van Dun, P. & Annemans, L. Osteopathic care for low back pain and neck pain: A cost-utility analysis.
Complement Ther. Med. 40, 207–213 (2018).
5. Licciardone, J. C. & Aryal, S. Clinical response and relapse in patients with chronic low back pain following osteopathic manual
treatment: Results from the OSTEOPATHIC Trial. Man. Ther. 19, 541–548 (2014).
6. Licciardone, J. C., Kearns, C. M. & Minotti, D. E. Outcomes of osteopathic manual treatment for chronic low back pain according
to baseline pain severity: Results from the OSTEOPATHIC Trial. Man. Ther. 18, 533–540 (2013).
7. Licciardone, J. C., Minotti, D. E., Gatchel, R. J., Kearns, C. M. & Singh, K. P. Osteopathic manual treatment and ultrasound therapy
for chronic low back pain: A randomized controlled trial. Ann. Fam. Med. 11, 122–129 (2013).
8. Franke, H., Franke, J. D. & Fryer, G. Osteopathic manipulative treatment for nonspecific low back pain: A systematic review and
meta-analysis. BMC Musculoskelet. Disord. 15, 286 (2014).
9. Task Force on the Low Back Pain Clinical Practice Group. American osteopathic association guidelines for osteopathic manipula-
tive treatment (OMT) for patients with low back pain. J. Am. Osteopath. Assoc. 116, 536–549 (2016).
Scientific Reports | (2021) 11:4556 | https://doi.org/10.1038/s41598-021-83893-8 12
Vol:.(1234567890)www.nature.com/scientificreports/
10. Henley, C. E., Ivins, D., Mills, M., Wen, F. K. & Benjamin, B. A. Osteopathic manipulative treatment and its relationship to auto-
nomic nervous system activity as demonstrated by heart rate variability: A repeated measures study. Osteopath. Med. Prim. Care
2, 7 (2008).
11. Giles, P. D., Hensel, K. L., Pacchia, C. F. & Smith, M. L. Suboccipital decompression enhances heart rate variability indices of cardiac
control in healthy subjects. J. Altern. Complement Med. 19, 92–96 (2013).
12. Ruffini, N. et al. Variations of high frequency parameter of heart rate variability following osteopathic manipulative treatment in
healthy subjects compared to control group and sham therapy: Randomized controlled trial. Front. Neurosci. 9, 272 (2015).
13. D’Alessandro, G., Cerritelli, F. & Cortelli, P. Sensitization and interoception as key neurological concepts in osteopathy and other
manual medicines. Front. Neurosci. 10, 100 (2016).
14. Meltzer, K. R. & Standley, P. R. Modeled repetitive motion strain and indirect osteopathic manipulative techniques in regulation
of human fibroblast proliferation and interleukin secretion. J. Am. Osteopath. Assoc. 107, 527–536 (2007).
15. Licciardone, J. C., Kearns, C. M., Hodge, L. M. & Bergamini, M. V. Associations of cytokine concentrations with key osteopathic
lesions and clinical outcomes in patients with nonspecific chronic low back pain: Results from the OSTEOPATHIC Trial. J. Am.
Osteopath. Assoc. 112, 596–605 (2012).
16. Degenhardt, B. F., Johnson, J. C., Fossum, C., Andicochea, C. T. & Stuart, M. K. Changes in cytokines, sensory tests, and self-
reported pain levels after manual treatment of low back pain. Clin. Spine Surg. 30, E690–E701 (2017).
17. Degenhardt, B. F. et al. Preliminary findings on the use of osteopathic manipulative treatment: Outcomes during the formation of
the practice-based research network, DO-Touch.NET. J. Am. Osteopath. Assoc. 114, 154–170 (2014).
18. McGlone, F., Cerritelli, F., Walker, S. & Esteves, J. The role of gentle touch in perinatal osteopathic manual therapy. Neurosci.
Biobehav. Rev. 72, 1–9 (2017).
19. Cerritelli, F., Cardone, D., Pirino, A., Merla, A. & Scoppa, F. Does osteopathic manipulative treatment induce autonomic changes
in healthy participants? A thermal imaging study. Front. Neurosci. 14, 887 (2020).
20. Cerritelli, F. et al. Effect of manual approaches with osteopathic modality on brain correlates of interoception: An fMRI study. Sci.
Rep. 10, 3214 (2020).
21. Tamburella, F. et al. Cerebral perfusion changes after osteopathic manipulative treatment: A randomized manual placebo-controlled
trial. Front. Physiol. 10, 403 (2019).
22. Chiacchiaretta, P., Romani, G. L. & Ferretti, A. Sensitivity of BOLD response to increasing visual contrast: Spin echo versus gradi-
ent echo EPI. Neuroimage 82, 35–43 (2013).
23. Ferretti, A. et al. Cortical brain responses during passive nonpainful median nerve stimulation at low frequencies (0.5–4 Hz): An
fMRI study. Hum. Brain Mapp. 28, 645–653 (2007).
24. Perrotta, A. et al. Temporal summation of the nociceptive withdrawal reflex involves deactivation of posterior cingulate cortex.
Eur. J. Pain 21, 289–301 (2017).
25. Zou, Q., Wu, C. W., Stein, E. A., Zang, Y. & Yang, Y. Static and dynamic characteristics of cerebral blood flow during the resting
state. Neuroimage 48, 515–524 (2009).
26. Gevers, S. et al. Intra- and multicenter reproducibility of pulsed, continuous and pseudo-continuous arterial spin labeling methods
for measuring cerebral perfusion. J. Cereb. Blood Flow Metab. 31, 1706–1715 (2011).
27. Chiacchiaretta, P., Cerritelli, F., Bubbico, G., Perrucci, M. G. & Ferretti, A. Reduced dynamic coupling between spontaneous
BOLD-CBF fluctuations in older adults: A dual-echo pCASL study. Front. Aging Neurosci. 10, 115 (2018).
28. Peyron, R., Laurent, B. & Garcia-Larrea, L. Functional imaging of brain responses to pain. A review and meta-analysis. Neuro-
physiol. Clin. 30, 263–288 (2000).
29. Owen, D. G., Bureau, Y., Thomas, A. W., Prato, F. S. & St Lawrence, K. S. Quantification of pain-induced changes in cerebral blood
flow by perfusion MRI. Pain 136, 85–96 (2008).
30. Tracey, I. & Johns, E. The pain matrix: Reloaded or reborn as we image tonic pain using arterial spin labelling. Pain 148, 359–360
(2010).
31. Owen, D. G., Clarke, C. F., Ganapathy, S., Prato, F. S. & St Lawrence, K. S. Using perfusion MRI to measure the dynamic changes
in neural activation associated with tonic muscular pain. Pain 148, 375–386 (2010).
32. Tanasescu, R., Cottam, W. J., Condon, L., Tench, C. R. & Auer, D. P. Functional reorganisation in chronic pain and neural correlates
of pain sensitisation: A coordinate based meta-analysis of 266 cutaneous pain fMRI studies. Neurosci. Biobehav. Rev. 68, 120–133
(2016).
33. Beissner, F., Meissner, K., Bar, K. J. & Napadow, V. The autonomic brain: An activation likelihood estimation meta-analysis for
central processing of autonomic function. J. Neurosci. 33, 10503–10511 (2013).
34. Shi, X. et al. Effect of cranial osteopathic manipulative medicine on cerebral tissue oxygenation. J. Am. Osteopath. Assoc. 111,
660–666 (2011).
35. Wasan, A. D. et al. Neural correlates of chronic low back pain measured by arterial spin labeling. Anesthesiology 115, 364–374
(2011).
36. Tramontano, M. et al. Brain connectivity changes after osteopathic manipulative treatment: A randomized manual placebo-
controlled trial. Brain Sci. 10, 969 (2020).
37. Liu, J. et al. Quantitative cerebral blood flow mapping and functional connectivity of postherpetic neuralgia pain: A perfusion
fMRI study. Pain 154, 110–118 (2013).
38. Singer, T. et al. Empathy for pain involves the affective but not sensory components of pain. Science 303, 1157–1162 (2004).
39. Apkarian, A. V., Bushnell, M. C., Treede, R. D. & Zubieta, J. K. Human brain mechanisms of pain perception and regulation in
health and disease. Eur. J. Pain 9, 463–484 (2005).
40. Davis, K. D., Kwan, C. L., Crawley, A. P. & Mikulis, D. J. Functional MRI study of thalamic and cortical activations evoked by
cutaneous heat, cold, and tactile stimuli. J. Neurophysiol. 80, 1533–1546 (1998).
41. Derbyshire, S. W. et al. Pain processing during three levels of noxious stimulation produces differential patterns of central activity.
Pain 73, 431–445 (1997).
42. Mayer, E. A. et al. Differences in brain responses to visceral pain between patients with irritable bowel syndrome and ulcerative
colitis. Pain 115, 398–409 (2005).
43. Gracely, R. H. et al. Pain catastrophizing and neural responses to pain among persons with fibromyalgia. Brain 127, 835–843
(2004).
44. Baliki, M. N., Geha, P. Y., Apkarian, A. V. & Chialvo, D. R. Beyond feeling: Chronic pain hurts the brain, disrupting the default-
mode network dynamics. J. Neurosci. 28, 1398–1403 (2008).
45. Valenza, G. et al. The central autonomic network at rest: Uncovering functional MRI correlates of time-varying autonomic outflow.
NeuroImage 197, 383–390 (2019).
46. Chouchou, F. et al. How the insula speaks to the heart: Cardiac responses to insular stimulation in humans. Hum. Brain Mapp. 40,
2611–2622 (2019).
47. Thayer, J. F., Ahs, F., Fredrikson, M., Sollers, J. J. & Wager, T. D. A meta-analysis of heart rate variability and neuroimaging studies:
Implications for heart rate variability as a marker of stress and health. Neurosci. Biobehav. Rev. 36, 747–756 (2012).
48. Smith, R., Thayer, J. F., Khalsa, S. S. & Lane, R. D. The hierarchical basis of neurovisceral integration. Neurosci. Biobehav. Rev. 75,
274–296 (2017).
Scientific Reports | (2021) 11:4556 | https://doi.org/10.1038/s41598-021-83893-8 13
Vol.:(0123456789)You can also read