Technician-Scored Stool Consistency Spans the Full Range of the Bristol Scale in a Healthy US Population and Differs by Diet and Chronic Stress Load
←
→
Page content transcription
If your browser does not render page correctly, please read the page content below
The Journal of Nutrition
                                                       Nutrient Physiology, Metabolism, and Nutrient-Nutrient Interactions

Technician-Scored Stool Consistency Spans
the Full Range of the Bristol Scale in a Healthy
US Population and Differs by Diet and Chronic
Stress Load
Danielle G Lemay,1,2 Lacey M Baldiviez,2 Elizabeth L Chin,1 Sarah S Spearman,1 Eduardo Cervantes,2
Leslie R Woodhouse,1 Nancy L Keim,1,2 Charles B Stephensen,1,2 and Kevin D Laugero1,2

                                                                                                                                                                 Downloaded from https://academic.oup.com/jn/article/151/6/1443/6168046 by guest on 06 November 2021
1
 USDA Agricultural Research Service Western Human Nutrition Research Center, Davis, CA, USA; and 2 Department of Nutrition,
University of California, Davis, Davis, CA, USA

ABSTRACT
Background: Prior studies of adults with constipation or diarrhea suggest that dietary intake, physical activity, and
stress may affect stool consistency. However, the influence of these factors is unresolved and has not been investigated
in healthy adults.
Objectives: We assessed the relations of technician-scored stool consistency in healthy adults with self-reported diet,
objectively monitored physical activity, and quantifiable markers of stress.
Methods: Stool consistency was scored by an independent technician using the Bristol Stool Form Scale (BSFS) to
analyze samples provided by healthy adults, aged 18–65 y, BMI 18–44 kg/m2 , in the USDA Nutritional Phenotyping Study
(n = 364). A subset of participants (n = 109) were also asked to rate their sample using the BSFS. Dietary intake was
assessed with two to three 24-h recalls completed at home and energy expenditure from physical activity was monitored
using an accelerometer in the 7-d period preceding the stool collection. Stress was measured using the Wheaton Chronic
Stress Inventory and allostatic load (AL). Statistical and machine learning analyses were conducted to determine which
dietary, physiological, lifestyle, and stress factors differed by stool form.
Results: Technician-scored BSFS scores were significantly further (P = 0.003) from the central score (mean ± SEM
distance: 1.41 ± 0.089) than the self-reported score (1.06 ± 0.086). Hard stool was associated with higher (P = 0.005)
intake of saturated fat (13.8 ± 0.40 g/1000 kcal) than was normal stool (12.5 ± 0.30 g/1000 kcal). AL scores were lower
for normal stool (2.49 ± 0.15) than for hard (3.07 ± 0.18) (P = 0.009) or soft stool (2.89 ± 0.18) (P = 0.049). Machine
learning analyses revealed that various dietary components, physiological characteristics, and stress hormones predicted
stool consistency.
Conclusions: Technician-scored stool consistency differed by dietary intake and stress hormones, but not by physical
activity, in healthy adults. This trial was registered at clincialtrials.gov as NCT02367287. J Nutr 2021;151:1443–1452.

Keywords: stool form, gastrointestinal, food, nutrition, stress, constipation, diarrhea, feces, digestive system,
machine learning

Introduction                                                                     adults have been based on self-reported observation (4–18).
                                                                                 Independent technician scoring of stool consistency has not yet
Stool consistency is a clinically relevant measure of bowel
                                                                                 been conducted in healthy adults, to our knowledge.
function. Stool consistency is commonly rated using the
                                                                                    Our understanding of how diet and other factors influence
7-point Bristol Stool Form Scale (BSFS) with types 1 and 2
                                                                                 stool consistency in healthy adults is also limited. Studies
designated as hard/constipation, types 3, 4, and 5 as normal
                                                                                 of constipated adults have shown associations with certain
stool, and types 6 and 7 as soft/diarrhea (1, 2). The BSFS has
                                                                                 food groups and intakes of liquid (19), caffeine (20–23),
not always been uniformly applied because the first and largest
                                                                                 and dietary fiber (19, 21–24). Interventions with constipated
study omitted type 7 under the assumption that healthy people
                                                                                 participants showed a beneficial effect of dietary fiber (11, 25–
do not produce such stool (3). The 2009–2010 NHANES used
                                                                                 27), probiotics (28, 29), and prebiotic-probiotic “synbiotics”
the full 7-point scale; however, the usual stool consistency was
                                                                                 (30, 31). Likewise, some dietary interventions for irritable bowel
self-reported (2). To date, stool consistency patterns in healthy
                                                                                 syndrome (IBS) demonstrated symptom improvement (32–43).

Published by Oxford University Press on behalf of the American Society for Nutrition 2021. This work is written by (a) US Government employee(s) and is in the
public domain in the US.
Manuscript received September 28, 2020. Initial review completed November 19, 2020. Revision accepted January 19, 2021.
First published online March 10, 2021; doi: https://doi.org/10.1093/jn/nxab019.                                                                         1443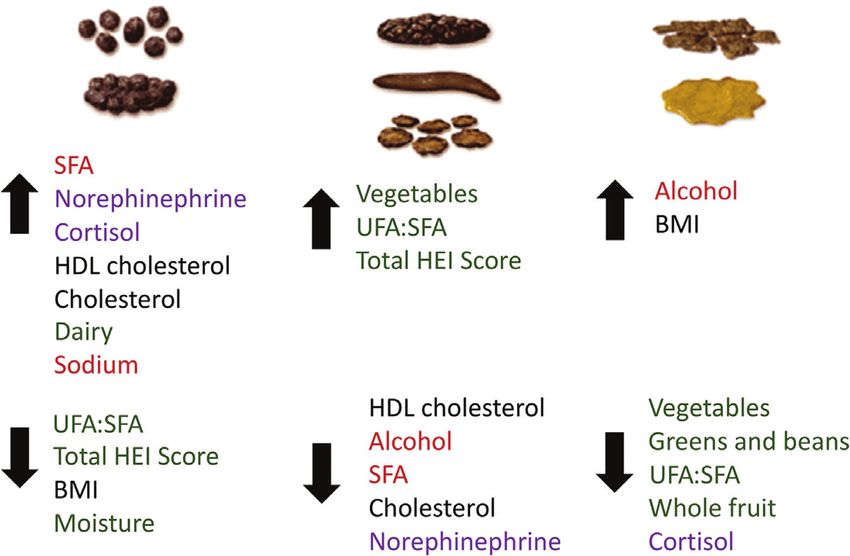
Physical activity was shown to influence constipation (21, 22,                     of 1–2 were considered hard; scores of 3–5 as normal, with “4” being
44–46) and IBS (47, 48). Together, these studies imply that diet                   the ideal; and scores of 6–7 as soft.
and physical activity may influence stool consistency; however,
this has not been observed in a healthy population.                                Dietary assessment
    Stress has long been linked to gastrointestinal system                         Recent dietary intake was assessed using the Automated Self-
upset (49), which is thought to result from stress-related                         Administered 24-hour (ASA24® ) Dietary Assessment Tool, versions
alterations in several neurobiological systems, including the                      2014 and 2016 (57). Participants received email prompts to complete
hypothalamic–pituitary–adrenal (HPA) axis and the autonomic                        dietary recalls on 2 weekdays and 1 weekend during the interim of
                                                                                   the 2 study visits (between 10 and 14 d). Recall periods were from
nervous system (ANS) (50). However, the effects of stress
                                                                                   midnight to midnight before receipt of the email prompt. Subjects
on diet may also explain associations between stress and                           completed 1 training recall with a study staff member and, subsequently,
disturbances of the gastrointestinal system. Numerous studies                      3 were completed at home in response to the receipt of the separate
have also demonstrated associations of chronic stress with                         unscheduled prompts. Average intake of dietary components was
clinical outcomes in IBS (48, 51–55). However, the role of                         calculated using the average across all at-home 24-h recalls that passed
stress on stool consistency in healthy adults is not currently                     quality control. Nutrient densities were calculated per 1000 kcal.
known.                                                                             Diet quality was estimated using the HEI. HEI scores were based
    Given the need for an unbiased assessment of stool                             on individuals with 2 or 3 at-home dietary recalls. Of the 358 who

                                                                                                                                                               Downloaded from https://academic.oup.com/jn/article/151/6/1443/6168046 by guest on 06 November 2021
consistency and a better understanding of the factors that                         completed the study, there were 350 participants with ≥2 diet recalls.
affect stool consistency in healthy adults, the aims of this                       The total HEI is derived by summing subscores across 13 categories of
                                                                                   food groups which include Total Vegetables; Greens and Beans; Total
study were to 1) examine the range of stool consistency scores
                                                                                   Fruits; Whole Fruits; Whole Grains; Total Dairy; Total Protein Foods;
observed by technicians and compare this with self-reports, and                    Seafood and Plant Proteins; Fatty Acids; Sodium; Refined Grains;
2) determine whether dietary factors, physical activity, and/or                    Saturated Fat; and Added Sugar. The subscores range from 0 to 5
chronic stress differ by technician-scored stool consistency. We                   (Total Vegetables, Greens and Beans, Total Fruits, Whole Fruits, Total
hypothesized that normal stool consistency would associate                         Protein Foods, Seafood and Plant Proteins) and from 0 to 10 (Whole
with 1) lower intake of fat and higher intake of dietary fiber,                    Grains, Dairy, Fatty Acids, Sodium, Refined Grains, Saturated Fat,
fruit, vegetables, whole grains, nuts/seeds, and fluid; 2) higher                  Added Sugar), where a higher score indicates greater adherence to that
Healthy Eating Index (HEI) scores; 3) greater physical activity;                   particular category of the 2015–2020 Dietary Guidelines for Americans
and 4) lower chronic stress exposure and physiological stress                      (DGA) (58). The total HEI is an indicator of how well an individual’s
load.                                                                              total diet aligns with the DGA on a 0–100 scale, where a higher score
                                                                                   indicates a diet more closely aligned to the DGA.

                                                                                   Assessment of physical activity
Methods                                                                            Energy expenditure from physical activity was monitored for a period
                                                                                   of ∼7 d between 2 study visits using a Respironics® Actical™
Participants                                                                       accelerometer. The average times spent performing physical activity
Healthy adults, aged 18–65 y, male or female, with BMI 18–44 kg/m2                 at sedentary, light, moderate, and vigorous intensities were calculated
living near Davis, CA were recruited in the USDA Nutritional                       based on all days for which a minimum of 12 h of activity were recorded.
Phenotyping Study (NCT02367287) (56). Participants who provided
a stool sample within 48 h (n = 361) were included in the current study.
The study received ethical approval from the University of California,             Wheaton Chronic Stress Inventory
Davis Institutional Review Board.                                                  A 51-item Wheaton Chronic Stress Inventory was used to investigate
                                                                                   chronic stress exposure. This self-reported instrument examines the
                                                                                   presence of chronic stressors related to financial difficulties, work,
Stool sampling and Bristol stool scoring                                           and relationships, and ratings of impact (59). Scores for each of the
Participants were instructed to collect a single stool sample in a                 statements on the questionnaire were rated using a 3-point scale (0 = not
Ziploc bag that was enclosed in a hard plastic container with a lid                at all true, 1 = true, and 2 = extremely true). The scores for each
and immediately placed in a cooler containing ice packs. The cooler                item were summed to obtain a total chronic stress exposure score, with
was brought to the research center as soon as possible for same-day                possible scores ranging from 0 to 102. The questionnaire was filled out
processing. A technician identified BSFS scores by visual classification           during the test visit in a private room at the Western Human Nutrition
of the whole specimen at 4◦ C using the 7-point BSFS (1). A subset of              Research Center. Examples of the questions include: “You are trying to
participants (n = 109) were in addition asked to self-report their BSFS            take on too many things at once,” “Someone in your family or a close
by circling the type on the visual scale at the time of collection. Scores         friend has a long-term illness or handicap,” “You are alone too much,”
                                                                                   and “Your rent or mortgage is too high.”

 Supported by USDA Agricultural Research Service grants 2032-51530-026-00D
and 2032-51530-022-00-D. The USDA is an equal opportunity provider and
                                                                                   Allostatic load score
employer.                                                                          Allostatic load (AL) score was calculated using the methods outlined
Author disclosures: The authors report no conflicts of interest.                   in our previous study (60). AL was derived from 12-h overnight
CBS is a member of The Journal of Nutrition’s Editorial Board.                     urinary cortisol, norepinephrine, and epinephrine concentrations (cor-
Supplemental Methods and Supplemental Figures 1–12 are available from the          rected for urinary creatinine concentrations); resting systolic and
“Supplementary data” link in the online posting of the article and from the same   diastolic blood pressure; overnight fasted waist-to-hip ratio; fasting
link in the online table of contents at https://academic.oup.com/jn/.              serum concentrations of high-sensitivity C-reactive protein (hsCRP),
Address correspondence to DGL (e-mail: danielle.lemay@usda.gov).                   cholesterol, and HDL cholesterol; fasting plasma concentrations of
Abbreviations used: AL, allostatic load; ANS, autonomic nervous system; BSFS,
                                                                                   dehydroepiandrosterone sulfate (DHEA-S); and whole-blood glycated
Bristol Stool Form Scale; DGA, Dietary Guidelines for Americans; DHEA-S,
                                                                                   hemoglobin (HbA1c). Urinary cortisol was measured using a Uri-
dehydroepiandrosterone sulfate; HbA1c, glycated hemoglobin; HEI, Healthy
Eating Index; HPA, hypothalamic–pituitary–adrenal; hsCRP, high-sensitivity C-      nary Cortisol ELISA (Alpco Diagnostics). Urinary epinephrine and
reactive protein; IBS, irritable bowel syndrome; MSD, MesoScale Diagnostics;       norepinephrine were measured using the Bi-Cat Urine ELISA (Eagle
OOB, out-of-bag; SFA, saturated fat; SHAP, SHapley Additive exPlanations;          Biosciences). Urine creatinine, serum total and HDL cholesterol, and
SNS, sympathetic nervous system; UFA:SFA, ratio of monounsaturated and             whole-blood HbA1c were determined with Roche reagents on the
polyunsaturated fat to saturated fat.                                              Integra 400 Plus clinical chemistry analyzer (Roche Diagnostics). hsCRP

1444    Lemay et al.
was measured using the MesoScale Diagnostics (MSD) VIP2 (vascular Results
injury panel 2) kit with the MSD Sector Imager 2400 and SQ 120
electrochemiluminescence instruments. DHEA-S was measured using Distribution of technician-reported and self-reported
Roche reagents on the Roche e411 electrochemiluminescence clinical BSFS scores
chemistry analyzer. Each parameter except cortisol was divided into The median storage time between the collection of stool and
quartiles and values that fell within the top quartile were scored processing was 7.7 h. To determine whether processing delay
with 1 point. Cortisol was divided into octiles and values that fell was associated with stool consistency scores being further from
within the top or bottom octiles were assigned 1 point. The quartile the central score of 4, we defined a metric, “distance from
and octile cutoffs were empirically derived from the study sample. central score,” as the difference between the actual BSFS and
Increases in AL score are indicative of a higher stress load (61), and the central score of 4. The mean difference in the “distance from
these changes shift the operating range of numerous biological systems central score” between stool processing delay > 24 h and ≤24 h
(62). The AL index incorporates subclinical measures (e.g., hsCRP)
was significant (P = 0.036), whereas the difference between 12–
for a range of multiple biomarkers that interact with activity in stress
24 h and 24 h
(n = 20) were excluded from further analysis.
The distribution of technician-scored BSFS scores for stool
Statistical methods processed within 24 h (n = 343) covered the entire range
Downloaded from https://academic.oup.com/jn/article/151/6/1443/6168046 by guest on 06 November 2021
R version 3.6.0 (63) was used for statistical analyses and visualizations. of the 7-point scale (Figure 1A). Only 44.9% of participants
Data are presented as mean ± SEM. For primary analyses, stool
had normal stool scored as 3–5, whereas 31.2% had hard
consistency was treated as a trichotomous categorical variable: (hard:
1–2; normal: 3–5; and soft: 6–7). The strength and directionality of the
stool scored as 1–2 and 23.9% had soft stool scored as 6–7.
relation between stool consistency and any continuous variable were Because previous studies of stool consistency had demonstrated
tested using ANOVA, if the data could be transformed, or Kruskal– a more bell-shaped distribution and early preliminary data
Wallis tests (with Dunn’s test as a post hoc test), if there was not of the current study did not, study procedures were revised
an appropriate transformation. Possible transformations (none, log, to enable the remaining participants (n = 109) to self-score
Box-Cox) were evaluated with the Shapiro–Wilk test. For secondary their stool. The distribution of self-reported stool was indeed
analyses, stool consistency was treated as dichotomous: hard compared bell-shaped with a central score mode of 4 (Figure 1B),
with not hard (hard: 1–2; not hard: 3–7) or soft compared with not soft unlike the technician-reported stool from the same participants
(soft: 6–7; not soft: 1–5). Two-group comparisons were evaluated using (Supplemental Figure 1). The mean “distance from central
a Welch 2-sample t test if the data could be transformed, otherwise,
score” was significantly greater (P = 0.003) for technician-
Wilcoxon’s signed rank test. Relations between stool consistency
and categorical variables (e.g., ethnicity) were evaluated using the
scored stool (1.41 ± 0.089) than for self-scored stool
chi-square test. For all statistical tests, P < 0.05 was considered (1.06 ± 0.086) from the same participants (Figure 1C). In
significant. summary, technician-scored and self-scored BSFS ratings were
significantly different with self-reports biased toward normal
stool.
Machine learning analyses
Random forest models were built for 4 outcomes. The first was a
multiple-class outcome corresponding to the stool class (“class”): hard, Relations of participant characteristics and physical
normal, or soft. The individual classes were also assessed as binary activity with stool consistency
outcomes: hard/not hard, normal/not normal, and soft/not soft. All Table 1 summarizes participant characteristics. Age, sex, BMI,
4 outcomes were assessed using a set of 35 features that included and ethnicity were included as covariates in our statistical
HEI subgroup components, AL components, age, sex, BMI, ethnicity, analysis. None differed significantly by stool consistency class:
tobacco use, menstrual and hormonal contraceptive use history, and age (P = 0.88), sex (P = 0.27), BMI (P = 0.31), or ethnicity
dietary intake of caffeine, alcohol, and moisture. Participants with a
(P = 0.68).
stool sample processed within 24 h and the aforementioned features
Participants with both stool consistency data and physical
were included in the random forest analyses (n = 252). Analyses were
conducted using scikit-learn 0.23.1 with python 3.7.7 (64). Numerical activity data (n = 334) were included in analysis of the
features were mean centered and unit variance scaled. Categorical relation between stool consistency and physical activity. These
features were one-hot encoded (sex, tobacco use, ethnicity, menstruation participants spent a mean of 1110 ± 4.7 min/d sedentary.
history, and contraceptive use). The Supplemental Methods give details They spent a mean of 284 ± 4.3 min/d, 41.1 ± 2.2 min/d,
about baseline models, hyperparameter tuning, and the final selected and 3.20 ± 0.44 min/d doing light, moderate, or vigorous
hyperparameters. The random forest models were evaluated using activity, respectively. Moderate activity in minutes per day
the out-of-bag (OOB) balanced accuracy score. Random forests use was log transformed. Mean time spent sedentary was not
bootstrapping; each tree is built using a different subset of the samples significantly different among stool consistencies (P = 0.27).
and some samples are not used. The OOB score is the average score
Similarly, time spent in light, moderate, or vigorous activity
from the predictions of the samples left out from the bootstrapped
did not differ by stool consistency category (light: P = 0.77;
samples used to build each tree. The default OOB score returned
by random forest classifiers in scikit-learn is the accuracy score. We moderate: P = 0.30; vigorous: P = 0.50). In summary, there
calculated the OOB balanced accuracy score using the OOB predictions. was no difference in physical activity between stool consistency
The balanced accuracy score was used to account for class imbalances classes.
(hard, n = 78; normal, n = 117; soft, n = 57). To interpret features,
the SHapley Additive exPlanations (SHAP) package was used to
Relation of diet with stool consistency
evaluate which features positively or negatively contributed to model
The relations between stool consistency and HEI scores were
predictions (65). SHAP is based on game theory methods using Shapley
values, in which feature contributions are evaluated across all possible evaluated for participants who had both stool consistency and
combinations. SHAP was implemented using TreeExplainer and the HEI data (n = 335). When stool consistency was considered as
SHAP summary plots were used to visualize the contributions of a trichotomous variable, the main effect of the HEI score was
features to the model predictions. Scripts are available on GitHub marginal (P = 0.08). However, the HEI score was significantly
(66). different between hard and nonhard stool (P = 0.045), with
Stool consistency, diet, and stress 1445Downloaded from https://academic.oup.com/jn/article/151/6/1443/6168046 by guest on 06 November 2021
FIGURE 1 Stool consistency distribution and associated factors in healthy US adults. (A) Distribution of technician-scored BSFS scores for
samples processed within 24 h in healthy adult participants (n = 343). (B) Distribution of self-reported BSFS scores for late-enrollment participants
for whom self-reported scores were available (n = 109). (C) Difference between self-reported and technician-reported BSFS scores (n = 109).
(C–D) Significance difference in two group comparisons denoted by ∗ (P < 0.05) or ∗∗ (P < 0.01). (D–F) Relation of stool consistency category
with (D) HEI score (n = 335), (E) SFA (n = 335), and (F) AL (n = 321). (C–F) The box shows the IQR with the median at the center and the
whiskers cover ∼99% of the data. (D–F) The notch is the 95% CI of the median. (E-F) AL, allostatic load; BSFS, Bristol Stool Form Scale; HEI,
Healthy Eating Index; SFA, saturated fat. The means of groups with the same letter (a or b) are not significantly different.
lower HEI scores associated with hard stool consistency consumed by subjects with hard stools was significantly higher
(Figure 1D). than that of subjects with normal stools (P = 0.005) (Figure 1E).
We also evaluated the relation of stool consistency with Hypotheses regarding stool consistency and specific food
reported consumption of specific dietary components: total and groups—vegetables, intact fruits, legumes, nuts/seeds, and
supplemental fiber, total fat, saturated fat (SFA), and moisture. whole grains—were also tested (Table 3). Distributions of
Distributions of intake are in Supplemental Figures 2–6. Of their intake are in Supplemental Figures 7–11. There was no
these dietary components, only SFA differed significantly by statistically significant relation between stool consistency and
stool consistency class (Table 2). The mean amount of SFA any of these specific food groups.
TABLE 1 Characteristics of healthy adult participants who provided a stool sample within 24 h1
Participants, n
Sex Age, y BMI, kg/m2
F M 18–33 34–49 50–65 18.5–24.99 25–29.99 30–44 Participants, n %Total
Sex
F 179 0 64 57 58 64 60 55 179 52.2
M 0 164 56 58 50 65 62 37 164 47.8
Age, y
18–33 64 56 120 0 0 45 42 33 120 35.0
34–49 57 58 0 115 0 45 34 36 115 33.5
50–65 58 50 0 0 108 39 46 23 108 31.5
BMI, kg/m2
18.5–24.99 64 65 45 45 39 129 0 0 129 37.6
25–29.99 60 62 42 34 46 0 122 0 122 35.6
30–44 55 37 33 36 23 0 0 92 92 26.8
1
n = 343.
1446 Lemay et al.TABLE 2 Dietary components as a function of stool consistency class (hard, normal, soft) in healthy adult participants1
Dietary component Hard Normal Soft Transformation, test P
Fiber, g/1000 kcal from food 10.9 ± 0.5 11.1 ± 0.4 11.2 ± 0.5 Log, ANOVA 0.91
Fiber, g/1000 kcal from food and supplements 10.9 ± 0.5 11.1 ± 0.4 11.2 ± 0.5 Log, ANOVA 0.91
Total fat, g/1000 kcal 42.7 ± 0.7 41.3 ± 0.6 41.4 ± 0.9 None, Kruskal–Wallis 0.25
Saturated fat, g/1000 kcal 13.8 ± 0.4a 12.5 ± 0.3b 13.3 ± 0.4b None, Kruskal–Wallis 0.018
Total moisture, g/1000 kcal 1410 ± 51.9 1490 ± 67.6 1540 ± 92.1 Box-Cox, ANOVA 0.78
1
Values are mean ± SEM unless otherwise indicated. For all measures, n = 104 for hard, n = 151 for normal, and n = 80 for soft. Labeled means in a row without a common
letter differ, a > b, P < 0.05 on Dunn’s post hoc test.
Relation of stress with stool consistency Figure 12). Hard stool type was predicted by low values of the
A measure of chronic stress exposure, the Wheaton Chronic HEI subscore for fatty acids, which corresponds to lower ratios
Stress Inventory, was examined in participants who also of mono- and polyunsaturated fat consumption to saturated fat
had a stool sample processed within 24 h (n = 331). consumption (UFA:SFA). The hard stool type was also predicted
The differences in log-transformed Wheaton scores among by low values of the HEI subscore for SFA, which corresponds
Downloaded from https://academic.oup.com/jn/article/151/6/1443/6168046 by guest on 06 November 2021
stool consistency classes were not statistically significant to higher intake of SFA. Other dietary features contributing to
(P = 0.90). prediction of hard stool included a low HEI subscore for sodium
We also evaluated the relation between stool consistency (corresponding to high sodium intake), a high HEI subscore for
and a marker of physiological stress load: AL. Participants dairy, low dietary moisture, and a low total HEI score.
with a stool sample processed within 24 h and for whom AL To determine the magnitude and directionality of features
components were available (n = 321) had a mean AL score of predictive of normal stool type, as opposed to hard or soft,
2.77 ± 0.10. On average, the AL score was significantly different we interpreted the features from the “normal” predictions of
across stool consistency classes (P = 0.019) (Figure 1F). The the binary “normal” model (Figure 2B) and the trichotomous
mean AL score was lower for normal stool (2.49 ± 0.15) than class model (Supplemental Figure 12). The prediction of a
for hard (3.07 ± 0.18) or soft stool (2.89 ± 0.18) (P = 0.009 normal stool type was consistent with high values of the HEI
and P = 0.049, respectively). In summary, stool consistency subscore for fatty acids (high UFA:SFA) and high values of the
differed by physiological stress load, but not by self-reported HEI subscore for SFA (low SFA consumption). Low alcohol
stress exposure. consumption and a high HEI subscore for vegetables were also
predictive of normal stool consistency.
Diet and stress components most predictive of stool Contributors to soft stool type were determined from the
consistency binary “soft” model (Figure 2C) and the trichotomous class
The significant differences among stool consistency classes of model (Supplemental Figure 12). High alcohol consumption
HEI scores and of AL scores suggested that at least some aspects was predictive of soft stool. Low HEI subscores for vegetables,
of diet and stress may influence stool form. To further explore for fatty acids (low UFA:SFA), and for whole fruit were all
these subcomponents of the composite HEI and AL scores, predictive of soft stool.
an expanded set of 35 dietary features and AL components Figure 3 summarizes dietary contributors to stool con-
were used to build random forest models to predict class (hard, sistency (in green and orange-red). High consumption of
normal, soft), abnormal/normal, hard/not hard, and soft/not UFA:SFA increased the probability of normal stool, whereas
soft. Model OOB balanced accuracy scores were 37.4%, high consumption of SFA decreased the probability of normal
54.6%, 50.6%, and 50.1% for the class, normal, hard, and stool. Vegetable intake also increased the chance of normal
soft models, respectively. These accuracies were only marginally stool and a lack of vegetables in the diet made soft stool more
better than a naïve model, which guesses the most common stool likely. Likewise, decreased intake of whole fruit and greens
type: 33.3% for the class outcome and 50.0% for the normal, and beans also increased the chance of soft stool. As expected,
hard, and soft models, respectively. These results suggest that decreased moisture and increased sodium in the diet increased
dietary and stress components provide some predictive value, the chance of having a hard stool. Increased dairy intake
but that other factors not included in this study may improve was also associated with hard stool. High amounts of alcohol
the predictive accuracy. consumption decreased the chance of having a normal stool and
To determine the magnitude and directionality of features increased the chance of having a soft stool.
predictive of the hard stool type, we interpreted the features Physiological markers associated with stool consistency
from the “hard” outcome of the binary “hard” model included circulating HDL and total cholesterol concentrations,
(Figure 2A) and the trichotomous class model (Supplemental BMI, and plasma hsCRP concentrations. Low HDL and low
TABLE 3 Food group intake as a function of stool consistency class (hard, normal, soft) in healthy adult participants1
Food group Hard Normal Soft Transformation, test P
Vegetables, cup eq./1000 kcal 1.03 ± 0.06 1.14 ± 0.05 1.03 ± 0.08 Box-Cox, ANOVA 0.13
Intact fruit, cup eq./1000 kcal 0.48 ± 0.05 0.52 ± 0.04 0.61 ± 0.08 None, Kruskal–Wallis 0.77
Legumes, oz eq./1000 kcal 0.78 ± 0.11 0.74 ± 0.08 0.62 ± 0.10 None, Kruskal–Wallis 0.69
Nuts/seeds, oz eq./1000 kcal 0.66 ± 0.07 0.63 ± 0.06 0.65 ± 0.09 None, Kruskal–Wallis 0.84
Whole grains, oz eq./1000 kcal 0.54 ± 0.06 0.59 ± 0.05 0.59 ± 0.07 None, Kruskal–Wallis 0.34
1
Values are mean ± SEM unless otherwise indicated. For all measures, n = 104 for hard, n = 151 for normal, and n = 80 for soft. HEI scoring uses standardized cup and ounce
equivalents to measure food portions. 1 oz = 28.3 g and 1 cup = 225 mL.
Stool consistency, diet, and stress 1447FIGURE 3 Summary of dietary and physiological stress factors
Downloaded from https://academic.oup.com/jn/article/151/6/1443/6168046 by guest on 06 November 2021
and the stool form type for which they have predictive value in
healthy adult participants with complete data (n = 252). An up arrow
indicates that an increase in the magnitude of that factor increases the
probability of that stool type. A down arrow indicates that a decrease
in the magnitude of that factor increases the probability of that
stool type. Traditionally favorable dietary factors are shown in green,
unfavorable ones are in orange-red. Stress hormones are shown in
purple and remaining physiological features are shown in black. Stool
images adapted from Wikipedia (https://en.wikipedia.org/wiki/Bristo
l_stool_scale#/media/File:BristolStoolChart_(cropped).png) under CC
BY-SA 3.0 license (67). HEI, Healthy Eating Index; SFA, saturated
fat; UFA:SFA, ratio of monounsaturated and polyunsaturated fat to
saturated fat.
total cholesterol tended to predict normal stool; when these
lipoprotein measures were high, hard stool was the likely
prediction. There was some variability in the pattern of BMI
and stool consistency (mixed colors on either side of x = 0
for BMI in Figure 2A, C). However, the long tails to the right
(positive SHAP values, Figure 2A, C) suggest that, in some cases,
low BMI may markedly increase the likelihood of having a hard
stool, and high BMI may increase the likelihood of having a soft
stool.
Stress hormones associated with stool consistency were
urinary norepinephrine and cortisol (Figures 2 and 3). High
norepinephrine was predictive of the hard stool type, and low
concentrations were more likely to contribute to a normal
classification. Interestingly, both extremes of cortisol—low and
high—were associated with abnormal stool: low cortisol tended
to predict soft stool, whereas high cortisol predicted hard stool.
Discussion
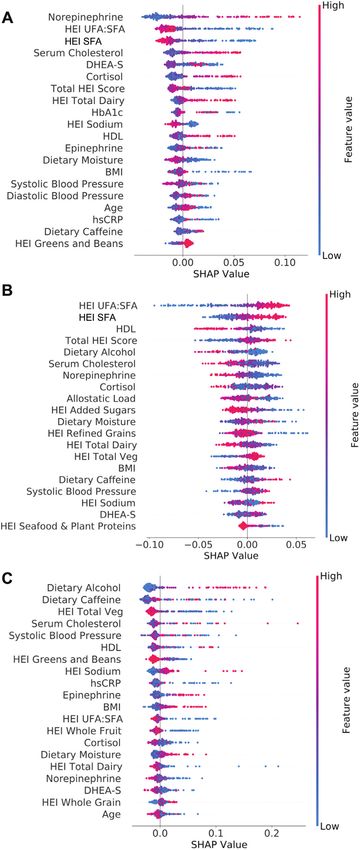
FIGURE 2 Density scatterplot of SHAP values for the 20 features The distribution of technician-scored BSFS ratings in healthy
with the highest mean absolute SHAP values for the hard (A),
adults and the factors that influence stool consistency remain
normal (B), and soft stool (C) binary outcome models in healthy
unresolved. In the current study, technicians scored the stool
adult participants with complete data (n = 252). Each dot represents
1 subject. The color of the dot represents whether the feature form of healthy adults across sex and a broad range of ages
value was high (red) or low (blue) for the given subject. SHAP and BMIs. We also leveraged these technician-scored stool data
values indicate the contribution of a feature to a given prediction, to evaluate whether nutritional, behavioral, and physiological
with a larger magnitude indicating a larger contribution (i.e., further factors explain differences in stool consistency. We found that
from 0). A positive value indicates contribution to a hard, normal, only 44.9% of healthy adults produced a normal (BSFS: 3–
or soft outcome, and a negative value to a not-hard, not-normal, 5) stool sample according to technician scoring and that both
or not-soft outcome. Features starting with “HEI” indicate the HEI dietary and physiological stress load factors, but not light or
subcomponent score and are defined in US Department of Health and moderate physical activity, were predictive of stool form score.
Human Services and USDA (58). DHEA-S, dehydroepiandrosterone
Two previous large studies investigated stool consistency in
sulfate; HbA1c, glycated hemoglobin; HEI, Healthy Eating Index;
healthy populations using the BSFS. The first was a survey in
hsCRP, high-sensitivity C-reactive protein; SFA, saturated fat; SHAP,
SHapley Additive exPlanations; UFA:SFA, ratio of monounsaturated 1992 of stool consistency in 1897 adults from East Bristol, UK,
and polyunsaturated fat to saturated fat. for which the scale is named (3). They found that 56.0% of
1448 Lemay et al.women and 61.0% of men had normal stool forms. However, individuals were placed on a 35-d monitored head-down bed-
the BSFS score of 7 was omitted from the questionnaire and the rest to observe the effect of physical inactivity mimicking
scoring was based on self-report. More recently, 4775 healthy weightlessness on bowel function (71). After 35 d, subjects were
US adults were surveyed as part of NHANES 2009–2010; the diagnosed with new-onset functional constipation, suggesting
distribution of BSFS was bell-shaped with a peak at 4 and that consistent activity, or lack thereof, influences bowel
86.2% of scores between 3 and 5 (2). However, both of these function. There remains uncertainty about the effects of physical
studies relied on self-reports. In the current study, we found only activity on stool consistency; this may be due to study or
44.9% of healthy US adults had normal stool types, and the intervention design, participant health status, stool scoring
distribution was not bell-shaped when scored by independent methods, and other unaccounted factors, such as dietary habits.
technicians. Preliminary analysis of intermediate data on the More research is needed to determine the impact of physical
present cohort led us to hypothesize that self-reports may differ activity on stool consistency.
from independent evaluation. We subsequently collected self- Stress associates with gastrointestinal disturbances (49),
reported BSFS scores in addition to the technician scores for the which are thought to result from stress-related alterations in
109 remaining participants and found that self-reported BSFS several neurobiological systems, including the HPA axis and the
scores were biased toward the ideal stool consistency. Therefore, ANS (50). Chronic stress was shown to predict gastrointestinal
discrepancies with prior reports on stool consistency may be symptoms and clinical outcome in IBS patients (72). However,
Downloaded from https://academic.oup.com/jn/article/151/6/1443/6168046 by guest on 06 November 2021
due, at least in part, to independent evaluation. there is limited evidence showing an association between
In our study, higher vegetable intake was a predictor of gastrointestinal symptoms and the physiological stress load
normal stool consistency in healthy adults. This observation index, AL, in healthy participants. For the first time, to our
is consistent with 2 wide-scale survey studies of constipated knowledge, we showed a sex-, age-, and BMI-independent
individuals and their dietary habits (22, 24). Both studies association between AL and stool consistency in healthy
reported that fruit and vegetable intake correlated with a participants. Moreover, our findings suggest that a higher
lower constipation prevalence, suggesting that higher intake AL may lead to either harder or softer stools. Although
of these food groups may improve stool consistency. Similarly, speculative, we suggest that this apparently bimodal association
other studies (23, 25, 68, 69) showed that increased fiber with higher AL may be due to individual differences in stress
intake, whether in the form of fruits and vegetables or fiber response mediators. Both hyper- and hypocortisolemia are
supplements, correlated with an improvement toward normal associated with disease risk. Therefore, as reported by us
stool among diarrhea- or constipation-predominant subjects. (60) and others (73), both higher (highest octile) and lower
However, these dietary interventions aimed to alleviate gastroin- (lowest octile) urinary cortisol concentrations were used to
testinal symptoms in subjects with a chronic gastrointestinal indicate higher total AL. Interestingly, we found that higher
disorder. Our results suggest that dietary factors may be relevant urinary cortisol concentrations predicted hard stools, whereas
even in healthy subjects. low concentrations predicted soft stools. Thus, a higher AL
The association between dietary fiber and stool consistency profile characterized by higher urinary cortisol concentrations
is unresolved. A meta-analysis of 5 randomized controlled trials may increase vulnerability to harder stool consistency or
showed no effect of dietary fiber on stool consistency (70). constipation. On the other hand, a profile of higher overall AL
Researchers using data from the NHANES 2005–2008 cycles and comparatively lower urinary cortisol concentrations may
(9373 adults) failed to observe an association between dietary increase risk of softer stools or diarrhea. In support of this
fiber and constipation (19). However, data from NHANES idea, a study of women with different IBS subtypes showed
2007–2020 suggest dietary fiber intake is lower in constipated that higher serum cortisol during sleep was associated with
participants (BSFS type 1 or type 2, n = 771; BSFS >2, constipation-predominant IBS, whereas diarrhea-predominant
n = 9192) (45). In our study, we found no association between IBS was related to lower serum cortisol during sleep (74). As we
dietary fiber and stool consistency. However, stool consistency found with increased urinary cortisol, we also found that higher
was self-reported as “usual” stool type in NHANES, likely urinary concentrations of norepinephrine were associated with
capturing more extreme constipation (7.70% of participants) harder stool consistency. Of these 2 central stress pathways, only
than stool samples classified as hard in the current study (31.2% lower cortisol was associated with soft stools, compared with
of participants), which may not be the participant’s usual stool the normal-stool subgroup.
consistency. Our results suggest other dietary factors, such Although we cannot determine mechanisms in this study,
as SFA intake, should be considered in addition to dietary associations between a harder stool consistency and nore-
fiber. pinephrine and cortisol may be related to an overactive SNS.
In the current study, we unexpectedly failed to observe an The IBS constipation subtype has been linked to a condition of
association between physical activity and stool consistency. hyperarousal, including in the SNS and the adrenal system (74).
Prior reports showed increased physical activity to be associated Elevated norepinephrine exposure can affect stool consistency
with lower constipation prevalence and higher likelihood by altering gut blood flow, immune activity, nutrient absorption,
of normal stool consistency. One study observed that brisk microbe activity, and motility (75). Chronically elevated cortisol
walking, jogging, or bicycling for just 2–6 times/wk correlated can alter brain regions that regulate activity in and reactivity
with a 35% reduced risk of constipation (21). Another study of the ANS and the HPA system. Our findings in participants
reported that typically inactive middle-aged subjects who displaying harder stools may reflect cortisol-driven facilitation
followed a 12-wk program of regular brisk walking experienced in the SNS. Of course, alterations in both circulating cortisol
significant reductions in constipation and hard stools (46). and SNS activity may result in immune system changes in
However, unlike in our study, these prior studies focused on the gut which are thought to influence stool consistency (76).
individuals with pre-existing gastrointestinal conditions and Abnormally low cortisol and cortisol hyporesponsiveness are
who were typically inactive. In addition, bowel symptoms and linked to an overactive immune system and inflammation
activity were self-reported. In a unique study healthy, active which might, in part, explain diarrhea-subtype IBS and our
Stool consistency, diet, and stress 1449findings showing an association between lower urinary cortisol References
concentrations and softer stools.
1. Chumpitazi BP, Self MM, Czyzewski DI, Cejka S, Swank PR, Shulman
Machine learning analyses are capable of evaluating complex RJ. Bristol Stool Form Scale reliability and agreement decreases when
relations. For example, the statistical analysis suggests no determining Rome III stool form designations. Neurogastroenterol
relation, on average, between BMI and stool consistency Motil 2016;28(3):443–8.
class. However, random forest models incorporate nonlinear 2. Mitsuhashi S, Ballou S, Jiang ZG, Hirsch W, Nee J, Iturrino J, Cheng V,
combinations of features. Where BMI alone may not be Lembo A. Characterizing normal bowel frequency and consistency in a
representative sample of adults in the United States (NHANES). Am J
informative, a high BMI in combination with high alcohol Gastroenterol 2018;113(1):115–23.
consumption and low cortisol may predict a phenotype in which 3. Heaton KW, Radvan J, Cripps H, Mountford RA, Braddon FEM,
stress-induced cortisol is inhibited, resulting in softer stool. Hughes AO. Defecation frequency and timing, and stool form in the
Future mechanistic studies to determine whether and how stress, general population: a prospective study. Gut 1992;33(6):818–24.
cortisol, norepinephrine, and dietary factors interact to alter gut 4. Howarth L, Petrisko Y, Furchner-Evanson A, Nemoseck T, Kern
function and stool consistency in otherwise healthy individuals M. Snack selection influences nutrient intake, triglycerides, and
bowel habits of adult women: a pilot study. J Am Diet Assoc
are warranted.
2010;110(9):1322–7.
There are limitations of our study. This study had a cross-
5. Carabin IG, Lyon MR, Wood S, Pelletier X, Donazzolo Y, Burdock GA.
sectional design and, compared with other studies on stool Supplementation of the diet with the functional fiber PolyGlycoplex® is
Downloaded from https://academic.oup.com/jn/article/151/6/1443/6168046 by guest on 06 November 2021
consistency, our study had a relatively small sample size. In well tolerated by healthy subjects in a clinical trial. Nutr J 2009;8(1):9.
addition, the balanced accuracy scores of the random forest 6. Timm DA, Thomas W, Boileau TW, Williamson-Hughes PS, Slavin JL.
models were low, with little information gain relative to Polydextrose and soluble corn fiber increase five-day fecal wet weight
the baseline models. The small sample size and unbalanced in healthy men and women. J Nutr 2013;143(4):473–8.
class distribution may have limited our power to build a 7. Vandeputte D, Falony G, Vieira-Silva S, Tito RY, Joossens M,
Raes J. Stool consistency is strongly associated with gut microbiota
model that could sufficiently classify the smaller classes [for richness and composition, enterotypes and bacterial growth rates. Gut
example, soft (n = 57) compared with all nonsoft (n = 195)]. 2016;65(1):57–62.
However, participants were multiethnic and balanced for sex, 8. Degen LP, Phillips SF. How well does stool form reflect colonic transit?
age, and BMI. Use of technicians to score stool consistency Gut 1996;39(1):109–13.
was another strength of our study. However, there was some 9. Zimmer J, Lange B, Frick JS, Sauer H, Zimmermann K, Schwiertz
delay between collection and observation times and scores A, Rusch K, Klosterhalfen S, Enck P. A vegan or vegetarian diet
substantially alters the human colonic faecal microbiota. Eur J Clin Nutr
were substantially different from self-reports beyond a 24-
2012;66(1):53–60.
h delay. Our study is the first that we know of to test
10. Bianchi MA, Scazzina F, Del Rio D, Valtueña S, Pellegrini N, Franzini
and report on associations between technician-scored stool L, Luisa Callegari M, Pellacani C, Buschini A, Zavaroni I, et al. Ability
consistency and diet, physical activity, and stress in a healthy of a high-total antioxidant capacity diet to increase stool weight and
population. bowel antioxidant status in human subjects. Br J Nutr 2010;104(10):
Future studies should consider technicians or trained 1500–7.
evaluators for scoring stool sample consistency. Intervention 11. Chen H-L, Cheng H-C, Wu W-T, Liu Y-J, Liu S-Y. Supplementation
of konjac glucomannan into a low-fiber Chinese diet promoted
trials are clearly needed to determine causative effects of diet, bowel movement and improved colonic ecology in constipated
stress, and their interrelations on stool consistency. However, adults: a placebo-controlled, diet-controlled trial. J Am Coll Nutr
even in this comparatively small observational study, we found 2008;27(1):102–8.
dietary and stress components that were associated with 12. Ahmad R, Naqvi AA, Al-Bukhaytan HM, Al-Nasser AH, Baqer
stool form. Given the link between stress, diet, and clinical Al-Ebrahim AH. Evaluation of aromatherapy with lavender oil
on academic stress: a randomized placebo controlled clinical trial.
conditions of the gastrointestinal system, our findings in healthy
Contemp Clin Trials Commun 2019;14:100346.
adults suggest that managing stress and certain aspects of
13. Nishida K, Sawada D, Kuwano Y, Tanaka H, Rokutan K. Health
diet may help prevent the clinical onset of gastrointestinal benefits of Lactobacillus gasseri cp2305 tablets in young adults exposed
disturbances. to chronic stress: a randomized, double-blind, placebo-controlled study.
Nutrients 2019;11(8):1859.
Acknowledgments 14. Ho S, Woodford K, Kukuljan S, Pal S. Comparative effects of A1 versus
We acknowledge Zeynep Alkan for help with the figures A2 beta-casein on gastrointestinal measures: a blinded randomised
cross-over pilot study. Eur J Clin Nutr 2014;68(9):994–1000.
and literature review; Dr. Ellen Bonnel for human studies
15. Hughes C, Davoodi-Semiromi Y, Colee JC, Culpepper T, Dahl WJ,
management; Evelyn Holguin, Annie Kan, Barbara Gale, Danna
Mai V, Christman MC, Langkamp-Henken B. Galactooligosaccharide
Juarez Rios, Justin Waller, Ashley Tovar, Christine Bowlus, supplementation reduces stress-induced gastrointestinal dysfunction
Yasmine Bouzid, Yanhua “Eva” Li, and Diane Han for human and days of cold or flu: a randomized, double-blind, controlled trial
studies and physiology assessment in the USDA Nutritional in healthy university students. Am J Clin Nutr 2011;93(6):1305–11.
Phenotyping Study; Jerome Crawford, Debra Standridge, Joe 16. Stewart ML, Nikhanj SD, Timm DA, Thomas W, Slavin JL. Evaluation
Domek, and Connor Osato for stool scoring; Joanne Arsenault of the effect of four fibers on laxation, gastrointestinal tolerance and
serum markers in healthy humans. Ann Nutr Metab 2010;56(2):91–8.
for dietary quality control; Yuchin Li for preliminary machine
17. Brandl B, Lee YM, Dunkel A, Hofmann T, Hauner H, Skurk T. Effects
learning analysis; Rashel DeCant for collection and processing of extrinsic wheat fiber supplementation on fecal weight; a randomized
of stress measures; and the Western Human Nutrition Research controlled trial. Nutrients 2020;12(2):298.
Center Bioanalytical Support Lab. The authors’ responsibilities 18. Abellán Ruiz MS, Barnuevo Espinosa MD, Contreras Fernández CJ,
were as follows—DGL, LMB, LRW, NLK, CBS, and KDL: Luque Rubia AJ, Sánchez Ayllón F, Aldeguer García M, García
designed the research; LMB, EC, and SSS: conducted the Santamaría C, López Román FJ. Digestion-resistant maltodextrin effects
on colonic transit time and stool weight: a randomized controlled
research; DGL, ELC, and KDL: analyzed the data; DGL, ELC,
clinical study. Eur J Nutr 2016;55(8):2389–97.
SSS, and KDL: wrote the paper; LMB, EC, LRW, NLK, and
19. Markland AD, Palsson O, Goode PS, Burgio KL, Busby-Whitehead J,
CBS: revised the paper; DGL: had primary responsibility for Whitehead WE. Association of low dietary intake of fiber and liquids
the final content; and all authors: read and approved the final with constipation: evidence from the National Health and Nutrition
manuscript. Examination Survey. Am J Gastroenterol 2013;108(5):796–803.
1450 Lemay et al.20. Murakami K, Okubo H, Sasaki S. Dietary intake in relation to self- 39. Staudacher HM, Lomer MCE, Farquharson FM, Louis P, Fava F,
reported constipation among Japanese women aged 18–20 years. Eur Franciosi E, Scholz M, Tuohy KM, Lindsay JO, Irving PM, et al. A
J Clin Nutr 2006;60(5):650–7. diet low in FODMAPs reduces symptoms in patients with irritable
21. Dukas L. Association between physical activity, fiber intake, and bowel syndrome and a probiotic restores Bifidobacterium species: a
other lifestyle variables and constipation in a study of women. Am J randomized controlled trial. Gastroenterology 2017;153(4):936–47.
Gastroenterol 2003;98(8):1790–6. 40. Fukudo S, Ida M, Akiho H, Nakashima Y, Matsueda K. Effect of
22. Sandler RS, Jordan MC, Shelton BJ. Demographic and dietary ramosetron on stool consistency in male patients with irritable bowel
determinants of constipation in the US population. Am J Public Health syndrome with diarrhea. Clin Gastroenterol Hepatol 2014;12(6):953–
1990;80(2):185–9. 9.e4.
23. Müller-Lissner SA, Kaatz V, Brandt W, Keller J, Layer P. The perceived 41. Leventer SM, Raudibaugh K, Frissora CL, Kassem N, Keogh JC, Phillips
effect of various foods and beverages on stool consistency. Eur J J, Mangel AW. Clinical trial: dextofisopam in the treatment of patients
Gastroenterol Hepatol 2005;17(1):109–12. with diarrhoea-predominant or alternating irritable bowel syndrome.
Aliment Pharmacol Ther 2007;27(2):197–206.
24. Yang X-J, Zhang M, Zhu H-M, Tang Z, Zhao D-D, Li B-Y,
Gabriel A. Epidemiological study: correlation between diet habits and 42. Cann PA, Read NW, Holdsworth CD. What is the benefit of
constipation among elderly in Beijing region. World J Gastroenterol coarse wheat bran in patients with irritable bowel syndrome? Gut
2016;22(39):8806–11. 1984;25(2):168–73.
25. Zhang X, Tian H, Gu L, Nie Y, Ding C, Ge X, Yang B, Gong J, Li N. 43. Lyra A, Hillilä M, Huttunen T, Männikkö S, Taalikka M, Tennilä
Long-term follow-up of the effects of fecal microbiota transplantation J, Tarpila A, Lahtinen S, Ouwehand AC, Veijola L. Irritable bowel
syndrome symptom severity improves equally with probiotic and
Downloaded from https://academic.oup.com/jn/article/151/6/1443/6168046 by guest on 06 November 2021
in combination with soluble dietary fiber as a therapeutic regimen
in slow transit constipation. Sci China Life Sci 2018;61(7): placebo. World J Gastroenterol 2016;22(48):10631–42.
779–86. 44. Nakaji S, Tokunaga S, Sakamoto J, Todate M, Shimoyama T, Umeda T,
26. Lever E, Cole J, Scott SM, Emery PW, Whelan K. Systematic review: the Sugawara K. Relationship between lifestyle factors and defecation in a
effect of prunes on gastrointestinal function. Aliment Pharmacol Ther Japanese population. Eur J Nutr 2002;41(6):244–8.
2014;40(7):750–8. 45. Wilson PB. Associations between physical activity and constipation in
27. Cheng J, Tennilä J, Stenman L, Ibarra A, Kumar M, Gupta KK, Sharma adult Americans: results from the National Health and Nutrition
SS, Sen D, Garg S, Penurkar M, et al. Influence of lactitol and psyllium Examination Survey. Neurogastroenterol Motil 2020;32(5):
on bowel function in constipated Indian volunteers: a randomized, e13789.
controlled trial. Nutrients 2019;11(5):1130. 46. De Schryver AM, Keulemans YC, Peters HP, Akkermans LM, Smout AJ,
28. Martoni CJ, Evans M, Chow C-ET, Chan LS, Leyer G. Impact of a De Vries WR, Van Berge-Henegouwen GP. Effects of regular physical
probiotic product on bowel habits and microbial profile in participants activity on defecation pattern in middle-aged patients complaining of
with functional constipation: a randomized controlled trial. J Dig Dis chronic constipation. Scand J Gastroenterol 2005;40(4):422–9.
2019;20(9):435–46. 47. Johannesson E, Simrén M, Strid H, Bajor A, Sadik R. Physical
29. Yoon JY, Cha JM, Oh JK, Tan PL, Kim SH, Kwak MS, Jeon JW, Shin activity improves symptoms in irritable bowel syndrome: a randomized
HP. Probiotics ameliorate stool consistency in patients with chronic controlled trial. Am J Gastroenterol 2011;106(5):915–22.
constipation: a randomized, double-blind, placebo-controlled study. 48. Kang SH, Choi S-W, Lee SJ, Chung WS, Lee HR, Chung K-Y, Lee ES,
Dig Dis Sci 2018;63(10):2754–64. Moon HS, Kim SH, Sung JK, et al. The effects of lifestyle modification on
30. Amenta M, Cascio MT, Di Fiore P, Venturini I. Diet and chronic symptoms and quality of life in patients with irritable bowel syndrome:
constipation. Benefits of oral supplementation with symbiotic zir a prospective observational study. Gut Liver 2011;5(4):472–7.
fos (Bifidobacterium longum W11 + FOS Actilight). Acta Biomed 49. McEwen B, Nasveld P, Palmer M, Anderson R. Allostatic
2006;77(3):157–62. load: a review of the literature [Internet]. Canberra (Australia):
31. Waitzberg DL, Logullo LC, Bittencourt AF, Torrinhas RS, Shiroma GM, Department of Veterans’ Affairs; 2012. Available from: https:
Paulino NP, Teixeira-da-Silva ML. Effect of synbiotic in constipated //www.dva.gov.au/sites/default/files/files/consultation%20and%20
adult women – a randomized, double-blind, placebo-controlled study grants/healthstudies/allostatic/allostatic.pdf.
of clinical response. Clin Nutr 2013;32(1):27–33. 50. Mayer EA. The neurobiology of stress and gastrointestinal disease. Gut
32. Eswaran SL, Chey WD, Han-Markey T, Ball S, Jackson K. A 2000;47(6):861–9.
randomized controlled trial comparing the low FODMAP diet vs. 51. Blanchard EB, Lackner JM, Jaccard J, Rowell D, Carosella AM, Powell
modified NICE guidelines in US adults with IBS-D. Am J Gastroenterol C, Sanders K, Krasner S, Kuhn E. The role of stress in symptom
2016;111(12):1824–32. exacerbation among IBS patients. J Psychosom Res 2008;64(2):119–28.
33. Silk DBA, Davis A, Vulevic J, Tzortzis G, Gibson GR. Clinical trial: the 52. Diop L, Guillou S, Durand H. Probiotic food supplement reduces
effects of a trans-galactooligosaccharide prebiotic on faecal microbiota stress-induced gastrointestinal symptoms in volunteers: a double-blind,
and symptoms in irritable bowel syndrome. Aliment Pharmacol Ther placebo-controlled, randomized trial. Nutr Res 2008;28(1):1–5.
2009;29(5):508–18. 53. Drossman DA, McKee DC, Sandler RS, Mitchell CM, Cramer EM,
34. Fukudo S, Kinoshita Y, Okumura T, Ida M, Akiho H, Nakashima Lowman BC, Burger AL. Psychosocial factors in the irritable bowel
Y, Nishida A, Haruma K. Ramosetron reduces symptoms of irritable syndrome: a multivariate study of patients and nonpatients with
bowel syndrome with diarrhea and improves quality of life in women. irritable bowel syndrome. Gastroenterology 1988;95(3):701–8.
Gastroenterology 2016;150(2):358–66.e8. 54. Levy RL, Cain KC, Jarrett M, Heitkemper MM. The relationship
35. Cappello G, Spezzaferro M, Grossi L, Manzoli L, Marzio L. Peppermint between daily life stress and gastrointestinal symptoms in women with
oil (Mintoil®) in the treatment of irritable bowel syndrome: a irritable bowel syndrome. J Behav Med 1997;20(2):177–93.
prospective double blind placebo-controlled randomized trial. Dig Liver 55. Shen L, Kong H, Hou X. Prevalence of irritable bowel syndrome and
Dis 2007;39(6):530–6. its relationship with psychological stress status in Chinese university
36. Zahedi MJ, Behrouz V, Azimi M. Low fermentable oligo-di- students. J Gastroenterol Hepatol 2009;24(12):1885–90.
mono-saccharides and polyols diet versus general dietary advice 56. Baldiviez LM, Keim NL, Laugero KD, Hwang DH, Huang L,
in patients with diarrhea-predominant irritable bowel syndrome: a Woodhouse LR, Burnett DJ, Zerofsky MS, Bonnel EL, Allen LH, et al.
randomized controlled trial. J Gastroenterol Hepatol 2018;33(6): Design and implementation of a cross-sectional nutritional phenotyping
1192–9. study in healthy US adults. BMC Nutr 2017;3(1):79.
37. Zheng L, Lai Y, Lu W, Li B, Fan H, Yan Z, Gong C, Wan X, Wu J, Huang 57. Epidemiology and Genomics Research Program. Automated Self-
D, et al. Pinaverium reduces symptoms of irritable bowel syndrome in Administered 24-Hour (ASA24®) dietary assessment tool [Internet].
a multicenter, randomized, controlled trial. Clin Gastroenterol Hepatol Bethesda (MD): NIH; 2016. Available from: https://epi.grants.cancer.
2015;13(7):1285–92.e1. gov/asa24/.
38. Roberts LM, McCahon D, Holder R, Wilson S, Hobbs FR. A 58. US Department of Health and Human Services (US DHHS) and
randomised controlled trial of a probiotic ‘functional food’ in USDA. 2015–2020 Dietary Guidelines for Americans. 8th ed. [Internet].
the management of irritable bowel syndrome. BMC Gastroenterol Washington (DC): US DHHS and USDA; 2015. [Accessed 2019].
2013;13(1):45. Available from: http://health.gov/dietaryguidelines/2015/guidelines/.
Stool consistency, diet, and stress 1451You can also read