Overnight and extended hours primary care in Counties Manukau DHB - A rapid review of after hours options Tom Love, William Li 19 July 2021
←
→
Page content transcription
If your browser does not render page correctly, please read the page content below
Overnight and extended hours primary care
in Counties Manukau DHB

A rapid review of after hours options

Tom Love, William Li
19 July 2021
Contents
Executive summary ....................................................................................................................................................................... i
1.       Background ........................................................................................................................................................................... 1
                  1.1 Aims...................................................................................................................................................................... 1
                  1.2 Approach ............................................................................................................................................................ 1
2.       Key issues ............................................................................................................................................................................... 2
                  2.1 Background to services in Counties Manukau .................................................................................... 2
                  2.2 Overnight services elsewhere in New Zealand ................................................................................... 2
                  2.3 Challenges for overnight service delivery ............................................................................................. 3
3.       Utilisation patterns ............................................................................................................................................................. 7
                  3.1 Description of data ......................................................................................................................................... 7
                  3.2 Service analysis ................................................................................................................................................ 7
                  3.3 Cohort analysis...............................................................................................................................................14
4.       Options .................................................................................................................................................................................25
                  4.1 Main options ...................................................................................................................................................25
                  4.2 Decision factors .............................................................................................................................................27
About Sapere ...............................................................................................................................................................................28

Tables
Table 1 Average number of contacts with services before and after July 2018 .................................................. 8
Table 2 Average number of UCC visits before and after July 2018 ........................................................................12
Table 3 Average number of contacts, January to March 2020 vs. January to March 2021...........................14
Table 4 Average number of monthly contacts by Māori patients before and after July 2018 ....................15
Table 5 Average number of monthly contacts by patients over 65 before and after July 2018 ................17
Table 6 Average number of monthly contacts by patients under 14 before and after July 2018 .............19
Table 7 Average number of monthly contacts by CSC and HUHC holders before and after July 2018 ..21
Table 8 Average number of monthly contacts by income quintile 4+5 individuals before and after July
2018 .................................................................................................................................................................................................23

Figures
Figure 1 Total count of contacts across Counties Manukau DHB............................................................................. 8
Figure 2 Average number of contacts per month - before and after Jun 18 by time of day ......................10
Figure 3 Average number of monthly contacts by service and time of day, before and after July 201811
Figure 4 Average number of monthly visits by UCC and time of day, before and after July 2018 ...........13
Figure 6 Total number of contacts by Maori patients by month ............................................................................14
Figure 7 Average number of monthly contacts by service and time of day by Māori patients, before and after July 2018 .....................................................................................................................................................................16 Figure 8 Total number of contacts by patients over 65 by month .........................................................................17 Figure 9 Average number of monthly contacts by service and time of day by patients over 65, before and after July 2018 .....................................................................................................................................................................18 Figure 10 Total number of contacts by under 14-year olds by month .................................................................19 Figure 11 Average number of monthly contacts by service and time of day by patients under 14, before and after July 2018 ......................................................................................................................................................20 Figure 12 Total number of contacts by CSC and HUHC holders by month ........................................................21 Figure 13 Average number of monthly contacts by service and time of day by CSC and HUHC holders, before and after July 2018 ......................................................................................................................................................22 Figure 14 Total number of contacts for deprivation quintiles 4+5 individuals by month ............................23 Figure 15 Average number of monthly contacts by service and time of day for individuals in deprivation quintiles 4&5, before and after July 2018 ................................................................................................24 ii www.sapereValuation.com
Executive summary
Background

This review aims to address two questions:

         •   What has been the impact of the new after hours arrangements in the district from 1 July
             2018?
         •   What has been the impact of the DHB choosing not to fund an overnight service?

In light of these findings, the aim is then to provide advice regarding the options for the DHB to fund
services up to and beyond 11pm.

Issues

In 2018 a new after hours funding arrangement was developed across Auckland. Counties Manukau
DHB (CMDHB) chose not to fund overnight services between 11pm and 7am. East Care Urgent
Medical Centre chose to continue to offer its existing overnight services. In December 2020 East Care
ceased to provide this service, finding it unsustainable in workforce terms. This service change
presents an opportunity for CMDHB to stand back and consider the options for development of after
hours and overnight services in the district.

Overnight urgent care services other than the Emergency Department (ED) are not widely available in
the rest of New Zealand, being provided only in Auckland, Hamilton and Christchurch.

Significant challenges to overnight service delivery include:

         •   Workforce availability. In the context of primary care workforce shortages, finding staff for
             overnight services can be very difficult.
         •   Financial sustainability. The low level of demand can make the economics of overnight
             services very challenging.
         •   Safety. Small services with few staff can raise risks of clinical sustainability, as well as issues
             of scale and resilience.
         •   There are complex interactions between the delivery of urgent care services with specialist
             Urgent Care qualified staff, or with general practice based services that are more founded
             in routine primary health care. Much depends upon the goal of a service, and the
             workforce that supports delivery.
         •   Consistent signalling about service access is important for community understanding of
             how to access care.
         •   The PHO Services Agreement has a minimum standard of 95% of enrolled population
             having access to face to face After Hours Services within 60 minutes travel time. In much
             of New Zealand this is accomplished by having primary health care support ED services for
             overnight care.

www.thinkSapere.com                                                                                                i
Utilisation data
Key points from analysis of utilisation data are:
• Since the new after hours contracts in 2018 there appears to have been a small increase
in utilisation in the morning hours, from 8am.
• Overall, there has been little significant change in volumes, although across specific areas
there have been marked changed, including a major increase in Franklin.
• Peak utilisations under the current system seem to occur around 7-8pm.
• The closure of overnight services at East Care does not seem to have had an impact on
other services in the dataset, although non-overnight services appear to have shown a
slight increase in 2021.
• Since 2018 Māori utilisation of Middlemore ED has dropped, and utilisation of St John
Ambulance services has increased.
• Over 65 year old utilisation appears to have increased most markedly in Urgent Care
Centres.
• Utilisation of youth aged under 14 has decreased across the board.
• Presentations by CSC and HUHC cardholder have increased across the board, although this
is possibly driven by wider CSC eligibility and uptake.
• Presentations by deprivation quintile 4 and 5 patients has dropped in urgent care centres
and at ED, and has increased with St John ambulance services.
Options
The major options available for future investment include:
• Provide funding to restore overnight services in the East
• Develop new overnight services near Middlemore
• Develop new overnight services in the Southern part of the District
• Further extend hours for existing services
• Developing a unified overnight service across Auckland
Key considerations to bear in mind when weighing up options include:
• The overall strategic goals of extending the hours of access to services.
• The preferred urgent care models, and how these relate to core primary health care.
• Workforce constraints, and how these will be addressed.
• Issues of scale and sustainability, both in clinical and financial terms.
ii www.thinkSapere.com1. Background
1.1 Aims
This review aims to address two key questions. These are:
• What has been the impact of the new after hours arrangements in the district from 1 July
2018 on increasing access to care, reducing demand for hospital services and improving
outcomes for patients?
• What has been the impact of the DHB choosing not to fund an overnight service, including
the impact in each locality?
In light of these findings, the aim is then to provide advice regarding the options for the DHB to fund
services beyond 11pm based on current demand, for example to fund services to 1am or 7am,
including advice on localities that this service may need to be located in, and staffing levels required
for after hours and urgent care clinics.
1.2 Approach
The review has two principal aspects: the analysis of quantitative data supplied by the After Hours
Alliance on service volumes, and a series of interviews with key stakeholders to understand
background, and to elicit views on options.
Given the rapid timeframe and limitations on the data available the review seeks to go as far as
feasible with the key questions, but there are limits to the extent to which they can be answered. The
goal is to go as far as is feasible with the information that is readily available. In particular, since only
patient level information on locality was not available, there are limited conclusions that can be drawn
about specific localities from the quantitative data, although the geographic location of different
services can give an indication.
www.thinkSapere.com 12. Key issues
2.1 Background to services in Counties Manukau
In 2018 a new after hours funding arrangement was developed across Auckland. At the time Counties
Manukau DHB (CMDHB) chose not to fund overnight services between 11pm and 7am, given the low
background level of utilisation in the Emergency Department over these hours. East Care Urgent
Medical Centre, however, chose to continue to offer its existing overnight services that served the
Howick, East Tamaki and Flat Bush areas. In December 2020 East Care ceased to provide this service,
finding it unsustainable in workforce terms.
At the same time, there are significant pressures upon the Emergency Department (ED) at
Middlemore, while the highest need populations within CMDHB are located to the West and South of
Middlemore. Moreover there is rapid population growth in districts further to the South, particularly
in Papakura and Franklin.
This service change presents an opportunity for CMDHB to stand back and consider the options for
development of after hours and overnight services in this rapidly changing and complex district.
2.2 Overnight services elsewhere in New Zealand
Much of New Zealand does not have access to overnight primary health care, and is typically reliant
upon Emergency Departments for urgent care between 11pm and 7am. Overnight primary care is
available in three parts of Aotearoa.
Auckland
Overnight services are available at
• Shorecare Smales Farm, on the North Shore
• Westcare White Cross Henderson
• White Cross Ascot, in Auckland DHB, though close to the border with CMDHB.
These services are provided under contract to Auckland and Waitemata DHBs. Subsidies are provided
for holders of CSC and HUHC cards, under 14s and people aged 65 and over.
Hamilton
Te Rapa Urgent Care and Medical Centre provides a 24 hour service in Hamilton. The Urgent Care
service is provided by urgent care clinicians, and is operated distinctly from the primary care service
provided by the same centre. Anglesea Medical also provide 24 hour services, with DHB funding for
overnight provision.
2 www.thinkSapere.comChristchurch Christchurch has a 24 hour surgery, managed by Pegasus Health on contract to Canterbury DHB. It is staffed by a combination of local GPs and directly employed specialist urgent care clinicians, with an extensive nursing staff. Other centres Overnight urgent primary care is not provided elsewhere in New Zealand, and local communities are typically reliant upon the local ED for access to care overnight. In central Wellington the Accident and Urgent Medical Centre is open from 8am to 9pm. It was originally established in the early 1990s as a 24 hour service, but the overnight component was dropped, primarily for reasons of financial viability. In that case general practice makes a financial contribution to ED, allowing for additional ED staffing, to recognise the general practice obligation to provide after hours services. Kenepuru Hospital, in Porirua, is the site for 24 hour accident and medical clinic. Local general practice provides much of the staffing, with the DHB providing staff for the overnight component of the service. The Accident and Urgent Medical Centre in Tauranga is open from 8am to 9pm. Dunedin’s Urgent Doctors Service opens from 8am to 10pm. 2.3 Challenges for overnight service delivery Stakeholders identified several clear challenges to overnight service delivery. These are: Workforce availability This is a significant constraint for overnight services. Given the context of significant workforce shortages in primary care more generally, finding staff who are willing to operate an overnight service can be highly challenging. The process of finding staff is likely to be slow and involved, meaning that there is likely to be a delay of several months between deciding to fund and provide any overnight service and developing the capability to do so. While there are other constraints upon overnight services, it is widely considered that workforce availability is the major challenge in operating a sustainable service. This is exacerbated when an overnight service is small in scale, depending upon only a handful of clinicians. In this case it may only take a loss of one or two people from a roster to make an entire service unviable. Workforce constraints are also likely to apply to extending service hours more generally, even if not to a full overnight service. Pragmatically, where a clinic nominally finishes patient care at a given time, staff are likely to need to be present for an hour or more afterwards, finishing cases and closing down www.thinkSapere.com 3
the facility. A service that operates to 11 or 12 is likely to require staff to be available until 1am or
later.

Financial viability

Overnight services require significant subsidy. Demand is not high, and the unit cost of a consultation
is typically large. This means that overnight services usually require dedicated subsidy in order to
operate. A funder then has to consider the opportunity cost of that subsidy, what alternative services
(including other urgent care services) could be funded, and what relative benefit that would bring to
local communities. It should be noted that a 24 hour service was historically provided in central
Wellington, but that this was stopped due to lack of financial viability.

In this context, ED services are a different proposition. If an ED already exists as an overnight service,
the marginal cost of providing care to patients during a relatively quiet time between 11pm and 7am
may be low. ED at Middlemore sees patients self discharging at approximately 1am, after which the
service is typically quiet.

Safety

Safety has two aspects – clinical safety and personal security. Evening and overnight services typically
require security staff to be present, contributing to the cost of the service.

In terms of clinical safety, while typical overnight provision is based upon one doctor, one nurse and
one admin person plus security, this is an extremely minimal service. An additional clinician would be
a useful addition, improving the level of peer support and making the clinical team more resilient.
However our understanding is that this is not generally achieved in after hours services, given the low
overnight volumes.

Other issues

Some of the options for configuration of extended hours and overnight services will depend upon the
goal and the capability that is needed for the service. For example, the Christchurch 24 Hour Surgery
is highly equipped, and is able to operate a model in which it can stabilise a patient and monitor
overnight. This requires a different level of capability (and a different relationship with respect to
demand for ED care) than a service that is principally about immediate treatment, and which might
refer a proportion of patients onward to ED.

Similarly, staffing models can vary – a traditional staffing model for urgent care is to be reliant upon
local GPs to provide a significant part of the service, while an alternative is to staff the service with
dedicated urgent care clinicians. Again, the choice of model will to some extent reflect the range of
care that the service is intended to deliver, and the different strengths of GPs and urgent care

4                                                                                       www.thinkSapere.com
clinicians. The Canterbury model relies upon urgent care clinicians during the day and in the
overnight shift, with local GPs providing additional capacity for the busy evening shifts.

This issue raises further questions about the lines between general practice and urgent care. Pure
urgent care services will be focussed on a mode of delivery that is about triaging and treating acute
care, and will typically not provide routine primary care or enrol patients. Mixed models are more
likely to be based upon a general practice service, with extended resources for urgent care. If urgent
care services are geared to a high level of acute care, then general practitioners may not always be
comfortable with the clinical environment, a situation that is anecdotally the case in the Christchurch
24 Hour Surgery.

A number of stakeholders suggested that Middlemore ED could be better at making effective use of
Emergency Q for patient diversion than is currently the case, noting also the key positive equity
impact of Emergency Q in providing options for Māori and Pacific patients. Although emphasis on
diversion is likely to be most effective when the diversion option is geographically close to the ED.

There are broader considerations that may be important for decision making about extended hours
and overnight services, and the signals that they deliver for patients. Changing the times at which
services are open has the potential to confuse patients, particularly since they are only likely to find
out about changed times at the point when they seek to access a service. More broadly, there is a
question about whether not providing alternatives to ED at some times of the day or night sends a
message that ED should always be the default for access to urgent care. Community perceptions of
service access are likely to drive aspects of care seeking behaviour.

Several stakeholders commented on the changing nature of overnight care, and particularly on the
balance between accident and medical care, shifting from a history of predominantly accident services
to a current state of predominantly medical presentations. It seems clear that overnight services of
the future will have to have the capability to deal with serious medical needs.

PHO Agreement

As context, it should be noted that the PHO Services Agreement sets out the minimum national
requirements for access to Urgent Care Services under Schedule C, Clause Five. These are:

         (1) The PHO will Provide all Service Users with access to Urgent Care Services on a
         24-hour a day, 7-day a week basis for 52 weeks a year, in accordance with clause 3.

         (2) The PHO must ensure that Urgent Care Services that are provided by a face to
         face consultation are available to 95% of its Enrolled Population: (a) within 30
         minutes travel time during Regular Hours; and

         (b) within 60 minutes travel time during After Hours.

         (3) In order to meet its obligations set out in this clause, the PHO must ensure that
         if the PHO itself or any one or more of its Contracted Providers are unable to

www.thinkSapere.com                                                                                        5
provide Urgent Care Services, the PHO or the relevant Contracted Providers put in
place alternative arrangements for the continued provision of Urgent Care Services.
In practice, many PHOs work with their DHB, and provide a financial contribution to the overnight
provision of ED services rather than providing services themselves. The minimum After Hours access
requirement is that 95% of the population should have access to a face to face consultation within 60
minutes of travel time.
6 www.thinkSapere.com3. Utilisation patterns
3.1 Description of data
Sapere studied three sources of data provided by Counties Manukau DHB to identify changes in
service utilisation before and after the after-hour changes in July 2018, which we will henceforth refer
to as the “old period” and the “new period” respectively. These datasets provided deidentified details
for all patients who used one of three services over the period 1 January 2017 to 31 December 2020:
• Urgent care centres (UCCs)
• Middlemore Hospital ED
• St John ambulances.
For each patient, the following information was provided:
• Date of contact with health service
• Hour of day of contact with health service
• Gender
• Ethnicity
• ACC status
• Whether the patient was a Community Services Card (CSC) or High Use Health Care (HUHC)
holder
• Deprivation quintile
• Name of the site or service utilised.
Based on this data, we focused on how utilisation of the each of these three services varied across the
hours of the day, based on the average monthly contacts that were seen in each period. It is important
to note that the impacts of COVID-19 resulted in lowered utilisation in a number of months in 2020
that impacted the average number of monthly contacts. We make note where this has a significant
impact on the trend observed.
3.2 Service analysis
3.2.1 Total utilisation
The pattern of healthcare service utilisation across the DHB increased slightly following the change to
the new arrangements. Average total contacts1 per month remained largely unchanged before and
after the change (Table 1), with some minor movements in each of the three services, with a decline in
presentations to Middlemore ED the most prominent change. The overall pattern of demand over the
4 years studied did not appear to change significantly, with the exception of a drop in utilisation in
March to May 2020, likely due to COVID-19, the only major deviation (Figure 1).
1 We collectively refer to visits to UCCs, presentations to Middlemore ED or responses by St John ambulance as
“contacts”
www.thinkSapere.com 7There are two things to note with respect to the data. Firstly, the dataset for St John appeared to have
incomplete or missing data for the period January to May 2019 for some of the cohorts. We have
omitted these months when calculating averages for St John in this report, as these figures artificially
decrease the total number of average responses for the service. Secondly, the impact of COVID-19 in
March and May resulted in reduced utilisation across all services and sites, leading to a dampening of
the average number of contacts for the period after July 2018. However, in our assessment of the data,
there do not appear to be any instances where this resulted in a change in the trend reported.
Figure 1 Total count of contacts across Counties Manukau DHB
60,000
50,000
40,000
30,000 UCC
St John
20,000 Hospital ED
10,000
0
Jan
Jan
Jan
Jan
Jan
Sep
Sep
Sep
Sep
Nov
Nov
Nov
Nov
Mar
May
Jul
Mar
May
Jul
Mar
May
Jul
Mar
May
Jul
Mar
2017 2018 2019 2020 2021
Table 1 Average number of contacts with services before and after July 2018
Before July 2018 After July 2018 % change
Urgent care centres 37,127 37,930 +2.2%
Middlemore Hospital ED 9,694 9,278 -4.3%
St John ambulance 3,480 3,403* -2.2%
All services 50,301 50,611* +0.6%
*This figure removes the incomplete data for St John services between January to May 2019
Per capita utilisation rates can also provide insight into the potential changing healthcare needs of the
population. The per-1,000-person2 utilisation rate of Middlemore Hospital ED and St John (although
the latter is influenced by a gap in the data in early 2019) has been gradually declining, despite
increasing population growth in the DHB over the period studied. In contrast, the per-1,000-person
2 As monthly estimates of population do not exist, we have developed monthly population estimates based on
the annual Stats NZ subnational population estimates for DHBs where we have separated each year’s annual
population growth into 12 equal increments, and applied each of these increments each month
8 www.thinkSapere.comNo. of UCC visits per '000 people No. of responses per '000 people Number of ED visits per '000 people
0.0
1.0
2.0
3.0
4.0
5.0
6.0
7.0
8.0
0.0
5.0
10.0
15.0
20.0
25.0
-
1,000
2,000
3,000
4,000
5,000
6,000
Jan-17
Jan-17
Jan-17
Apr-17
Apr-17
Apr-17
www.thinkSapere.com
Jul-17 Jul-17
Jul-17
Oct-17 Oct-17
Oct-17
Jan-18 Jan-18
Jan-18
Apr-18 Apr-18
Apr-18
Jul-18 Jul-18
Jul-18
Figure 2 Per-1,000-persons utilisation rates
Oct-18 Oct-18
Oct-18
UCC
St John
Jan-19 Jan-19
Jan-19
Apr-19 Apr-19
Apr-19
Middlemore Hospital ED
Jul-19 Jul-19
Jul-19
increase in 2020, as a result of the impacts of COVID-19.
Oct-19 Oct-19
Oct-19
Jan-20 Jan-20 Jan-20
Apr-20 Apr-20 Apr-20
Jul-20 Jul-20 Jul-20
Oct-20 Oct-20 Oct-20
Jan-21 Jan-21 Jan-21
utilisation rate of UCCs has been steadily increasing, which was likely accelerated by a significant
93.2.2 Utilisation by time of day While utilisation volumes did not appear to significantly change between the two periods, the pattern of utilisation by time of day suggest there have been some changes. When looking at the average number of monthly contacts by time of day, there appears to be a significant spike in the average number of contacts in the morning in the new period when compared to the old period (Figure 3). Figure 3 Average number of contacts per month - before and after Jun 18 by time of day This is primarily driven by an increase in average monthly visits to UCCs in the early morning hours. Presentations to Middlemore ED broadly remained the same with the old and new arrangements, while responses by St John ambulance appeared to decline in the new period. Looking at St John utilisation by year reveals that this decline was driven by a smaller than usual levels of responses in 2019 (10% lower than previous years), rather than being attributable to a decline due to COVID-19 – St John utilisation in 2020 was largely consistent with 2017 and 2018 volumes. We can also see that there is a considerable volume of utilisation of St John and Middlemore ED past 11 PM. Between 11 PM and 7 AM, St John responded to an average of 802 patients per month (27 patients per day), while there was an average of 2,023 presentations to ED per month (67 presentations per day) in the new period. Both these figures are similar to figures during these hours over the old period, suggesting there was no significant change in utilisation of these two services following the changes to the after-hours arrangements. 10 www.thinkSapere.com
Figure 4 Average number of monthly contacts by service and time of day, before and after July 2018
Average no. of monthly contacts
Before Jul 2018
After Jul 2018
Time of day (24-hour)
3.2.3 Utilisation by location
While there is limited scope in being able to assess utilisation changed by patient location, an
assessment of how utilisation changed across UCCs between the new and old period can provide an
indication of any differences in locational impacts following the change to the new arrangements
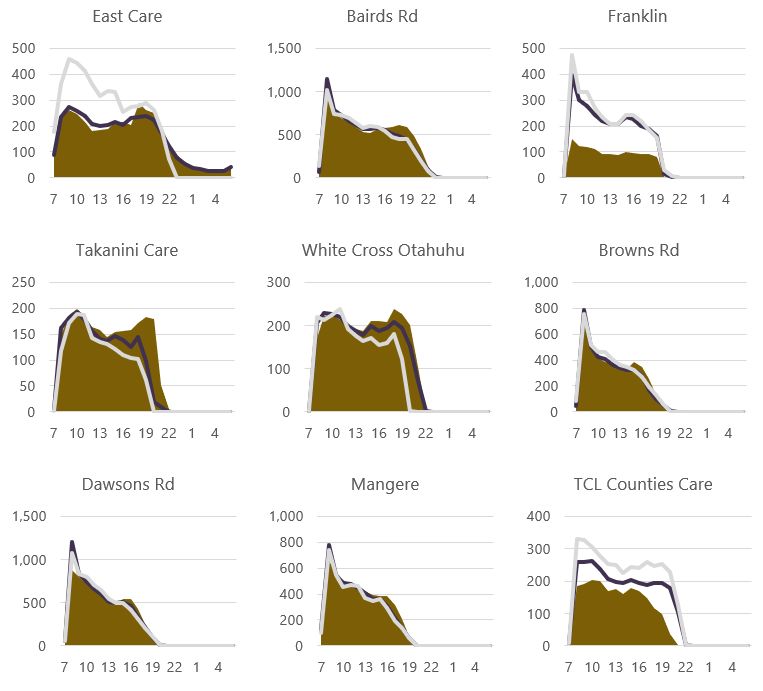
(Figure 5). In comparing the total number of visits to UCCs before and after July 2018, most UCCs had
a decline in the total number of visits with the exceptions of East Care, Franklin and TCL Counties Care.
However, in the case of the latter two, the scale and uniformity of increases in average utilisation
across all hours of the operation (Figure 5) suggests there were other factors that resulted in this
outcome beyond changes to the after-hours arrangements.
www.thinkSapere.com 11Table 2 Average number of UCC visits before and after July 2018
Before July 2018 After July 2018 % change
Bairds Rd 8,791 8,315 -5.4%
East Care 3,744 3,773 +0.8%
Franklin 1,852 2,907 +57.0%
Takanini Care 2,245 1,924 -14.3%
White Cross Otahuhu 2,814 2,618 -7.0%
Browns Rd 4,287 4,142 -3.4%
Dawsons Rd 6,979 6,728 -3.6%
Mangere 4,986 4,699 -5.8%
TCL Counties Care 2,046 3,132 +53.0%
In considering utilisation across the time of day, a general pattern that occurs across most UCCs in the
new period is an increase in the average number of visits in the early morning compared to the old
period. One possible explanation for this is that patients who would otherwise have visited an after-
hours service previously instead wait until the following day and going to their nearest clinic as a
priority if they are still feeling unwell.
While not all UCCs offer after-hours services, we can see that there is consistent utilisation for those
that offer after (5PM – 8PM) or extended (8PM – 11PM) hours. This can be most clearly seen at East
Care, which has an evening peak of utilisation at approximately 7PM (260 visits per month, or
approximately 9 visits per day) and a declining but consistent utilisation between 11PM and 7AM (457
visits per month of approximately 5 visits per day). Takanini Care, White Cross Otahuhu, TCL Counties
and Franklin also appear to have relatively high levels of after-hours utilisation before their closures at
8PM, characterised by the evening peaks seen at 7PM for the period after 30 June 2018.
12 www.thinkSapere.comFigure 5 Average number of monthly visits by UCC and time of day, before and after July 2018
Average no. of monthly contacts
Time of day (24-hour)
Before Jul 2018 Jul 2018 – Dec 2020 Jan 2021 – Mar 2021
One final point to consider with respect to location is the closure of the after-hours service at East
Care UCC in late 2020. Upon an initial assessment, there does not appear to be a major impact on
service utilisation compared to the same period a year ago (noting that March 2020 was impacted by
COVID-19 restrictions and thus reported lower utilisation across services).
Looking at UCC utilisation by time of day for the period January to March 2021, we can see a
significant increase in East Care (and TCL Counties Care) in 2021, driven largely by significant increases
in volume (January to March 2021 reported. Takanini Care and White Cross Otahuhu also show slight
deviations in 2021 compared to their post-July 2018 figures, mostly in afternoon and evening
utilisation. However, caution should be exercised in comparing averages from a 3-month period
(2021) with the averages of over 30 months (July 2018 to December 2020).
www.thinkSapere.com 13Table 3 Average number of contacts, January to March 2020 vs. January to March 2021
Jan-Mar 2020 Jan-Mar 2021 % change
Urgent care centres 38,547 39,154 +1.6%
Middlemore Hospital ED 8,917 9,209 +3.3%
St John ambulance 3,331 3,259 -2.2%
All services 50,795 51,623 +1.6%
3.3 Cohort analysis
In this section, we analyse how the utilisation of the three services changed for different cohorts
before and after the changes to the after-hours arrangements.
3.3.1 Māori
Utilisation of services by Māori patients appeared to remain relatively consistent between the old and
new period, with a decline in the average number of presentations to Middlemore ED being the
largest charge between the two periods (Table 4). There is also a significant increase in the number of
responses by St John ambulance, however as the data is incomplete during the new period, we cannot
say if this is a persistent increase.
Figure 6 Total number of contacts by Maori patients by month
14 www.thinkSapere.comTable 4 Average number of monthly contacts by Māori patients before and after July 2018
Before July 2018 After July 2018 % change
Urgent care centres 5,352 5,472 +2.8%
Middlemore Hospital ED 1,891 1,752 -7.3%
St John ambulance 458 494* +7.9%
All services 7,675 7,645 -0.4%
*This figure removes the incomplete data between January to May 2019
Analysis of service utilisation by time of day reveals a similar pattern of usage as seen with the broader
total population, with an increase in UCC visits in the early hours in the new period compared to the
old period and a broad decline in utilisation over the course of the day in both Middlemore ED.
Notably, the decline in utilisation of Middlemore ED appears to be largely driven by a large decline in
2020 (and thus, COVID-19), with utilisation in 2019 appearing broadly similar to past years, so it is
unclear if this decline represents a broader trend.
www.thinkSapere.com 15Figure 7 Average number of monthly contacts by service and time of day by Māori patients, before and after July
2018
Average no. of monthly contacts
Middlemore ED - Maori
Before Jul 2018
After Jul 2018
Time of day (24-hour)
3.3.2 Over 65
Utilisation of services by patients over 65 years appeared to increase in the new period, driven largely
by a significant increase in visits to UCCs in the new period (Table 5). As with the Māori patient data,
the data for St John’s utilisation for this cohort was incomplete and so we have made corrections to
account for this missing data. The result is a moderate decline in the utilisation of St John ambulance
over the period – however, this result should be interpreted with caution.
16 www.thinkSapere.comFigure 8 Total number of contacts by patients over 65 by month
Table 5 Average number of monthly contacts by patients over 65 before and after July 2018
Before July 2018 After July 2018 % change
Urgent care centres 3,378 3,869 +14.5%
Middlemore Hospital ED 1,942 1,954 +0.6%
St John ambulance 1,267 1,259* -0.7%
All services 6,587 6,964 +5.7%
*This figure removes the incomplete data between January to May 2019
Analysis of service utilisation by time of day reveals a similar pattern of usage as seen with the broader
total population, with an increase in UCC visits in the early hours in the new period compared to the
old period and a broad decline in utilisation over the course of the day in St John responses. Visits to
Middlemore ED increased slightly in the afternoon and early morning, but otherwise remained similar.
Notably, the decline in utilisation of Middlemore ED appears to be largely driven by a large decline in
2020 (and thus, COVID-19), with utilisation in 2019 appearing broadly similar to past years, so it is
unclear if this decline represents a broader trend or simply the impacts of COVID-19.
www.thinkSapere.com 17Figure 9 Average number of monthly contacts by service and time of day by patients over 65, before and after
July 2018
Average no. of monthly contacts
Before Jul 2018
After Jul 2018
Time of day (24-hour)
3.3.3 Under 14
Utilisation of services by patients under 14 years declined across all services following July 2018, in
large part due to significant reductions in service utilisation in 2020 (Table 6). Compared to other
cohorts, the under 14 group tends to be more volatile in terms of average contacts across the three
services in a given month. This could potentially be due to the nature of these patients being young
and typically accompanied or transported by their parents/guardians (which reduces the need for St
John transportation).
18 www.thinkSapere.comFigure 10 Total number of contacts by under 14-year olds by month
14,000
12,000
10,000
Number of contacts
8,000
UCC
6,000
St John
4,000 Hospital ED
2,000
0
1 3 5 7 9 11 1 3 5 7 9 11 1 3 5 7 9 11 1 3 5 7 9 11
2017 2018 2019 2020
Month
Table 6 Average number of monthly contacts by patients under 14 before and after July 2018
Before July 2018 After July 2018 % change
Urgent care centres 12,365 11,368 -8.1%
Middlemore Hospital ED 1,945 1,786 -14.6%
St John ambulance 329 300* -8.8%
All services 14,639 13,088 -10.6%
*This figure removes the incomplete data between January to May 2019
Analysis of service utilisation by time of day reveals a broad reduction in utilisation across most times
of the day in all three services, with only a small increase in UCC visits in the early hours in the new
period compared to the old period. As mentioned previously, the decline in utilisation of services
appears to be largely driven by significant declines in utilisation in 2020 across all three services, with
utilisation in 2019 appearing broadly similar to past years.
www.thinkSapere.com 19Figure 11 Average number of monthly contacts by service and time of day by patients under 14, before and after
July 2018
Average no. of monthly contacts
Before Jul 2018
After Jul 2018
Time of day (24-hour)
3.3.4 CSC and HUHC holders
Utilisation by CSC and HUHC holders increased significantly following the change to the after-hours
arrangements (Table 7). However, if we look at Figure 12, we can see that this is driven by a significant
increase from the April 2019 onward in all three services, as well as a noticeable absence of data for St
John and Middlemore ED between January to March 2019. Given that no major shift seems to occur in
the latter half of 2018, it is questionable as to how much of the increase reported was driven by the
change to the after-hour arrangements, and so we would advise caution when interpreting these
figures.
20 www.thinkSapere.comFigure 12 Total number of contacts by CSC and HUHC holders by month
14,000
12,000
10,000
Number of contacts
8,000
UCC
6,000
St John
Hospital ED
4,000
2,000
0
1 3 5 7 9 11 1 3 5 7 9 11 1 3 5 7 9 11 1 3 5 7 9 11
2017 2018 2019 2020
Month
Table 7 Average number of monthly contacts by CSC and HUHC holders before and after July 2018
Before July 2018 After July 2018 % change
Urgent care centres 7,835 11,936 +52.3%
Middlemore Hospital ED 2,130 3,388* +59.1%
St John ambulance 933 1,498* +53.2%
All services 10,897 17,089 +56.8%
*This figure removes the incomplete data between January to May 2019
Analysis of service utilisation by time of day reveals a broad increase across all hours of the day in all
three services, which suggests that the data is likely driven by the broad increase seen in Figure 12.
This makes it difficult to infer much from the changes in the old and new periods, although the
pattern of use seen in the new period suggests that both St John and Middlemore ED generally have
two peaks in utilisation – one in the morning (approximately 9-10 AM) and one in the evening
(approximately 7-8 PM).
www.thinkSapere.com 21Figure 13 Average number of monthly contacts by service and time of day by CSC and HUHC holders, before and
after July 2018
Average no. of monthly contacts
Before Jul 2018
After Jul 2018
Time of day (24-hour)
3.3.5 Deprivation quintiles
Utilisation by individuals in deprivation quintiles 4 and 5 decreased slightly changes to the after-hours
arrangements (Table 8), primarily driven by a decline in the utilisation of UCCs and Middlemore ED.
For the majority of the period studied, utilisation of each of the three services remained largely similar
with a very slight downward trend over the period to 2021 – however, this is likely influenced by the
impacts of COVID-19 over the first part of 2020, as the period following does not largely deviate from
previous trends.
22 www.thinkSapere.comFigure 14 Total number of contacts for deprivation quintiles 4+5 individuals by month
40,000
35,000
30,000
Total no. of contacts
25,000
20,000 UCC
St John
15,000
Hospital ED
10,000
5,000
0
1 3 5 7 9 11 1 3 5 7 9 11 1 3 5 7 9 11 1 3 5 7 9 11 1 3
2017 2018 2019 2020 2021
Table 8 Average number of monthly contacts by income quintile 4+5 individuals before and after July 2018
Before July 2018 After July 2018 % change
Urgent care centres 26,652 26,534 -0.4%
Middlemore Hospital ED 5,518 5,253 -4.8%
St John ambulance 1,502 1,638* +9.1%
All services 33,672 9,677 -0.7%
*This figure removes the incomplete data between January to May 2019
Analysis of service utilisation by time of day reveals a broad increase by the high deprivation quintile
cohort in UCC utilisation in the mornings, as well as a general increase in utilisation of St John services
over the course of the day. Middlemore ED utilisation largely remained the same, with slight declines
in the afternoon and evening peaks. After hours usage across UCCs and ED appeared to remain fairly
constant, with a slight increase in St John after 7PM.
www.thinkSapere.com 23Figure 15 Average number of monthly contacts by service and time of day for individuals in deprivation quintiles
4&5, before and after July 2018
Average no. of monthly contacts
Before Jul 2018
After Jul 2018
Time of day (24-hour)
24 www.thinkSapere.com4. Options
We set out a number of possible options for the future of overnight and extended hours services in
the Counties Manukau District. Options are not necessarily mutually exclusive, but ultimately depend
upon commissioning decisions about how to achieve greatest value for the communities of Counties
Manukau DHB.
4.1 Main options
Restore overnight services in the East
East Care provided an overnight service for the population of East Auckland, although this has not
been funded through a DHB contract since 2018. One option would be to provide funding to restore
a service in the East. This option:
• Would be subject to workforce constraints, and would require time to re-establish.
• Would provide overnight services to East Auckland, with a current demand level of
approximately 20 patients per 11pm-7am shift.
• Would continue to see overnight demand from Manukau and further South met by
Middlemore ED.
• Will be an Urgent Care service strongly supported by local general practice.
Develop new overnight services near Middlemore
A service physically located near Middlemore could have different characteristics from the former
service in East Auckland.
• A service located in Manukau or Mangere would likely have to be free or low cost at the
point of care, for at least a proportion of the population, since it would be located in a
community with particularly high socioeconomic need.
• Overnight care for people in East Auckland would have to be met by White Cross Ascot
and Middlemore ED.
• There would likely be complex issues in distinguishing between general unmet primary
care need and urgent care need, with the risk of perverse incentives to seek routine
primary care through an urgent care service unless carefully designed.
• There would be improved scope for the use of Emergency Q to a geographically close
service.
• There are existing Urgent Care services in the area, which do not operate overnight.
• All overnight options face challenges of workforce and small scale sustainability.
www.thinkSapere.com 25Develop new overnight services in the Southern part of the District
Populations in CMDHB are growing quickly, but the fastest growing populations are those in the
South of the district, in Papakura and Franklin. A long term view might consider developing more
extended hours services, and potentially overnight services, in the South. One stakeholder asserted
that there would be a future need for what would effectively be a second ED in the Southern part of
the district.
• A long term view may favour development of Urgent Care services in this part of the
district.
• Any investment would have to be planned with a very explicit growth pathway.
• There are a number of existing services that could be built upon for extended services in
this area, including those at Papakura.
• A detailed analysis of geolocated patient data will be needed to establish the potential
viability of this option.
• All overnight options face challenges of workforce and small scale sustainability.
Further extend hours for existing services
Extending the hours of existing services to a consistent closing time of 11pm or later, without
investing in overnight services. This option would essentially see investment in a number of existing
services, with the goal of pushing to a consistent evening service time for non ED car across the
district.
• This option may see higher utilisation per invested dollar than overnight options, since
evening utilisation is at a higher level than overnight consultations.
• This would leave Middlemore ED as the sole overnight option for care between 11pm and
7am for the whole district.
• The workforce constraints will still be a challenge, but are likely to be less difficult than for
an overnight service.
• Achieving consistent hours for Urgent Care services across the district will simplify
communications for patient access.
• Having no alternative to ED for a proportion of the day may risk sending a message that
ED is the default form of care ahead of Urgent Care services.
Developing a unified overnight service across Auckland
There may be the potential for a unified service across Auckland with a single team of clinicians
focussed across a small number of sites, augmented by telehealth services that can provide access to
care across a significant geographic area.
• This option would be a major change to the organisation of overnight and Urgent Care
services, and would potentially require significant disruption to existing services.
26 www.thinkSapere.com• This option would potentially be a mechanism for developing a service with significant
scale that could mitigate some of the workforce risk constraints.
• As with other options, it would be important to be clear about the cost at the point of care,
and the potential interaction with routine primary health care services.
• The combination of face to face and telemedicine will require careful design.
• Establishing a single, unified system across Auckland could have benefits for
communication about expectations of after hours care to local communities.
4.2 Decision factors
When considering these options, or other options that might arise, there are a number of key factors
that should be considered:
1. The overall strategic goal of extending the hours of service access. A number of questions
must be considered as part of this issue, including:
• To which populations is it a priority to provide service to, and what are their needs?
• How does any given option fit with wider strategy in service development?
• How do options fit with Urgent Care services across the Greater Auckland region?
2. The preferred Urgent Care model. This could be a model based more upon a general practice
supported Urgent Care service, or a more purely defined Urgent Care service that is distinct
from general practice care. As a decision factor, this will depend upon the level of service that
the service is required to provide as well as the workforce that it is expected to draw upon.
This will depend upon whether the Urgent Care service is seen as working at a level that is
approaching ED levels of capability, or a more constrained urgent care assessment and
referral service that is a closer fit with routine primary health care.
3. Workforce constraints are the major challenge in establishing any extended hours or
overnight service. Any realistic decision about after hours services will have to be made in
close consultation with provider organisations about what is viable in terms of recruitment
and retention of the clinical workforce, and with realistic consideration of the workforce issues.
4. Scale issues are important to sustainability. The potential scale of service will, in part,
determine how vulnerable a service is to workforce and demand fluctuations.
www.thinkSapere.com 27About Sapere
Sapere is one of the largest expert consulting firms in Australasia, and a leader in the provision of
independent economic, forensic accounting and public policy services. We provide independent
expert testimony, strategic advisory services, data analytics and other advice to Australasia’s private
sector corporate clients, major law firms, government agencies, and regulatory bodies.
‘Sapere’ comes from Latin (to be wise) and the phrase ‘sapere aude’ (dare to be wise). The phrase is
associated with German philosopher Immanuel Kant, who promoted the use of reason as a tool of
thought; an approach that underpins all Sapere’s practice groups.
We build and maintain effective relationships as demonstrated by the volume of repeat work. Many of
our experts have held leadership and senior management positions and are experienced in navigating
complex relationships in government, industry, and academic settings.
We adopt a collaborative approach to our work and routinely partner with specialist firms in other
fields, such as social research, IT design and architecture, and survey design. This enables us to deliver
a comprehensive product and to ensure value for money.
For more information, please contact:
Dr Tom Love
Phone: +64 4 915 5358
Mobile: +64 21 440 334
Email: tlove@thinkSapere.com
Wellington Auckland Sydney Melbourne Canberra
Level 9 Level 8 Level 18 Level 5 PO Box 252
1 Willeston Street 203 Queen Street 135 King Street 171 Collins Street Canberra City
PO Box 587 PO Box 2475 Sydney Melbourne ACT 2601
Wellington 6140 Shortland Street NSW 2000 VIC 3000
Auckland 1140
P +64 4 915 7590 P +64 9 909 5810 P +61 2 9234 0200 P +61 3 9005 1454 P +61 2 6100 6363
F +64 4 915 7596 F +64 9 909 5828 F +61 2 9234 0201 F +61 2 9234 0201 (Syd) F +61 2 9234 0201 (Syd)
www.thinkSapere.com
independence, integrity and objectivity
© 2020 Sapere Research GroupYou can also read