Overview of Hampshire's population
←
→
Page content transcription
If your browser does not render page correctly, please read the page content below
Overview of Hampshire’s
       population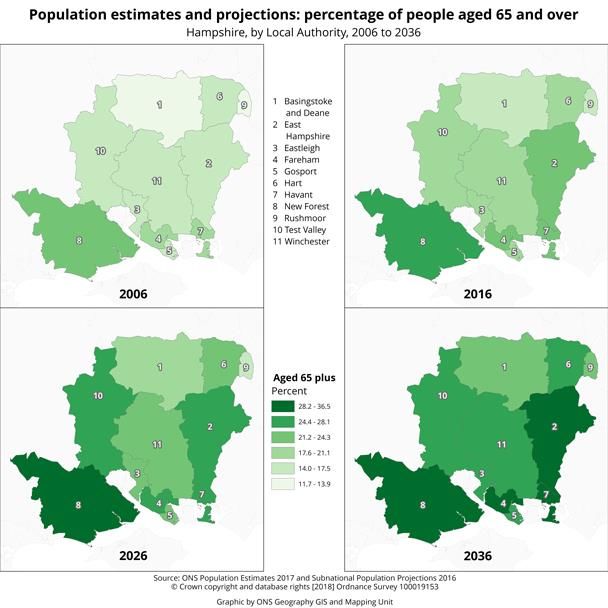
Contents

1.   Main Points ......................................................................................................................... 2
2.   Things you need to know .................................................................................................... 3
3.   Hampshire’s population is growing ...................................................................................... 4
4.   What is causing population change in Hampshire? ............................................................13
5.   Consequences of population change .................................................................................23
6.   Annex ................................................................................................................................23

                                                                    1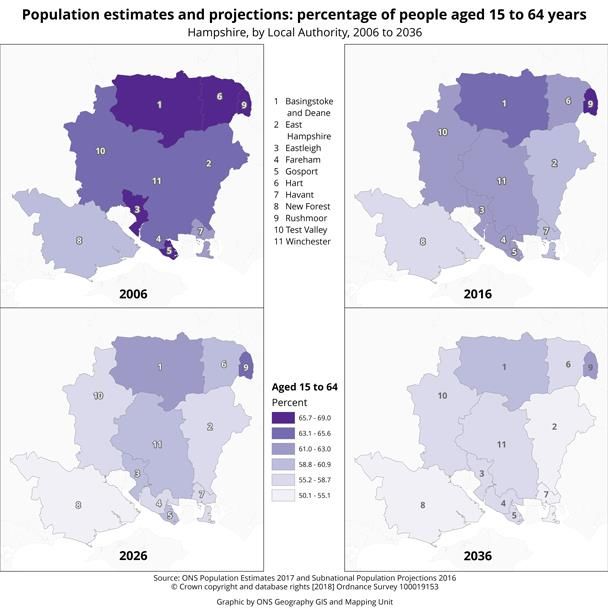
1.       Main Points

     •   In mid-2016, an estimated 1,365,000 people lived in Hampshire

     •   Over the next 20 years the population of Hampshire is projected to grow by 8.4% to 1,480,000

     •   In Hampshire, the number of households is projected to grow from 561,000 in 2014 to 671,000 in
         2039. This is an increase of nearly 20%

     •   In 2016, there were 14,400 births and 12,700 deaths in Hampshire. Between 2008 and 2016, there
         have been more births than deaths which has contributed to Hampshire’s population growth

     •   In the year to mid-2016, Hampshire’s net international migration was 2,600, with 5,700 people
         immigrating and 3,100 emigrating. In recent years Hampshire’s net migration has been steadily
         increasing, after a decade of fluctuating flows

     •   Between 2014 and 2016, the life expectancy at birth in Hampshire for men was 81 years and for
         women was 84 years, this is slightly higher than England (80 years and 83 years, respectively)

     •   British is the most common nationality in Hampshire (95%), followed by European Union (3%) and
         Non-European Union (2%)

                                                    2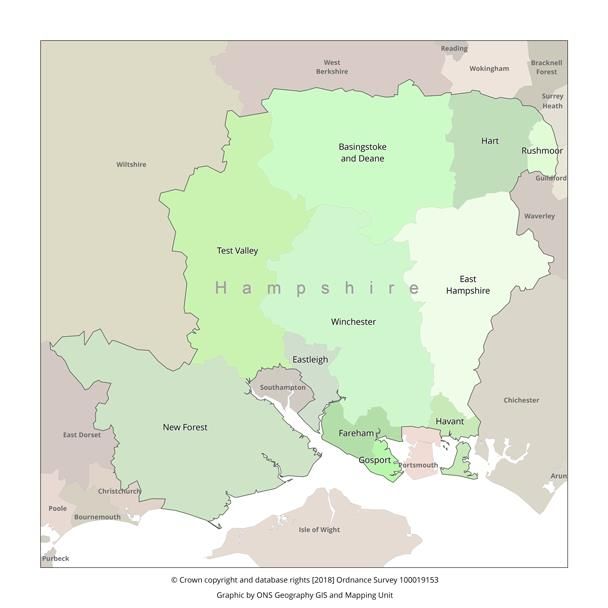
2.      Things you need to know

Definition of Hampshire

In this report we define ‘Hampshire’ as a county that consists of 11 Local Authorities (LA): Basingstoke and
Deane, East Hampshire, Eastleigh, Fareham, Gosport, Hart, Havant, New Forest, Rushmoor, Test Valley
and Winchester. Boundaries for different UK geographies do change over time. Hampshire previously
included the Isle of Wight (until 1995) and Portsmouth and Southampton (until 1997). The data used in this
report does not precede 2000, and there have been no boundary changes since this time.

Figure 1: Local authority boundaries in Hampshire, 2017

Source: ONS Geography

                                                     3
3. Hampshire’s population is growing
Population Estimates and Projections
In 2016, an estimated 1,365,000 people lived in Hampshire. This is an increase of 8,000 since 2015.
For Hampshire, the population is projected to grow by 4.8% over the next decade, from 1,365,000 in mid-
2016 to 1,431,000 by mid-2026. Over the next 20 years, the population projected to grow by 8.4% to
1,480,000. Although the population is growing, the rate of growth is not as high as England, where the
population growth is projected to increase by 10.2% from 2016 to 2036.
Figure 2: Hampshire population estimates and projections, 2001-2041
People (thousands) Estimated Projected
1500
1400
1300
1200
1100
2001 2004 2007 2010 2013 2016 2019 2022 2025 2028 2031 2034 2037 2040
Source: ONS Population estimates (Mid-2016) and Population projections 2016-2041 (Mid-2026 and Mid-
2036)
The populations of all Local Authorities within Hampshire are projected to increase by mid-2036, see Table
1. The populations of Test Valley and Winchester are projected to grow the fastest (12.3% and 11.5% over
the next two decades, respectively).
4Table 1: Projected population change for Hampshire Local Authorities, mid-2016 to mid-2036
Mid-2016 Mid-2026 Mid-2036 Projected Projected Percentage Percentage
change over change over change over 10 change over 20
10 years 20 years years years
England 55,268,100 58,505,600 60,905,500 3,237,500 5,637,400 5.9 10.2
Hampshire 1,365,100 1,431,300 1,480,400 66,200 115,300 4.8 8.4
Basingstoke and Deane 175,200 184,600 190,400 9,400 15,200 5.4 8.7
East Hampshire 118,700 124,300 128,600 5,600 9,900 4.7 8.3
Eastleigh 129,500 137,100 142,500 7,600 13,000 5.9 10.0
Fareham 115,800 122,100 127,200 6,300 11,400 5.4 9.8
Gosport 85,500 89,000 91,900 3,500 6,400 4.1 7.5
Hart 94,900 97,800 99,400 2,900 4,500 3.1 4.7
Havant 123,900 129,800 135,100 5,900 11,200 4.8 9.0
New Forest 179,500 186,000 192,000 6,500 12,500 3.6 7.0
Rushmoor 96,100 97,000 98,100 900 2,000 0.9 2.1
Test Valley 122,800 131,900 137,900 9,100 15,100 7.4 12.3
Winchester 123,100 131,500 137,200 8,400 14,100 6.8 11.5
Source: ONS Population estimates (Mid-2016) and Population projections 2016-2041 (Mid-2026 and Mid-2036)
5Hampshire’s population change by broad age groups
Hampshire’s projected population growth (4.8% over the next decade and 8.4% over the next two
decades) is primarily driven by a growth in the proportion of the population aged 65 and over (projected
21.3% increase over the next 10 years and 47.2% increase over the 20 years). This growth in the size
of the older population is a result of numerous societal changes: including improvements in the quality
of healthcare, a shift towards healthier lifestyles and increasing rates of immigration.
Table 2: Projected population change for Hampshire, by broad age group, mid-2016 to mid-
2036
Projected Projected Percentage Percentage
change change change change
Mid- Mid- Mid- over 10 over 20 over 10 over 20
2016 2026 2036 years years years years
0 to 14 years 236,000 238,000 233,000 2,000 -3,000 0.8 -1.3
15 to 64 years 844,000 847,000 827,000 3,000 -17,000 0.4 -2.0
65 and over 286,000 347,000 421,000 61,000 135,000 21.3 47.2
Source: ONS Population estimates (Mid-2016) and Population projections 2016-2041 (Mid-2026 and
Mid-2036)
Please see supplementary Excel file ‘Population estimates and projections’ for more detailed data
tables.
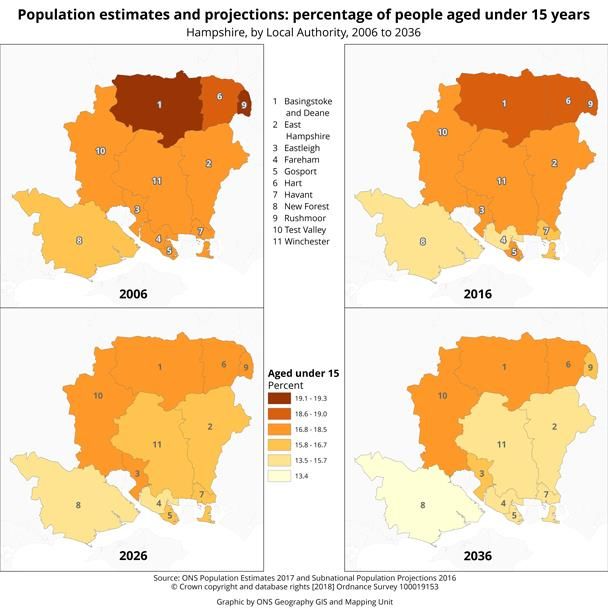
6Aged under 15
The proportion of Hampshire’s population aged under 15 is projected to decrease from 17.3% in 2016
to 16.6% in 2026 and 15% by 2036.
Figure 3: Population estimates and projections of the population aged 0 to 14 in Hampshire –
2006, 2016, 2026 & 2036
Source: ONS Population estimates and Population projections 2014-2016.
7Aged 15 to 64
The proportion of Hampshire’s population aged 15 to 64 is projected to decrease from 61.8% in 2016
to 59.1% in 2026 and to 55.9% by 2036.
Rushmoor had, and is projected to have, the highest proportion of people aged 15 to 64 across LAs in
Hampshire - 67.2% in 2016 projected to decrease to 65% in 2026 and then to 61.8% by 2036.
Figure 4: Population estimates and projections of the population aged 15 to 64 in Hampshire –
2006, 2016, 2026 & 2036
Source: ONS Population estimates and Population projections 2014-2016.
8Aged 65 and over
The proportion of the population aged 65 and over in Hampshire is projected to increase from 20.9% in
2016 to 24.2% in 2026 and 28.4% by 2036.
The greatest projected increase in the proportion of those aged 65 and over is in the New Forest; from
28.1% in 2016 to 31.8% by 2026 and 36.5% in 2036.
Figure 5: Population estimates and projections of the population aged 65 and over in
Hampshire – 2006, 2016, 2026 & 2036
Source: ONS Population estimates and Population projections 2014-2016.
For more information on population estimates by age and sex please see Figure 2 in our latest
Population estimates for England and Wales , and for Subnational projections please see Figure 6 in
our interactive population pyramid in the Subnational projections for England: 2016-based bulletin.
9Household Projections
Since 2011, a household has been defined as one person living alone, or a group of people (not
necessarily related) living at the same address who share cooking facilities and share a living room,
sitting room or dining area.
In England, the number of households is projected to grow from 22.7 million in 2014 to 28.0 million by
2039. This is an increase of 5.3 million which equates to an average of 210,000 additional households
per year.
In England, one-person households are projected to increase by 69,000 per year, about 33% of the
total household growth up to 2039. This trend is the same for Hampshire, where 33% of total growth is
due to one-person households. This is due to an ageing population and greater life expectancies.
In Hampshire, the number of households is projected to grow from 561,000 in 2014 to 671,000 in 2039.
This is an increase of approximately 20%.
Figure 6 shows the numbers of all household types are expected to increase in Hampshire between
2014 and 2039. The biggest percentage increase is ‘Other’ household types – an increase of
approximately 32% between 2014 and 2039.
The most common type of household in Hampshire in 2014 was ‘couple’ and ‘no other adult’ (173,000
households). In 2039, the most common household type will still be ‘couple’ and ‘no other adult’
(210,000 households).
Figure 6: Household projections for Hampshire, by household type, 2014 and 2039
Number of households
250
200
150
100
50
0
2014 2039 2014 2039 2014 2039 2014 2039 2014 2039
One person Couple and no other Couple and one or Households with Other
adult more other adult dependent children
Source: Department for Communities and Local Government
Please see supplementary Excel file ‘Detailed tables’ for more detailed data.
10Household projections in Hampshire by Local Authority
In 2014, the local authority with the highest number of households was New Forest (79,000) followed
by Basingstoke and Deane (71,000). The local authority with the fewest number of households was
Rushmoor (36,000). These relate to the relative sizes of the resident population. For example,
Rushmoor has one of the smallest populations of all the local authorities in Hampshire so it is likely that
it will have fewer households.
By 2039, the local authorities projected to have the highest number of households are New Forest
(94,000) and Basingstoke and Deane (89,000). The local authorities projected to have the fewest
number of households are Rushmoor (42,000) and Hart (42,000).
The biggest percentage increase in household projections between 2014 and 2039 is in Winchester,
where there is a projected rise of approximately 26% and in Basingstoke and Deane where there is a
projected rise of approximately 25%.
Figure 7: Household projections for local authorities in Hampshire, 2014 and 2039
Number of households
(thousands) 2014 2039
100
80
60
40
20
0
Source: Department for Communities and Local Government
Across all local authorities, every type of household is projected to increase between 2014 and 2039.
However, there are few exceptions. In Gosport, the number of households with dependent children is
expected to fall from 11,000 in 2014 to 10,000 in 2039.
Please see supplementary Excel file ‘Detailed tables’ for more detailed data.
11Household size
The average household size in England is projected to decrease between 2014 and 2039 from 2.35 to
2.21. Hampshire has slightly larger average household sizes than England, with 2.36 in 2014 and 2.24
in 2039, but is still projected to decline.
Figure 8: The projected average household size for England, Hampshire and its constituent
local authorities, 2014 and 2039
Source: Department for Communities and Local Government
In January 2017, it was announced that ONS would take responsibility from DCLG for the production
and publication for Household Projections for England. Further information on changes to the
methodology, future publications, an update consultation and to provide feedback can be found in the
2016-based household projections methodology for England: changes to methodology.
Please see supplementary Excel file ‘Detailed tables’ for more detailed data.
124. What is causing population change in Hampshire?
Four dimensions drive change in a population’s size: births, deaths, immigration and emigration. These
are explained as:
• Natural change – the difference between births and deaths
• Net Migration – the difference between the number of people moving into and out of an area
Migration is also categorised as:
• Internal migration – the movement of people between the four countries of the UK and between
areas in England
• International migration – the movement of people into and out of the country
Natural Change
Positive natural change implies a greater number of births than deaths in a population. If natural change
is negative, then more deaths than births have occurred.
In 2016, there were 14,000 births and 12,700 deaths in Hampshire. Between 2008 and 2016, there
were more births than deaths which has contributed to Hampshire’s population growth.
After 2012, the number of births decreased. The number of births has steadily declined since 2012. The
number of deaths has steadily increased between 2008 and 2016. The fluctuating numbers of births
and deaths have influenced natural change in the population. Figure 9 shows that the natural change
in Hampshire’s population has decreased since 2013 as the numbers of births decline and deaths
increase.
Figure 9: Hampshire births, deaths and natural change, 2008 to 2016
Number of people Natural Change Births Deaths
15000
12000
9000
6000
3000
0
2008 2009 2010 2011 2012 2013 2014 2015 2016
Source: Office for National Statistics
Please see supplementary Excel file ‘Detailed tables’ for more detailed data.
13Fertility
Fertility rates are used to enable comparisons across LAs in Hampshire as the number of births is
relative to the size of a population. The Total Fertility Rate (TFR) is the average number of live children
that a group of women would bear if they experienced the age-specific fertility rates of the calendar year
in question throughout their childbearing lifespan.
Total Fertility Rate (TFR) of 2.08 in the UK is used as a benchmark for the replacement fertility level.
An average of two children by each woman would act as a replacement for the mother and father. It
depends on several factors including the child living to reproductive age and the male-female sex ratio.
In 2016, the TFR for women in the England was 1.81; a decrease from 2.00 in 2010. Comparatively,
the TFR for women in Hampshire was 1.89 in 2016, a decrease from 2.06 in 2010, but it has fluctuated
between this period.
In the local authorities within the county of Hampshire the highest TFR in 2016 were in Test Valley and
Rushmoor (2.12 and 2.05). Fareham experienced the lowest TFR of 1.79.
Please see supplementary Excel file ‘Detailed tables’ for more detailed data.
Mortality
The Age-Standardised Mortality Rate (ASMR) is a measure of the death rate per 100,000 population.
In 2016, there were 959.8 deaths per 100,000 people in England. During the same period, 852.2 deaths
per 100,000 people were registered in Hampshire. The ASMR observed in Hampshire is considerably
lower than England in 2016.
At the local authority level, Rushmoor (1010.1) and Gosport (958.3) experienced the highest ASMRs in
2016. By way of comparison, Winchester (757.3) and New Forest (761.8) experienced the lowest during
the same period.
Please see supplementary Excel file ‘Detailed tables’ for more detailed data.
14Life Expectancy
Life expectancy at birth has been used as a measure of the health status of the population of England
and Wales since the 1840s. ONS have continued to use this measure as an indicator of geographical
inequalities in health since 2001.
Between 2014 and 2016 the life expectancy at birth in Hampshire for men was 81 years and for women
was 84 years. In comparison, between 2014 and 2016, the life expectancy at birth in England for men
was 80 years and for women was 83 years. Hampshire has a slightly higher life expectancy for both
men and women at birth in comparison to England.
Figure 1 shows that in each local authority in Hampshire women have a higher life expectancy at birth
than men. Across England women generally have a higher life expectancy than men. The highest life
expectancy at birth in Hampshire is in Hart where women at birth have a life expectancy of 86 years.
The average lowest life expectancy at birth in Hampshire are for men living in Gosport (79 years).
Figure 10: The life expectancies of men and women at birth, in England and Hampshire, 2014
to 2016
Years Female Male
87
84
81
78
75
Source: Office for National Statistics
In England between 2014 and 2016 the life expectancy for men aged 65 was 19 years and for women
aged 65 was 21 years. In Hampshire, it was 20 years for men and 22 for women.
Hampshire’s life expectancy at age 65 ranges between 19 and 23 years.
The highest life expectancy at age 65 is 23 years for women in Hart, New Forest and Winchester.
Life expectancy at birth and age 65 has improved in Hampshire – as well as the England - for both men
and women between 2001 and 2016.
The ageing population of the UK is influenced by many factors including mortality, fertility, improved
health provisions and healthier lifestyles. To explore long-term trends in life expectancy in Hampshire’s
local authorities, there is a useful tool that allows comparison of life expectancy at against other regions
of the UK.
15Please see supplementary Excel file ‘Detailed tables’ for more detailed data.
Healthy life expectancy
A related statistic to life expectancy is Healthy life expectancy (HLE). HLE is an estimate of the number
of years lived in “Very good” or “Good” general health, based on how individuals perceive their general
health.
Between 2014 and 2016, the HLE in Hampshire for a male at birth was 68 years compared to 69 years
for females. These are each higher than the respective figures in England during this time, where the
HLE for a male at birth was 63 years, and 64 years for females.
For men aged 65 in Hampshire, the HLE was 13 years, compared to 14 years for women at 65. Again,
these figures are higher than those for England, where the HLE for men at 65 was 11 years, and 11
years for women.
Please see supplementary Excel file ‘Detailed tables’ for more detailed data
16Migration
Long-Term International Migration
Net migration is the number of immigrants (people moving to the UK for more than 12 months) minus
the number of emigrants (people leaving the UK for more than 12 months).
Natural change is partly responsible for an increase in the UK’s population, but the main driver of the
UK’s population growth can be attributed to net migration. Recently Hampshire’s population follows a
similar trend.
In 2016, Hampshire had a net migration of 2,600 people; 5,700 people immigrated to Hampshire and
3,100 emigrated from Hampshire. In recent years, net migration in Hampshire has been increasing, but
over the last decade it has fluctuated greatly. Hampshire’s migration patterns are in line with the overall
migration trends for England over the past decade.
Figure 11: Long term international immigration, emigration and net migration in Hampshire,
2005 to 2016
Number of people Net migration Immigration Emigration
8000
7000
6000
5000
4000
3000
2000
1000
0
2005 2006 2007 2008 2009 2010 2011 2012 2013 2014 2015 2016
Source: International Passenger Survey
Trends in immigration and emigration for Local Authorities in Hampshire vary considerably throughout
the last decade. The New Forest and Basingstoke and Deane appear to be the two main areas that
host immigrants in Hampshire. The local authorities that experience negative net migration in
Hampshire vary from year to year.
There are many factors influencing the fluctuations in net migration. Our interactive migration timeline
highlights some key events that have taken place that may affect migration for the UK. These events
may also be affecting migration trends for Hampshire. In addition to this direct effect of migration on the
size of the population, current and past international migration also has indirect effects on the size of
the population as it changes the numbers of births and deaths in the UK.
Please see supplementary Excel file ‘Detailed tables’ for more detailed data.
17Internal migration
People are added to Hampshire’s population through internal migration as well as international
migration. Internal migration is movement from within the UK.
Hampshire’s population over the last 10 years has been growing due to positive internal net migration.
In 2016, 50,700 people moved to Hampshire from other areas of the UK. Since 2005, the LAs with the
greatest increases of internal migrants are the New Forest, Winchester and - most recently - Test Valley.
Rushmoor, Basingstoke and Deane and Eastleigh have had the highest outflow of people. Some of this
loss or gain is also from other local authorities within Hampshire.
Please see supplementary Excel file ‘Detailed tables’ for more detailed data.
Short-Term International Migration
Not everyone who visits Hampshire stays for longer than 12 months, but data on short term visits shows
how attractive Hampshire may be for people not intending to stay long term. Short term international
migration has several definitions. ONS produce estimates of Short-Term International Migration (STIM)
at Local Authority level using the United Nations (UN) definition:
"A person who moves to a country other than that of his or her usual residence for a period of at least
three months but less than a year (twelve months) except in cases where the movement to that country
is for purposes of recreation, holiday, visits to friends and relatives, business, medical treatment or
religious pilgrimage".
STIM data is available by reason for UN defined Study and Employment.
Figure 12: Short-Term International Migration for local authorities in Hampshire by reason for
visit, mid-2016
Study Employment
Basingstoke and Deane
Rushmoor
Winchester
New Forest
Test Valley
Havant
Hart
East Hampshire
Eastleigh
Fareham
Gosport
0 50 100 150 200 250 300 350 400
Number of visits
Source: International Passenger Survey and Administrative Data Sources
Notes:
1. 2016 data are provisional
18There were an estimated 2,000 visits to Hampshire for both Study (53%) and Employment (47%)
reasons in year ending mid- 2016. This accounted for 1% of all short term visits to England. Hampshire
has a similar distribution of visits by reason in comparison to the England, with 45% of visits for
Employment and 55% of visits for Study.
After estimations began in 2008, there has been a general decline across all local authorities in visits
for employment reasons until about 2012, when visits began increasing again. Short term visits for study
across most authorities have stayed relatively stable over the last decade, with a sharper increase seen
between mid-2015 and mid-2016. Hampshire did see an increase in visits for the year ending mid-2013.
Basingstoke and Deane (347), Winchester (226) and Test Valley (221) were the most popular areas for
Study. Gosport (7), East Hampshire (14) and Rushmoor (14) were the least popular for study. In
contrast, Rushmoor is one of the most popular areas for employment with 127 visits for this reason in
2016.
Please see supplementary Excel file ‘Detailed tables’ for more detailed data.
Population by Nationality
We can also estimate the population by their nationality. This is useful as it can highlight which areas
might be most affected from the UK leaving the European Union. Nationality also reflects an individual’s
rights to work and access services in the UK. See Annex 1 for grouping definitions.
British was the most popular nationality for Hampshire and its constituent Local Authorities, with 95%
of Hampshire having a British nationality in 2017. This has been decreasing since 2000, when 97.7%
of Hampshire’s population was British. England has seen a greater decrease, 95.3% of England’s
population were British Nationals in 2000 compared to 89.9% on 2017.
Between 2000 and 2015, most non-British nationality holders in Hampshire have been from countries
outside the EU. Since 2015, EU nationals have been greater. This differs from the trends England has
seen. In England the EU national population has been steadily increasing since 2000 from 1.5% to
6.2% in 2017.
Table 4 shows the Hampshire population by nationality. EU14 countries have been the most popular
nationalities, this is closely followed by EU8 countries from around 2005 and EU2 countries in 2014.
This is consistent with changes in legislation and rights to work in the UK. The population of nationals
from other European countries has remained in the several thousand over the last two decades but
decline greatly in the last four years. In the last ten years, there has also been a noticeable increase in
Asian nationals. Nationalities from the non-EU countries peaked in 2008-2009 at around 20,000 for
Hampshire. This figure has since fallen to around 8,000 to 13,000.
In 2017 the local authorities within Hampshire with the highest proportion of those with a non-British
nationality are Rushmoor (12.8%), Basingstoke (6.8%) and Test Valley (5.9%), (Table 5).
There are some local authority populations within Hampshire that differ from the county as whole.
Fareham has a very low non-British population and of those non-British the majority are from Asia and
the regions of the world beyond the EU and Asia. Since 2000, Gosport had low counts of non-British
Nationalities, and of those who are not British their nationality differs year on year.
Please see supplementary Excel file ‘Detailed tables’ for more detailed data.
19Table 4. Percentage of population by Nationality for Hampshire, 2000 to 2017
Percentage
Year Total Population British Non-British EU Non-EU EU14 EU8 EU2 EU Other Asia Rest of World Other Europe
2000 1,216,000 97.7 2.4 1.3 1.1 1.3 z z z 0.3 0.4 0.3
2001 1,220,000 98.0 2.0 0.9 1.1 0.9 z z z 0.3 0.7 0.1
2002 1,224,000 97.9 2.1 1.1 1.1 1.1 z z z 0.3 0.7 0.1
2003 1,233,000 97.2 2.8 1.3 1.5 1.3 z z z 0.6 0.7 0.2
2004 1,235,000 96.9 3.0 1.2 1.9 1.1 c z c 0.6 0.9 0.2
2005 1,243,000 97.3 2.7 1.3 1.4 0.9 0.3 z c 0.4 0.9 0.1
2006 1,252,000 96.8 3.2 1.3 1.9 1.0 0.2 z 0.1 0.5 0.9 0.2
2007 1,263,000 96.4 3.6 1.0 2.5 0.9 0.2 . c 0.7 1.5 0.3
2008 1,273,000 95.8 4.2 1.2 2.9 0.9 0.2 . . 1.1 1.7 0.1
2009 1,282,000 95.5 4.4 2.0 2.5 1.2 0.7 c c 0.8 1.6 c
2010 1,292,000 96.7 3.3 1.4 1.9 0.9 0.4 0.2 c 0.9 0.9 0.2
2011 1,302,000 97.5 2.5 1.2 1.4 0.8 0.3 0.1 c 0.8 0.5 0.2
2012 1,310,000 96.1 3.9 1.7 2.2 0.9 0.7 . c 1.2 0.9 0.2
2013 1,318,000 96.5 3.5 0.9 2.6 0.8 0.1 . . 1.5 1.0 c
2014 1,327,000 96.0 3.9 1.6 2.3 1.1 0.5 0.1 c 1.3 1.0 c
2015 1,335,000 96.1 3.9 1.9 1.9 1.1 0.5 0.3 c 1.0 0.8 c
2016 1,342,000 95.6 4.4 3.0 1.3 1.2 1.0 0.8 c 0.7 0.6 c
2017 1,350,000 95.0 4.9 3.0 1.9 1.0 1.3 0.5 0.1 1.0 0.8 0.1
Average N/A 96.6 3.4 1.5 1.9 1.0 0.5 0.3 0.1 0.8 0.9 0.2
Source: Annual Population Survey
20Notes:
1. Total will not sum to 100 due to group break downs which may include some repetitions
2. Totals may not sum due to rounding
3. Data are year ending December between 2004 and 2017, prior to this data is from March to February
4. . = no contact
5. C = not available due to disclosure control
6. Z =not applicable
21Table 5. Percentage of total population by Nationality for Local Authorities and Unitary Authorities in Hampshire, 2017
Percentage
Area Total Population British Non-British EU Non-EU EU14 EU8 EU2 EU Other Other Europe Asia Rest of World
Hampshire 1,350,000 95.0 4.9 3.0 1.9 1.0 1.3 0.5 0.1 0.1 1.0 0.8
Basingstoke 176,000 93.2 6.8 5.7 1.1 3.4 1.1 1.1 . . c c
East Hampshire 117,000 97.4 2.6 0.9 0.9 0.9 . . . . . 0.9
Eastleigh 132,000 96.2 3.0 2.3 0.8 1.5 0.8 . . c c c
Fareham 115,000 98.3 1.7 . 1.7 . . . . . . 1.7
Gosport 84,000 97.6 2.4 2.4 . c . . 2.4 . . .
Hart 93,000 95.7 4.3 2.2 2.2 . . 2.2 . . 2.2 .
Havant 122,000 97.5 3.3 1.6 1.6 . 1.6 . . . c c
New Forest 179,000 95.5 3.9 2.2 1.7 1.1 1.1 . . . c 1.1
Rushmoor 94,000 88.3 12.8 3.2 9.6 c 2.1 c . 2.1 7.4 c
Test Valley 119,000 94.1 5.9 3.4 2.5 c 3.4 . . . c 1.7
Winchester 119,000 92.4 7.6 6.7 0.8 1.7 3.4 1.7 . . c c
Source: Annual Population Survey
Notes:
1. Total will not sum to 100 due to group break downs which may include some repetitions
2. Totals may not sum due to rounding
3. Data are year ending December 2017
4. . = no contact
5. C = not available due to disclosure control
225. Consequences of population change
The population of the UK (including Hampshire) is constantly changing and is projected to continue
changing in the coming decades. With lower birth rates and higher life expectancy, the shape of the
population in the UK is transforming. Whilst longevity is something to celebrate, the proportion of those of
a working age is shrinking whilst those of a pensionable age is increasing. While a larger population can
increase the size and productive capacity of the workforce, it also increases pressure to provide social
services such as education, healthcare and housing.
6. Annex
Definitions for population by nationality
UK-born includes Guernsey, Jersey, Isle of Man, and Channel Islands. British nationality additionally
includes the following overseas territories: Anguilla; Bermuda; British Indian Ocean Territory; British Virgin
Islands; Cayman Islands; Falkland Islands; Gibraltar; Montserrat; Pitcairn, Henderson, Ducie and Oeno
Islands; South Georgia and the South Sandwich Islands; St Helena; Turks and Caicos Islands.
EU14 are the countries of the EU, excluding the UK, as constituted between 1 January 1995 and 1 May
2004. These are: Austria, Belgium, Denmark, Finland, France, Germany, Greece, Italy, Luxembourg,
Netherlands, Portugal, Republic of Ireland, Spain and Sweden.
EU8 countries are the 8 Central and Eastern European countries that acceded to the EU on 1 May 2004.
Namely, these are: Czech Republic, Estonia, Hungary, Latvia, Lithuania, Poland, Slovakia and Slovenia.
EU2 countries are the 2 countries that acceded to the EU on 1 January 2007; Bulgaria and Romania.
Other EU refers to Cyprus and Malta (which acceded to the EU on 1 May 2004), and Croatia (from 1 July
2013, when Croatia joined the EU).
EU27 countries are all the countries of the EU, excluding the UK, as constituted between 1 January 2007
and 1 July 2013. They are comprised of the EU14, EU8, EU2 and Other EU country groups
Other Europe are all the European countries not part of the EU (including Croatia up to 1 July 2013, but
excluding thereafter).
Asia includes all of the Middle East and Central Asia, East Asia, South Asia and South East Asia.
Rest of the world refers to all other countries not belonging to one of the above-defined groups.
Non-EU countries are comprised of Other Europe, Asia and Rest of the world.
23You can also read


