PALEOCLIMATE MODELLING INTERCOMPARISON PROJECT (PMIP): 30TH ANNIVERSARY - EDITORS
←
→
Page content transcription
If your browser does not render page correctly, please read the page content below
VOLUME 29 ∙ NO 2 ∙ November 2021

                                                                            MAGAZINE

                                   The PMIP model family

PALEOCLIMATE MODELLING
INTERCOMPARISON PROJECT
(PMIP): 30TH ANNIVERSARY

EDITORS
Paul J. Valdes, Pascale Braconnot, Katrin J. Meissner and Sarah Eggleston
62                                                                ANNOUNCEMENTS

                                                                                                   Calendar
     News                                                                                          LandCover6k: New land-cover and land-use
     6th Open Science Meeting and 4th Young Scientists Meeting                                     datasets for evaluation and improvement of
     Due to the continuing uncertainties related to the COVID-19 pandemic, the decision was        anthropogenic land-cover change scenarios
     made by the Local Organizing Committee, the PAGES SSC, and the PAGES EXCOM to                 2-4 December 2021 – Online
     hold the Open Science Meeting (OSM) and Young Scientists Meeting (YSM) online in
                                                                                                   SISAL: Towards a global compilation of
     2022. The dates for the OSM are 16-20 May 2022 and the YSM will be taking place from
                                                                                                   speleothem trace element records
     9-13 May 2022. The deadline for OSM abstract submissions and YSM applications is
                                                                                                   28 Feb-4 Mar 2022 – Jerusalem, Israel
     31 January 2022. More information: pages-osm.org
                                                                                                   C-SIDE: Integrating sea-ice proxies, model
     PAGES IAI and African Mobility Fellowships
                                                                                                   simulations, and complementary records of
     2021 saw the launch of two mobility fellowships for early-career scientists studying past
                                                                                                   glacial-interglacial climate change
     global changes: The PAGES-IAI International Mobility Research Fellowship Program
                                                                                                   May 2022 (exact dates TBC) – Bordeaux, France
     for Latin American and Caribbean early-career scientists and The PAGES Inter-Africa
     Mobility Research Fellowship Program for African early-career scientists. More details:       VICS: Moving forward by looking back
     pastglobalchanges.org/support#mobility                                                        2022 (exact dates TBC) – Aarhus, Denmark
     New PAGES website                                                                             Due to COVID-19 disruptions, dates and venues
     In the summer of 2021 PAGES launched its new website. While we are thrilled with the          are subject to change. Please check the website
     fresh and updated look, we are experiencing issues which we are working tirelessly to         regularly for updates from the organizers.
     iron out. We appreciate your patience and understanding in this teething phase. You are
                                                                                                   pastglobalchanges.org/calendar
     welcome to email us about any issues you spot: pages@pages.unibe.ch

                                                                                                   Featured publications
     Goodbye and welcome to SSC and EXCOM members
     PAGES says thank you and bids farewell to five members who will be rotating off the SSC
     at the end of 2021: Asfawossen Asrat, Cristiano Chiessi, Michael Evans, Lindsey Gillson,
     and Katrin Meissner. In January 2022, we welcome Ilham Bouimetarhan, Martin Grosjean,         Thresholds, tipping points, and multiple
     and Fabrice Lambert to the SSC, and Paul Valdes and Boris Vannière will replace Michael       equilibria in the Earth system
     Evans and Katrin Meissner on the EXCOM.                                                       Victor Brovkin, together with members of the
                                                                                                   PAGES integrative activity on Thresholds and
     Apply to be on our SSC
                                                                                                   the Future Earth global research project AIMES,
     PAGES is pleased to announce that the call for applications from scientists to serve on its
                                                                                                   showed that past abrupt climate changes
     Scientific Steering Committee for the term starting January 2023 is now open. The next
                                                                                                   provide evidence of cascading tipping points
     deadline for applications is 4 April 2022. Details: pastglobalchanges.org/be-involved/
                                                                                                   and early warning signals in the Earth system:
     ssc/apply
                                                                                                   pastglobalchanges.org/publications/128389
     PAGES Early-Career Network
                                                                                                   PALSEA
     PAGES' ECN is pleased to welcome two new members to the steering committee:
                                                                                                   Blake Dyer et al. compared paleo sea-level
     Georgy Falster (Postdoctoral Fellow, Australian National University, Australia) and
                                                                                                   observations from the Bahamian archipelago to
     Ignacio Jara (Postdoctoral Researcher, CEAZA Scientific Centre, Chile). They will join the
                                                                                                   results from several Earth deformation models
     steering committee in its primary tasks of visioning, coordination, communication, and
                                                                                                   to explore the sensitivity of polar ice sheets to
     organization for the ECN.
                                                                                                   high-latitude warming. Results indicate that previ-
     New working group                                                                             ous estimates should be corrected downward:
     PAGES is pleased to announce the launch of the new PaleoEcoGen working group, which           pastglobalchanges.org/publications/128491
     aims to improve our understanding of past critical ecological transitions based on a key
                                                                                                   C-PEAT
     and emerging proxy: ancient environmental DNA. The group is motivated to address the
                                                                                                   In collaboration with PAGES and Future Earth,
     key question: what can we learn about the mechanisms leading to critical transitions and
                                                                                                   C-PEAT leaders took part in the UN Framework
     their subsequent evolutionary and ecological trajectories based on the comparison of
                                                                                                   Convention on Climate Change (COP26). They
     biomes in paleorecords from terrestrial and aquatic biomes? Find out more and join its
                                                                                                   were present at the Peatland Pavilion, showing an
     activities: pastglobalchanges.org/paleoecogen
                                                                                                   interactive peatland map with >75 sites from 20
     New endorsed group                                                                            countries that have been studied by the C-PEAT
     The Climate Change & History Research Initiative (CCHRI) was recently endorsed                community: pastglobalchanges.org/c-peat
     by PAGES. CCHRI is an international interdisciplinary project to bring together
                                                                                                   CRIAS
     archaeologists, historians, and climate historians as well as paleoenvironmentalists to
                                                                                                   The group's special issue in Climate of the Past
     address past responses to environmental challenges. All details: pastglobalchanges.org/
                                                                                                   "International methods and comparisons in
     science/endorsed-wg/cchri
                                                                                                   climate reconstruction and impacts from archives
     Deadline for new working groups and financial support                                         of societies" currently includes seven papers
     The next deadline to propose a new PAGES working group or apply for financial                 focusing on different world regions, and two
     support for a workshop, meeting, or conference, as well as for Data Steward Scholarship       papers under review: pastglobalchanges.org/
     applications will be on 31 March 2022. All details: pastglobalchanges.org/support             publications/special-issues/13159
     PAGES IPO staff update
     PAGES' International Project Office recently bade farewell to Angela Wade, who
     navigated PAGES' communications and office management for six years. We thank
     Angela for her dedication over the years and welcome Chené van Rensburg and Leigh             Cover
     Martens Winiger, who have replaced Angela. In addition, we welcome Ursula Widmer
                                                                                                   Group "photo" representing the different
     as the new Finance and Office Manager, who has taken over from Monika Hofer, and
                                                                                                   models used to simulate the mid-Holocene
     Francesco Verde, who has replaced Shashika Sedara Hettige as IT Coordinator. All new
                                                                                                   climate following PMIP3 or PMIP4 protocols.
     contact details can be found on the PAGES website: pastglobalchanges.org/about/
                                                                                                   The different parts of the heads represent dif-
     structure/international-project-office
                                                                                                   ferent climate indicators. These statistics are
     Upcoming issue of Past Global Changes Magazine                                                presented as Chernoff faces, which allows us to
     The next magazine, guest edited by Lindsey Gillson, Peter Gell, Cathy Whitlock, Willy         compare how the different models represent
     Tinner, and Sabine Prader, focuses on paleoecology and restoration ecology. Members           the change in temperature seasonality over the
     of the DiverseK working group are additionally organizing a mini-section within the issue.    Eurasian continent and monsoon precipitation
     Although preparations are well underway, if you would like to contribute, please contact      over India and Africa. Illustration by Jean-Yves
     our Science Officer: sarah.eggleston@pages.unibe.ch                                           Petershmitt and Pascale Braconnot.

                                                 PAGES MAGAZINE ∙ VOLUME 29 ∙ NO 2 ∙ November 2021                                               CC-BY
EDITORIAL: Paleoclimate Modelling Intercomparison Project 63
doi.org/10.22498/pages.29.2.63
Paleoclimate Modelling
Intercomparison Project
Paul J. Valdes1, P. Braconnot2 and K.J. Meissner3
Thirty years is a long time in science. New PMIP has changed all of this. By ensuring and the exciting new developments for the
data leads to revisions of old theories, and that modelers perform identical simula- future. We hope you enjoy the read and the
new theories challenge interpretations. tions, we can now quantify (some aspects) of time spent with the growing PMIP model
Thirty years is a particularly long time in the uncertainty intrinsic to climate models; family.
climate research, with huge advances in by performing simulations with different
our understanding and ability to predict boundary conditions, such as using alterna- Some of us have been lucky to have seen the
climate change and its impacts. Throughout tive ice-sheet reconstructions, we can quan- full evolution of PMIP, attending the very first
this time, the Paleoclimate Modelling tify uncertainties arising from a single source meeting in Paris involving about 40 research-
Intercomparison Project (PMIP) has been at of interest. In the early days of PMIP, the ers, to the latest workshop with more than
the forefront of testing the latest generation climate models were often slightly older than 120 researchers of all nationalities and ages.
of climate and Earth system models against the state of the art, but in recent years, PMIP The workshops have always been stunning
paleoclimate data, acting as an important modelers have been using the same models in terms of the excitement in the science,
conduit between the paleodata community as those being used to support the IPCC as- and the enjoyable and lively discussions (and
and the climate modelers involved in future sessments, ensuring that the lessons learned also the fun dancing and singing and dining
projections. It has also acted as an important can directly inform future projections. which have become a tradition at these
motivator of paleodatabase development, workshops). Future challenges and opportu-
which is so essential for rigorous model–data Similarly, PMIP has also helped bridge the nities continue, with exciting developments
comparisons. divide between modelers and paleodata including the use of Earth system models
scientists. It is now common for both model- and the integration of transient simulations
Thirty years ago, the paleo community ers and data collectors to work together to all ensuring that PMIP will continue to have a
was quite divided between the scientists analyze model output and compare data, long and exciting future.
developing and collecting data and the pa- and it is increasingly common for members
leoclimate modelers. Researchers collected of the paleodata community to spend time in AFFILIATIONS
paleoenvironmental data and developed modeling labs and perform model simula- 1
School of Geographical Sciences, University of
interpretations of this data in terms of past tions. Some modelers even spend time in the Bristol, UK
climate, but many were somewhat suspi- field! Such collaborations drive innovation, 2
Laboratoire des Sciences du Climat et de
cious of climate modelers, who seemed to and some of the most exciting recent devel- l'Environnement, LSCE/IPSL, UMR CEA-CNRS-UVSQ,
sit in front of their computers and never go opments are in cross-over areas such as data Université Paris-Saclay, Gif sur Yvette, France
out into the field. The modelers confidently assimilation.
3
Climate Change Research Centre, University of New
South Wales, Sydney, Australia
discussed the changes in climate around the
globe for particular time periods of the past, This issue of Past Global Changes Magazine CONTACT
yet they could not calculate the uncertainty contains a range of contributions highlight- Paul Valdes: P.J.Valdes@bristol.ac.uk
in their model results. ing the amazing achievements of PMIP
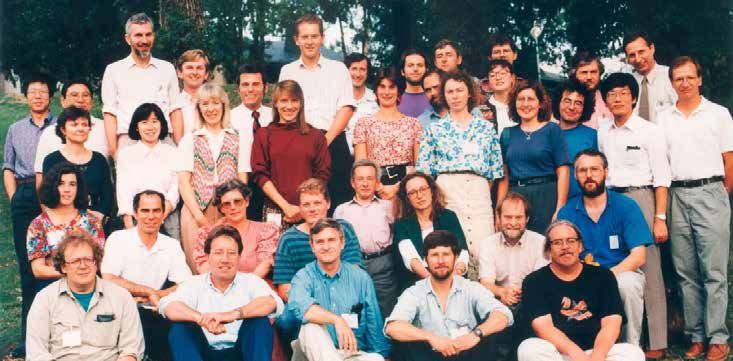
Figure 1: Participants at the PMIP workshop in Collonges-la-Rouge, France. Many are still involved in the PMIP community, though some are looking a lot older!
Front row: Pat Bartlein, Robin Webb (?), John Kutzbach, Dave Pollard, Bob Oglesby. Second row: Pascale Braconnot, Karl Taylor, Sandy Harrison, Gerhard Krinner, Klaus
Herterich, Sylvie Joussaume, Norman MacFarlane, Jozef Sytkus. Third row: (?), Ayako Abe-Ouchi, Bette Otto-Bliesner, Lisa Sloan, Natalie de Noblet, Michael Lautenschlager (?),
Marie-France Loutre, Masa Kageyama, Valerie Masson, Gilles Ramstein, Akio Kitoh, Tony Broccoli. Back row: Buwen Dong, Jai-Oh Oh (?), John Mitchell, Paul Valdes, Michael
Schlesinger, Chris Hewitt, David Rind, Christophe Genthon (?), Alex Kislov, Dominique Jolly (?), Joel Guiot, Mikhail Verbitsky.
Corrections and additions sent to pages@pages.unibe.ch are very welcome!
PAGES MAGAZINE ∙ VOLUME 29 ∙ NO 2 ∙ November 2021 CC-BY
64 SCIENCE HIGHLIGHTS: Paleoclimate Modelling Intercomparison Project
doi.org/10.22498/pages.29.2.64
PMIP: Looking back to its first phase
Sylvie Joussaume1 and Karl E. Taylor2
The Paleoclimate Modelling Intercomparison Project celebrates its 30th anniversary in 2021. The first phase initiated
systematic model-model and model–data comparisons for the Last Glacial Maximum and Mid-Holocene. Here, we
describe the historical context of PMIP, the experiment design, and the project's early impacts.
PMIP Launch proponents and its merits, and in the end, key to the success of COHMAP. Thus, one
The Paleoclimate Modelling Intercomparison both were endorsed as options for the LGM. of PMIP's many objectives was to encour-
Project (PMIP) was launched 30 years ago age data syntheses for the two paleoclimate
at an international North Atlantic Treaty For the mid-Holocene experiment, the periods that would enable model–data
Organization (NATO; nato.int) workshop choice of surface boundary conditions was comparisons. A model–data sub-committee
in Saclay, France, in 1991. Its main objec- easier since SSTs are nearer to present-day organized this work, led by Sandy Harrison,
tives were to investigate the mechanisms conditions. In this case, to help isolate the Joël Guiot and Pat Bartlein. At a workshop
of climate change and to evaluate model impact of orbital changes, the SSTs were in Aussois, France, in 1993, participants dis-
capabilities in simulating past climates. At simply prescribed to be the same as in the cussed both inverse and forward approaches
this workshop, the first PMIP experiments Atmospheric Modelling Intercomparison for evaluating models using paleoclimate
were conceived, which focused on two very Project (AMIP) experiments. In the few years observations. These discussions highlighted
different climatic periods: the Last Glacial following the first workshop, consensus the importance of fostering close interac-
Maximum (LGM; 21,000 years before present was reached concerning the LGM ice-sheet tions between the two communities.
(BP)) with extremely cold conditions and boundary conditions; the Peltier ice-sheet
the mid-Holocene (6,000 years BP) with an reconstruction was adopted in 1992 follow- By 1994, all experimental conditions were
orbitally-forced change in seasonal cycle. ing discussions at a workshop at Lamont– fixed and described in a foundational paper
Doherty Earth Observatory, USA, organized by Joussaume and Taylor (1995). This first
PMIP built on ground-breaking paleoclimate by Bill Ruddiman. Considerable work was phase of PMIP attracted the participation
experiments performed with earlier models required to iron out details concerning of 18 modeling groups, from Europe, the
and capitalized on well-documented data definition of the insolation forcing for the USA, Canada, Australia, Russia, Korea, and
syntheses for these periods, notably the mid-Holocene and the proper way to com- Japan. Following the lead of its slightly older
extensive work of the Cooperative Holocene pare seasonal cycles from past and present sibling AMIP, PMIP relied on infrastructure
Mapping Project (COHMAP) group led by climates when statistics are based on civil support from the Program for Climate Model
John Kutzbach. In the initial phase of the calendar months, but climate responds to Diagnosis & Intercomparison (PCMDI;
project, the main features of the selected astronomically-determined seasons. pcmdi.llnl.gov) and its director, Larry Gates.
paleoclimates were investigated by of- In PMIP's first phase, data were collected
fering an experimental protocol where From the beginning, PMIP modelers and and stored at PCMDI in a restricted-access
all models would be run with the same the paleoclimate data community forged a database, as was the practice for AMIP as
prescribed boundary conditions. From strong working relationship, as this had been well. Several papers were published (see
the start, PMIP was endorsed by both the
International Geosphere Biosphere Program Biome distributions
through PAGES and the World Climate biomes
limbiome
at 6k
DTF/S limbiome
biomes at 0k
Research Programme (WCRP; wcrp-climate.
xero
org), first through the Working Group on
steppe
Numerical Experimentation and later by
desert
the Working Group on Coupled Modelling
as part of Climate and Ocean – Variability, 30N 25N 20N 15N 10N 5N EQ
Predictability, and Change (CLIVAR; clivar. Precipitation changes over Africa: PMIP simulations
org). 1000 BMRC
900 CCC2
During its first phase (1991–2001), PMIP CCM3
800 CCSR1
focused only on atmospheric general circu- ARPEGE
lation models (AGCMs), which at that time 700 CSIRO
were the standard climate models. The final 600 ECHAM3
GEN2
design of the PMIP experiments was only 500 GFDL
arrived at following intense discussions that 400 GISS-IIP
LMD4
began with the initial 1991 NATO workshop 300 max LMD5
with a focus on the experimental design for desert/steppe transition MRI2
200 MSU
the LGM. A major point of contention was min
100 UGAMP
whether to constrain the PMIP simulations of
0 UIUC
the LGM by prescribing sea surface tempera- HADAM2
tures (SSTs) as reconstructed by the Climate: -100 YONU
Long range Investigation, Mapping, and -200
Prediction (CLIMAP) project in 1981, with the -300
prospect that the resulting climate would 30N 25N 20N 15N 10N 5N EQ
be more realistic, or to use AGCMs coupled
Figure 1: PMIP1 simulations of annual mean precipitation changes (6 kyr BP minus present; mm/year) in the
to slab oceans, allowing for some surface African monsoon region (20ºW–30ºE). (A) Biome distribution (desert, steppe, xerophytic and dry tropical forest/
ocean interactions, but with ocean horizon- savannah; DTF/S) as a function of latitude for 6 kyr BP (green triangles) and present-day (red circles). The limit of
tal heat transport fixed as present-day and, desert-steppe at 6 kyr BP around 23ºN (blue vertical dashed line) provides a range of precipitation excess above
therefore, inconsistent with paleoclimate model results shown in (B). (B) Model results with hatched lines showing estimated upper and lower bounds
data. Each of these approaches had its excess precipitation needed to support grasslands based on present climatic limits. Figure reproduced from
McAvaney et al. (2001); redrawn from Joussaume et al. (1999).
PAGES MAGAZINE ∙ VOLUME 29 ∙ NO 2 ∙ November 2021 CC-BY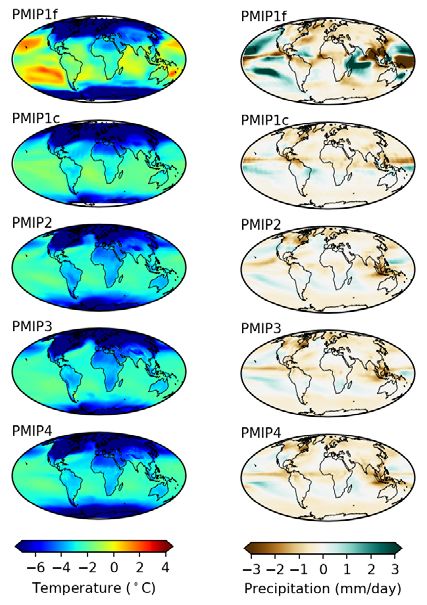
SCIENCE HIGHLIGHTS: Paleoclimate Modelling Intercomparison Project 65
Model–data comparison at the LGM (30ºN − 30ºS)
(LGM − PD) temperature differences
land pollen America (90ºW−40ºW)
Africa (2ºW−50ºE)
6 Indonesia, Pacific (105ºE−109ºW)
nb data
4
Indian Ocean
2
Atlantic Ocean
0 Pacific Ocean
−9 −8 −7 −6 −5 −4 −3 −2 −1 0
cooling over land (ºC)
nb data
−9 −8 −7 −6 −5 −4 −3 −2 −1 0 0 5 10 15 20
0 0
2−5
8 6,7 1
−1 −1
1,2
cooling over oceans
3
4
5 1 2
ocean alkenones
−2 −2
6 −3 −3
8
7 prescribed SSTs
computed SSTs −4 −4
EMIC models
−5 −5
Figure 2: Annual mean simulated tropical cooling over ocean and land from PMIP1 LGM simulations, compared to estimates of terrestrial cooling from pollen (Farrera et al.
1999) and from ocean SSTs estimated from alkenones (Rosell-Melé et al. 1998). Figure reproduced from McAvaney et al. (2001; adapted from Pinot et al. 1999).
pmip1.lsce.ipsl.fr), and the major find- by vegetation simulations using PMIP out- let alone vibrant, 30 years later. During this
ings were emphasized in the third IPCC puts (Harrison et al. 1998). This is a modeling time, younger scientists have brought new
Assessment Report (McAvaney et al. 2001). problem that continues to challenge state- energy and ideas to the project, and have re-
Two key PMIP figures are reproduced here in of-the-art models. invigorated the quest to understand paleo-
Figures 1 and 2. climates. We believe that PMIP will continue
The model–data comparisons over Europe to attract a community of researchers who
PMIP results became the focus of several led to the establishment of new bioclimatic enjoy working together and who will seize
community workshops that included both variables such as temperature of the coldest opportunities to expand our knowledge of
paleoclimate modelers and specialists in month and growing degree-days, rather our climate system by looking at the past.
paleoclimate data. At the first workshop in than the commonly-used January and July
1995 in Collonges-la-Rouge, France, initial temperature estimates (Cheddadi et al. AFFILIATIONS
analyses were shared. Then in 1997 at San 1996). These more robust variables enhance 1
Laboratoire des Sciences du Climat et de
Damiano, USA, subprojects were organized confidence in model–data comparisons l'Environnement, LSCE/IPSL, UMR CEA-CNRS-UVSQ,
and papers planned. Subsequently, in 1999 (Masson et al. 1999). Université Paris-Saclay, Gif sur Yvette, France
at La Huardière, Canada, a synthesis of the 2
PCMDI, Lawrence Livermore National Laboratory,
results was prepared and then published For the LGM, models simulated a global Livermore, CA, USA
in a WCRP special report (Braconnot 2000). cooling of about 4ºC when forced with CONTACT
These workshops have been essential to CLIMAP SST reconstructions, whereas Sylvie Joussaume: sylvie.joussaume@lsce.ipsl.fr
PMIP's success. They were instrumental in AGCMs coupled to slab oceans produced
developing the close working relationship a global cooling between 2º and 6ºC. REFERENCES
between modelers and data specialists that Following the issue raised by Rind and Braconnot P. (Ed; 2000) Paleoclimate Modelling
led to a better appreciation of the limita- Peteet (1985) about the underestimation of Intercomparison Project: proceedings of the third
PMIP Workshop. WCRP-111, WMO/TD-1007, 271
tions of both models and observations and the simulated terrestrial tropical cooling at
pp.
to development of improved understand- LGM, a detailed model–data comparison
ing of the climate system. The PMIP work- study was conducted for the tropics that Cheddadi R et al. (1996) Clim Dyn 13: 1-9
shops have all been intensive, interactive, relied on a new data synthesis effort fos- Farrera I et al. (1999) Clim Dyn 15: 823-856
and lively; and we will not forget the "PMIP tered by PMIP (Farrera et al. 1999). In the Harrison SP et al. (1998) J Clim 11: 2721-2742
song" introduced in the Collonges-la-Rouge tropics, models forced by the relatively warm Jolly D et al. (1998) J Biogeogr 25: 1007-1027
workshop (pmip1.lsce.ipsl.fr/goodies/song. CLIMAP SSTs confirmed an underestimated
Joussaume S, Taylor KE (1995) Status of the paleoclimate
html), and revised in San Damiano; and the terrestrial cooling, whereas models that modeling intercomparison project, Proceedings
dancing and revelry in La Huardière! computed SSTs obtained estimates in better of the first international AMIP scientific conference,
agreement with the observed tropical cool- WCRP Report, 425-430
Main highlights from the first PMIP phase ing (Fig. 2), compensating for their relatively Joussaume S et al. (1999) Geophys Res Lett 26: 859-862
In what became known as the "Big Picture weak cooling over land with excessive ocean
Kageyama M et al. (2001) Clim Dyn 17: 23-43
Paper", Joussaume et al. (1999) showed that cooling (Pinot et al. 1999). In addition, an ex-
as a result of increased summer insolation, tensive comparison over Europe (Kageyama Masson V et al. (1999) Clim Dyn 15: 163-182
all the models simulated an increase in the et al. 2001) concluded that according to pol- McAvaney BJ et al. (2001) In: J. Houghton (Ed) Climate
summer monsoon precipitation over Africa len data (Peyron et al. 1998), models tended Change 2001: The Scientific Basis. Cambridge
and Asia during the mid-Holocene (Fig. 1). to underestimate winter cooling, at least University Press, 471-523
A quantitative comparison over Africa using over western Europe. Peyron O et al. (1998) Quat Res 49: 183-196
results from BIOME 6000 (Jolly et al. 1998) Pinot S et al. (1999) Clim Dyn 15: 857-874
showed that all the models underestimated Looking forward Rind D, Peteet D (1985) Quat Sci Rev 24: 1-22
the northward displacement of the desert- When launching PMIP in 1991, we did not
Rosell-Melé A (1998) EOS 79: 393-394
steppe transition, which was also confirmed expect the project would still be relevant,
CC-BY PAGES MAGAZINE ∙ VOLUME 29 ∙ NO 2 ∙ November 2021
66 SCIENCE HIGHLIGHTS: Paleoclimate Modelling Intercomparison Project
doi.org/10.22498/pages.29.2.66
PMIP key dates and achievements
over the last 30 years
Pascale Braconnot1, M. Kageyama1, S.P. Harrison2, B.L. Otto-Bliesner3, A. Abe-Ouchi4, M. Willé1, J.-Y. Peterschmitt1
and N. Caud1
Over the last 30 years, PMIP has made significant progress in the development of Earth system models, climate
reconstructions, and model–data comparisons. It has contributed greatly to our understanding of climate sensitivity,
ocean circulation and abrupt events, the hydrological cycle, the linkages between climate and ecosystems, and
climate variability.
From infancy to a mature project Evolution of the context and groups to sample uncertainties in boundary
During the last 30 years, the Paleoclimate scientific questions conditions.
Modelling Intercomparison Project (PMIP) PMIP1 highlighted robust model responses
has fostered synchronized model simula- to external forcings for the mid-Holocene New periods and questions have been
tions, climate reconstructions, and model- and the Last Glacial Maximum (LGM) and dis- included progressively in PMIP to address
model and model–data comparisons for key cussed model uncertainties. The number of a broader range of external forcings and
climate periods in the past (Fig. 1). The major independent climate indicators from differ- climate issues. These choices were dis-
objectives of the project developed for the ent natural archives has increased with time, cussed and made at the regular PMIP meet-
first phase of PMIP are still valid today (see allowing for tests of the modeled response ings every 2–3 years (Fig. 1). A challenge
Joussaume and Taylor, this issue): to under- to the forcings of the land, ocean, and ice has been to foster collaboration around key
stand the mechanisms of climate change, sheets (see Bartlein et al. and Jonkers et periods, with standardized simulations and
test models in a climate context different al. this issue). The role of carbon cycle and associated databases, while also acting as a
from modern, and define evaluation criteria other feedbacks has been considered network to share new results and sensitivity
that are relevant to assess the credibility since PMIP2. PMIP3 introduced a focus on experiments that improve our understand-
of future climate projections. However, the analyses of interannual-to-centennial climate ing of major climate feedbacks. The early
project has refined these objectives in four variability (Braconnot et al. 2012). New meth- Holocene and last glacial inception were
successive phases (Fig. 1 and 2). odologies for model–data comparison have included in PMIP2 to address questions
been continuously developed, from simple about water cycle feedback from the ocean
The PMIP niche is to produce paleoclimate visual comparisons, to application of specific and vegetation, and the role of snow and
simulations with the same general circulation metrics, and finally to the use of forward ice sheets (PMIP 2000). Multi-model results
models (GCMs) used for future climate pro- modeling of the various climate indicators were developed for the last interglacial in
jections. During PMIP's lifetime, these mod- such as water or carbon isotopes. The impor- PMIP3. However, a common protocol for the
els have evolved from atmosphere-only to tance of model–data comparison meant last interglacial was only proposed in PMIP4
Earth system models (Fig. 1), initially through that there had to be a balance between the (Otto-Bliesner et al. 2017). Pre-Quaternary
the inclusion of either ocean or vegetation use of a strict experiment protocol to be climates have also been included since
couplings with the atmosphere. The choice able to understand model differences and PMIP3 because of their ability to provide
of the complexity of the model used, such as more flexible protocols allowing different constraints on climate sensitivity (Haywood
the inclusion of the carbon cycle or interac-
tive aerosols, still varies across modeling
groups. However, currently, the main focus PMIP1 PMIP2 PMIP3 PMIP4
Periods
is on full integration of the different com-
ponents of the system. PMIP has provided
a way both to test different climate feed- Forcings
backs related to land surface, ocean, or ice
sheets, and to improve understanding of the
Model complexity
relationship between climate and variations
in terrestrial and marine biogeochemistry.
Because of its unique focus, PMIP has been 2014: Namur, Belgium
endorsed from the beginning by PAGES and
(Michel Crucifix)
Beer, Hostellerie
Meetings
the World Climate Research Programme
Crucifix et al. (2014)
1999: La Huardière, Canada 2012: Crew Hall, UK
(WCRP) through its core project Climate (Anne de Vernal)
Canoe, Dance
(Alan Haywood)
Country sports, Dance
Variability (CLIVAR) and subsequently PMIP (2000) Crucifix et al. (2012)
2020: Nanjing, China
the Working Group on Coupled Models 2005: Presqu’île de Giens, France 2010: Kyoto, Japan
1997: San Damiano, USA and virtually
(Pascale Braconnot) (Ayako Abe-Ouchi)
(Karl Taylor) (Jian Liu)
(WGCM). These endorsements have allowed Big picture, PMIP song Porquerolles, Food
Crucifix et al. (2005)
Food discovery, Temples
Haywood et al. (2011); Schmittner et al. (2011)
Padlet, Chinese hub
Liu et al. (2021)
PMIP to maintain strong connections to the 1995: Collonges-la-Rouge, France
2002: Cambridge, UK 2008: Estes Park, USA 2017: Stockholm, Sweden
modeling and climate reconstruction com- (Sylvie Joussaume)
(Paul Valdes)
Punting
(Bette Otto-Bliesner)
Barbecue, Beers
(Qiong Zhang)
Nobel museum
munities throughout the last 30 years.
Caves, Volley
Harrison et al. (2002) Otto-Bliesner et al. (2009a; 2009b) Zhang et al. (2017)
PMIP related
PMIP encourages growth in its activities
while maintaining a focus on a limited
number of key questions. It plays a key role
by providing results in the open database 1995 2000 2005 2010 2015 2020
for global climate simulations supported Joussaume and Taylor (1995) Braconnot et al. (2003) Braconnot et al. (2007) Braconnotet al. (2010)
Braconnot et al. (2012) Kageyama et al. (2018)
by WCRP (Peterschmitt et al. 2018). These Figure 1: PMIP phases highlighting major meetings (date, location, host, activities, and meeting report), together
results have been used for studies well be- with the key periods, external forcings, and model complexity represented with small infographics either as
yond those originally envisaged by people core PMIP activities (green), small groups (orange), or as part of the wider network (blue). MH = Mid-Holocene,
outside the main PMIP community, including LGM = Last Glacial Maximum, EH = Early Holocene, LM = Last Millennium, PLIO = Pliocene, DEEP = deep time,
for impact studies, or to assess changes in LIG = Last Interglacial, and LD = Last Deglaciation. When a number is included (e.g. "115ka"), it refers to the
biodiversity or ecological niches. exact period as discussed during PMIP meetings.
PAGES MAGAZINE ∙ VOLUME 29 ∙ NO 2 ∙ November 2021 CC-BY
SCIENCE HIGHLIGHTS: Paleoclimate Modelling Intercomparison Project 67
In conclusion
Mid Holocene : 6 – 0 kyr BP LGM 21 – 0 kyr BP During the last 30 years PMIP has provided
Biomes 0 kyr BP a scientific basis to define the level of model
Biomes 6 kyr BP
MARGO complexity needed to understand climate
Bartlein
change processes and interactions be-
tween the different timescales fully. This is
PMIP4
one of the reasons why PMIP results serve
as reference in IPCC assessment reports
(Kageyama et al. this issue, p. 68). Little by
little, paleoclimate simulations are no longer
being considered just to check confidence in
the models, but also as a necessary step for
PMIP3
Precipitation anomalies (mm/yr)
identifying model deficiencies and contrib-
Temperature anomalies
uting to the improvement of the physical
over land – data sites
and biogeochemical content of the models.
Paleoclimate simulations represent an es-
sential element in understanding climatic
PMIP2 events with a high impact on ecosystems or
societies.
AFFILIATIONS
1
Laboratoire des Sciences du Climat et de
l'Environnement, LSCE/IPSL, UMR CEA-CNRS-UVSQ,
Université Paris-Saclay, Gif sur Yvette, France
PMIP1
2
School of Archaeology, Geography and
Environmental Science (SAGES), University of
Reading, UK
3
National Center for Atmospheric Research, Boulder,
Temperature anomalies CO, USA
over the ocean – data sites 4
Atmosphere and Ocean Research Institute, The
University of Tokyo, Japan
Figure 2: Iconic PMIP graphics to show how well models represent the increase and northward extent of the
mid-Holocene West African monsoon and the Last Glacial Maximum land–sea contrast through the different CONTACT
phases of PMIP. (Top) Summary of the data constraints. Temperature anomalies compiled from MARGO Project Pascale Braconnot: pascale.braconnot@lsce.ipsl.fr
Members (2009) and Bartlein et al. (2011); biome reconstruction from Joussaume et al. (1999).
REFERENCES
et al. 2010). The Last Millennium in PMIP is now produce more consistent representa- Bartlein PJ et al. (2011) Clim Dyn 37: 775-802
associated with the PAGES 2k Network and tions of increased precipitation between Braconnot P et al. (2003) CLIVAR Exchanges 28: 19-20
the need to improve pre-industrial refer- 6°N and 16°N, but continue to struggle to Braconnot P et al. (2007) Clim Past 3: 261-277
ence climates (Schmidt et al. 2011). Several reproduce the large observed changes from Braconnot P et al. (2010) CLIVAR Exchanges 56: 15-19
fresh water flux experiments have also been 16°N to 30°N.
Braconnot P et al. (2012) Nat Clim Chang 2: 417-424
regularly discussed, either for the Holocene
8.2 kyr event (see Gregoire and Morrill, For the LGM, PMIP results have consolidated Brierley CM et al. (2020) Clim Past 16: 1847-1872
this issue) or complementary experiments the understanding of the ratio between Crucifix M et al. (2005) Eos 86: 264-264
around the LGM. Recently the deglaciation temperature over land and over the ocean, Crucifix M et al. (2012) Eos 93: 539-539
has become one of the major flagships for which is relevant for discussions about future Crucifix M et al. (2014) PAGES Mag 22: 103
PMIP simulations (Ivanovic et al. 2016). climate (Stocker et al. 2013). Independent
Harrison SP et al. (2002) Eos 83: 447-447
reconstructions over land and ocean support
Haywood AM et al. (2010) Geosci Model Dev 3: 227-242
The current organization into eight working this ratio, and can be used to define which
groups (pmip.lsce.ipsl.fr/working_groups) of the results better fits with past conditions. Haywood AM et al. (2011) Eos 92: 180-180
favors exchanges on the different climatic The current generation of climate models Ivanovic RF et al. (2016) Geosci Model Dev 9: 2563-2587
periods, transverse analyses for model– and new proxy reconstructions produce a Joussaume S, Taylor KE (1995) Status of the paleoclimate
data comparisons, and cross-period large range of results, however, suggesting modeling intercomparison project, Proceedings
analyses. Five PMIP experiments have been that the debate on the LGM land–sea ratio of the first international AMIP scientific conference,
included in CMIP6 (Fig. 1). More details has not yet been resolved (Kageyama et al. WCRP Report, 425-430
of the PMIP journey are available online: 2021). Joussaume S et al. (1999) Geophys Res Lett 26: 859-862
www.tiki-toki.com/timeline/entry/1566548/ Kageyama M et al. (2018) Geosci Model Dev 11:
HISTORY-OF-PMIP Paleoclimate modeling and systematic 1033-1057
benchmarking within PMIP have demon- Kageyama M et al. (2021) Clim Past 17: 1065-1089
What do PMIP iconic figures tell us strated that feedbacks from ocean and
Liu J et al. (2021) PAGES Mag 29: 57
about advances in modeling? vegetation are needed to reproduce climate
The two PMIP iconic figures presented changes at global or regional scales. PMIP MARGO Project Members (2009) Nat Geosci 2: 127-132
in Joussaume and Taylor (this issue) are has also demonstrated that models that Otto-Bliesner BL et al. (2009a) Eos 90: 93-93
reproduced here to provide an overview of produce good simulations of present-day Otto-Bliesner BL et al. (2009b) PAGES news 17: 42-43
how simulated changes in mid-Holocene climate do not necessarily have good skill in Otto-Bliesner BL et al. (2017) Geosci Model Dev 10:
precipitation or in LGM land–sea contrast simulating past changes. This raises ques- 3979-4003
has been represented with increasing tions about how to pre-select models only Peterschmitt J-Y et al. (2018) PAGES Mag 26: 60-61
model complexity and resolution through- looking at modern conditions when consid-
Schmidt GA et al. (2011) Geosci Model Dev 4: 33-45
out the four phases of PMIP (Fig. 2). Figure ering future climate projections, for example
2 illustrates the 30-year quest to simulate for impact studies. The current phase of Schmittner A et al. (2011) PAGES news 19: 83-84
sufficient precipitation in the Sahel-Sahara PMIP should provide a wider range of past Stocker TF at al. (Eds; 2013) Climate Change 2013: The
to support the reconstructed mid-Holocene constraints from the combination of the Physical Science Basis. Cambridge University
vegetation cover, which has led to improved different climate periods to isolate missing Press, 1535 pp
understanding of the role of global and mechanisms or the impact of model biases Zhang Q et al. (2017) PAGES Mag 25: 160
regional feedbacks (soil, vegetation, albedo, on the seasonal, annual, or interannual-to-
etc.; Brierley et al. 2020). There has been a centennial scale characteristics of climate
shift between PMIP phases such that models changes.
CC-BY PAGES MAGAZINE ∙ VOLUME 29 ∙ NO 2 ∙ November 2021
68                    SCIENCE HIGHLIGHTS: Paleoclimate Modelling Intercomparison Project
                                                                                                                             doi.org/10.22498/pages.29.2.68

     The contributions of PMIP to the
     IPCC assessment reports
     Masa Kageyama1, A. Abe-Ouchi2, J. Annan3, P. Braconnot1, C. Brierley4, J. Fidel Gonzalez-Rouco5, J. Hargreaves3,
     S.P. Harrison6, S. Joussaume1, D.J. Lunt7, B. Otto-Bliesner8 and M. Rojas Corradi9

     PMIP contributed to the Intergovernmental Panel on Climate Change (IPCC) Assessment Reports (ARs) by placing
     current climate change into a wider context, evaluating climate model performance in very different climatic states,
     and constraining climate sensitivity based on paleoclimates.
     Before PMIP                                     Also in the TAR, PMIP results for the Last          time, some simulations of the last millennium
     Back in 1990 when the First Assessment          Glacial Maximum (LGM) are in terms of the           from AOGCMs and Earth system models of
     Report (FAR) of the Intergovernmental Panel     potential link between the global mean cool-        intermediate complexity, which announces
     for Climate Change (IPCC; Houghton et al.       ing and climate sensitivity, and an estimate        subsequent coordinated work within PMIP.
     1990) was published, PMIP did not exist.        of the LGM radiative forcing is given. The          The AR4 quantifies the estimated global
     However, in its fourth chapter, entitled        text then evaluates model results in compari-       LGM cooling of 4–7°C, which makes this pe-
     "Validation of climate models", the report      son to new reconstructions for the tropics          riod very relevant to the warming projected
     drew on the pioneering results from CLIMAP      (Joussaume and Taylor, this issue, Fig. 2) and      for 2100. PMIP results are also highlighted in
     Project Members (1981), who produced the        the extratropics. The cooling over the trop-        Chapter 9 in relation to future climate, and
     first set of boundary conditions for LGM        ics was a highly debated topic, in particular       contribute to the estimated ranges of equi-
     experiments, and COHMAP Members (1988),         because the cooling over land was found to          librium climate sensitivity in Table 9.3.
     who produced paleodata syntheses and            be much larger than over the oceans. This
     model simulations for key periods between       characteristic could only partly be explained       PMIP in the Fifth Assessment
     the LGM and present. It stated that "studies    by the "land–sea contrast" later found in           Report: multi-period analyses
     of paleoclimate changes are an important        observations of current climate change and          The Fifth Assessment Report (AR5; Stocker
     element in climate model validation for         projections for the future.                         et al. 2013) contains the largest number
     two reasons: (1) they improve our physical                                                          of figures showing PMIP results; these
     understanding of the causes and mecha-          At the time of the third assessment, the main       appear in chapters 5 ("Information from
     nisms of large climatic changes so that         conclusion was that the CLIMAP reconstruc-          paleoclimate archives"), 9 ("Evaluation of
     we can improve the representation of the        tions were probably too warm over the trop-         climate models"), and 10 ("Detection and
     appropriate processes in the models, and        ics. Results from slab-ocean models were            attribution of climate change"). The results
     (2) they provide unique data sets for model     in better agreement with reconstructions,           are based on the PMIP3 mid-Holocene,
     validation."                                    despite the fact they used present-day me-          LGM, and last millennium simulations, and
                                                     ridional heat transport. The TAR also points        the chosen figures show updated process
     This view has guided the contribution of        to a good agreement between models and              understanding for the LGM and data–model
     PMIP results to subsequent assessment re-       data over Europe, except for winter for which       comparisons for the mid-Holocene and the
     ports. The creation of PMIP was announced       the models underestimate the reconstructed          Last Interglacial. For the last millennium, AR5
     in the Second Assessment Report (Houghton       cooling. All these themes would be ad-              highlights the large increase in the number
     et al. 1996) in Chapter 5 ("Climate models      dressed in subsequent reports.                      of available AOGCM simulations relative to
     – evaluation"): "The earlier ice age SST (sea                                                       AR4. Furthermore, the consistency of these
     surface temperature) data sets […] are now      PMIP in the Fourth Assessment Report:               simulations with reconstructions and exter-
     being revised for use in the newly organized    addition of the Last Interglacial                   nal forcing changes is evaluated, showing
     Paleoclimate Modelling Intercomparison          In the Fourth Assessment report (AR4;               our understanding of the processes involved
     Project (PMIP) which is focusing on simula-     Solomon et al. 2007), PMIP disappears from          in the unprecedented present warming at
     tions for the Last Glacial Maximum and for      the evaluation chapter (apart from a citation       hemispheric and continental scales.
     6000 years BP using atmospheric models          on modeling abrupt climate change) and
     with both fixed SST and mixed-layer oceans".    appears in Chapter 6, a new chapter entirely        A novelty in AR5 is that results (specifically
                                                     dedicated to paleoclimate, and in Chapter 9,        regarding polar amplification) are shown
     PMIP in the Third Assessment Report:            on "Understanding and Attributing Climate           from multiple past periods (including for
     mid-Holocene and Last Glacial Maximum           Change". Figure 6.5 shows components of             the mid-Pliocene Warm Period and the
     PMIP studies on both topics outlined in         the radiative forcing for the LGM, together         Eocene Climate Optimum), together with
     the FAR, model evaluation and process           with the simulated cooling in terms of sea          an idealized future scenario (2xCO2) in
     understanding, have been included in            surface temperatures and the relationships          the same figure. Another new topic is the
     every subsequent assessment report of the       between global and regional temperature             analysis of changes of ENSO variability for
     IPCC. In the Third Assessment Report (TAR;      changes from the LGM to pre-industrial. This        different periods. Several lines of evidence,
     Houghton et al. 2001), PMIP results can be      figure thereby highlights processes leading         including paleoclimate reconstructions and
     found in Chapter 8 ("Model evaluation"). The    to the temperature change, and simultane-           simulations are also combined to assess
     iconic figure for the mid-Holocene African      ously provides an evaluation of the results.        Equilibrium Climate Sensitivity in a compre-
     monsoon (Joussaume and Taylor, this issue;      The conclusion is that AOGCMs "are able             hensive section on this topic in Chapter 10.
     Fig. 1, adapted from Joussaume et al. 1999)     to simulate the broad-scale spatial patterns        Model evaluation (Chapter 9) focuses on
     shows that models agree with precipitation      of regional climate change recorded by              the last millennium variability, large-scale
     reconstructions in simulating an increased      paleodata in response to the radiative forc-        and regional features of the LGM and mid-
     monsoon, but that they underestimate the        ing and continental ice sheets of the LGM,          Holocene surface climate, as well as LGM
     reconstructed northward displacement of         and thus indicate that they adequately rep-         large-scale deep ocean gradients in tem-
     the monsoon area. The text states that this     resent the primary feedbacks that determine         perature and salinity. Model performance
     is also the case for the northward displace-    the climate sensitivity of this past climate        is also quantified in terms of metrics, similar
     ment of the Arctic tree line, and highlights    state to these changes."                            to the approach used for evaluating pres-
     the inconsistency between the simulated                                                             ent climate in comparison to observations.
     drier Eurasia and reconstructed wetter          The AR4 also introduces AOGCM simula-               However, in the case of PMIP, the metrics are
     climate there.                                  tions of the Last Interglacial and, for the first   based on bioclimatic variables.

                                             PAGES MAGAZINE ∙ VOLUME 29 ∙ NO 2 ∙ November 2021                                                     CC-BY
SCIENCE HIGHLIGHTS: Paleoclimate Modelling Intercomparison Project 69
IPCC PMIP references
AR1 (Houghton Citation of COHMAP results and recognition of paleoclimate studies useful for the assessment
et al. 1990)
AR2 (Houghton Chapter 5: "Climate models – evaluation" mentions PMIP's goals and focus on the mid-Holocene and LGM
et al. 1996)
AR3 (Houghton Chapter 8: "Model evaluation"
et al. 2001) LGM tropical
MH African
temperatures on
PMIP1 monsoon
land and in oceans
AR4 (Solomon Chapter 6: "Paleoclimate"
et al. 2007)
LGM summary: forcings, response, data-model
PMIP2
comparison for the tropics and Antarctica,
LIG climate and impact on the Greenland ice sheet
Chapter 9: "Understanding and attributing climate change", Table 9.3: constraints on equilibrium climate sensitivity (ECS)
AR5 (Stocker Chapter 5: "Information from paleoclimate archives" Chapter 9: Chapter 10:
et al. 2013) "Evaluation of climate models" "Detection and
ENSO, attribution"
PMIP3
multi-periods MH and LGM
Polar model-data
amplification, LGM vs 2xCO2, comparisons
multi-periods climate sensitivity, Climate sensitivity
feedback analysis estimates
MH model-data LIG data-model
comparisons comparison
LGM oceans
Last Millenium timeseries, global and regional comparisons
Last millenium
variability
AR6 (Masson- Technical summary Chapter 2: "Changing Chapter 3: "Human influence on the Chapter 7: "The Earth's energy
Delmotte et al. state of the climate climate system" budget, climate feedbacks, and
2021) Paleoclimatic indicators system" climate sensitivity"
PMIP4 Large-scale indicators,
Pliocene climate
multi-period
Polar amplification,
multi-periods
Large-scale model-data
comparison Model-data comparisons
(multi-period) for MH and LGM
Global mean
temperature
and ECS
Figure 1: Summary of paleoclimate modeling mentions in the IPCC first and second assessment reports, and of the figures showing PMIP results in subsequent assessment reports.
The Sixth Assessment report: PMIP and their potential for use by policymakers REFERENCES
distributed throughout the report and other stakeholders. COHMAP Members (1988) Science 241: 1043-105
Simpler diagnostics have been chosen for CLIMAP Project Members (1981) Seasonal reconstruction
the Sixth Assessment Report, in which most AFFILIATIONS of the Earth's surface at the last glacial maximum.
chapters are devoted to process under- 1
Laboratoire des Sciences du Climat et de
Geol Soc Am, Map and Chart Series, pp 1-18
standing and provide a holistic assessment l'Environnement, LSCE/IPSL, UMR CEA-CNRS-UVSQ, Houghton JT et al. (Eds; 1990) Climate Change: the IPCC
of broad topics, including paleoclimatic Université Paris-Saclay, Gif sur Yvette, France Scientific Assessment. Cambridge University
information. PMIP results, and results from 2
Atmosphere and Ocean Research Institute, The Press, 365 pp
paleoclimate studies more generally, are University of Tokyo, Japan Houghton JT et al. (Eds; 1996) Climate Change 1995: The
distributed throughout the report—with fig-
3
BlueSkiesResearch, Settle, UK Science of Climate Change. Cambridge University
4
University College London, UK
ures found in chapters 2 ("Changing state of Press, 572 pp
5
Department of Earth Physics and Astrophysics,
the climate system"), 3 ("Human influence on Houghton JT et al. (Eds; 2001) Climate Change 2001:
Geosciences Institute IGEO (UCM-CSIC),
the climate system"), 7 ("The Earth's energy Complutense University of Madrid, Spain
The Scientific Basis. Cambridge University Press,
budget, climate feedbacks, and climate sen- 6
School of Archaeology, Geography and
881 pp
sitivity"), and 8 ("Water cycle changes"). One Environmental Science (SAGES), University of Joussaume et al. (1999) Geophys Res Lett 26: 859-862
remarkable result is that within the combina- Reading, UK Masson-Delmotte V et al. (Eds; 2021) Climate Change
tion of constraints on equilibrium climate 7
School of Geographical Sciences, University of 2021: The Physical Science Basis. Cambridge
sensitivity, paleoclimatic reconstructions, Bristol, UK University Press, in press
supported by modeling work associated
8
National Center for Atmospheric Research, Boulder,
Solomon S et al. (Eds; 2007) Climate Change 2007: The
CO, USA
with PMIP, were key to reducing the likely Physical Science Basis. Cambridge University
9
Department of Geophysics, University of Chile,
range of equilibrium climate sensitivity from Press, 1007 pp
Santiago, Chile
the AR5 range of 1.5–4.5°C to 2.5–4.0°C. We Stocker TF et al. (Eds; 2013) Climate Change 2013: The
are optimistic that this presentation may im- CONTACT Physical Science Basis. Cambridge University
prove the public's awareness of PMIP results, Masa Kageyama: masa.kageyama@lsce.ipsl.fr Press, 1535 pp
CC-BY PAGES MAGAZINE ∙ VOLUME 29 ∙ NO 2 ∙ November 2021
70                     SCIENCE HIGHLIGHTS: Paleoclimate Modelling Intercomparison Project
                                                                                                                               doi.org/10.22498/pages.29.2.70

     Paleoclimatic data syntheses from the
     terrestrial realm: History and prospects
     Patrick J. Bartlein1 and Thompson Webb III2

     Syntheses of terrestrial paleoclimatic data have a long history, but in the 1980s they rapidly developed into the
     database-in-a-repository form we know today. Over time they have anchored the productive interaction with climate-
     model simulations aimed at both testing the models and explaining patterns in the data.

     One of the basic tasks of PMIP (and its          the results of a GCM simulation with surface        the experiences of several of the participants
     predecessor studies) is the comparison of        boundary conditions provided by the                 in CLIMAP. The project evolved to focus on
     climate-model simulations with paleoenvi-        CLIMAP reconstructions. Although not the            a suite of paleoclimatic simulations at 3-kyr
     ronmental observations. This is motivated        first attempt at paleo simulation, the paper        intervals from the Last Glacial Maximum to
     by the dual objectives of using the observa-     did feature what might be regarded as a             present, and parallel syntheses of terrestrial
     tions to "benchmark" or test the models,         canonical mode of data–model comparison—            and marine data and climate reconstructions
     and using the physically based models to         dots on a map.                                      based on them (e.g. COHMAP Members
     provide mechanistic explanations for the ob-                                                         1988).
     served patterns in the data (Braconnot et al.    Running through the CLIMAP-era discus-
     2012; Harrison et al. 2015). These objectives    sions was the notion that if the goal was com-      By 1980, it became obvious that photocopy
     have in turn motivated the synthesis of pa-      parison of paleo-observations and climate-          and microfiche distribution was not ideal.
     leoenvironmental data from both terrestrial      model simulations, then more paleo-data             Personal computers were becoming widely
     and marine sources and their interpretation.     were surely needed. This began to be real-          available as were connections to the forerun-
     Here we review some of the past terrestrial      ized late in the 1970s. For example, Bernabo        ners of the internet, and this pushed along
     syntheses, and their evolution over time.        and Webb (1977) described mapped                    the electronic distribution of data.
                                                      summaries of Holocene pollen data from
     Early syntheses                                  northeastern North America, and similar             What might be regarded as the first "mod-
     Before the mid-1970s, syntheses of terrestrial   work was underway for Europe (Huntley and           ern" syntheses were a global compilation of
     paleoenvironmental data were available in        Birks 1983). A special issue of Quaternary          the climate of 6000 yr BP and the supporting
     book form, as textbooks (e.g. Brooks 1949;       Research (Hecht et al. 1979) contained the          data (Webb 1985a) and a synthesis of lake-
     Zeuner 1959; Frenzel 1967; and R.F. Flint's      first really comprehensive syntheses of ter-        level status for the COHMAP target times
     evolving sequence: 1947, 1957, and 1971),        restrial paleoclimatic data on a global scale       (Street-Perrott et al. 1989). These studies had
     edited volumes (e.g. Nairn 1961; Wright and      (Peterson et al. 1979; Street and Grove 1979).      both printed and electronic components (on
     Frey 1965), and H.H. Lamb's (1971, 1977)                                                             magnetic tape), and remarkably, the .pdfs of
     two-volume treatise. Although not data-          Peterson et al. (1979) brought together data        the printed reports and the data files are still
     bases in any sense, such publications were       for the LGM, and introduced the notion of           available online. The collections of individual
     the places to go for broad descriptions of       "levels of analysis of the data: I: "raw" pollen,   files are easily recognizable as the elements
     past climates and the observations they were     lake-level, etc. data; II: Level I data converted   of a relational database, and feature such
     based on.                                        to estimates of specific climatic variables;        components of 21st-century databases
                                                      and III: Level II data combined from various        as "rich" site metadata, separation of the
     Also of note from this era was a U.S. National   sources, and interpolated and contoured.            chronologies or age models from the data,
     Academy of Sciences report, Understanding        (From a data-preservation perspective, we           adoption of common vocabularies, harmo-
     Climatic Change, prepared by the U.S.            might now consider a Level 0—the materials          nization of taxa, sediments, depositional
     Committee for the Global Atmospheric             themselves, e.g. Palmer et al. 2021, and Level      environments, and links to publications and
     Research Program (USCGARP 1975). This            IV—coordinated data sets of multiple kinds          to the data originators.
     study included Appendix A, a survey of past      of data linked to one another, Grobe et al.
     climates by Imbrie, Broecker, Mitchell, and      2021). Peterson et al. also addressed chrono-       The databases of that era represented
     Kutzbach, that included some temporal and        logical uncertainties, introducing a three-         snapshots of data available at the time of
     spatial syntheses of climatic variations. Many   level classification (later refined to seven lev-   publication, and, unlike today, there was no
     of the themes and proposals for climate-         els by Webb 1985a), and the question of how         provision for updating. This led to another
     research action discussed there (such as the     much data is enough for valid comparisons.          strategy for database development that is
     joint elaboration of paleoclimatic databases     Street and Grove (1979) described lake-             still in use today: a distinction between a
     and development of simulation models of          status data both temporally and spatially           database (in a repository) and a "research
     both present and past climates) would seem       over the past 30 kyr. The syntheses were not        data set", which may include newer pub-
     familiar today.                                  electronic, and the results exist today only as     lished and unpublished data. The published
                                                      .pdfs of the articles. However, they contained      databases, along with continuously updated
     CLIMAP era                                       data-availability statements, perhaps some          research data sets, supported analysis of the
     CLIMAP (Climate: Long range Investigation,       of the earliest. The 150-page Appendix to           data (e.g. Webb 1985b; Street-Perrott and
     Mapping, and Prediction) was a collaborative     Peterson et al. could be obtained for the           Harrison 1985; COHMAP Members 1988;
     project aimed at reconstructing conditions       price of photocopying (probably ~USD 7.50),         Harrison 1989).
     at the Last Glacial Maximum, in particular       while the Street and Grove data would be
     the distribution of ice sheets, seasonal         furnished on microfiche for USD 2.50.               PMIP era
     sea-surface temperatures, and land-surface                                                           By the mid 1990s, databases of the 1980s
     albedo. The main results of the reconstruc-      COHMAP era                                          were being regularly elaborated and
     tions appeared in Science (CLIMAP Project        COHMAP (Cooperative Holocene Mapping                enlarged, while contributing to the evalua-
     Members 1976), and more fully in an edited       Project; Wright et al. 1993; Wright and             tion of newer sequences of climate-model
     volume (Cline and Hays 1976), and a set of       Bartlein 1993) was an international, inter-         experiments (e.g. Webb and Kutzbach
     maps (CLIMAP Project Members 1981). In a         disciplinary research group that became             1998) and to the first generation of PMIP
     companion paper, Gates (1976) described          organized in the late 1970s, benefiting from        experiments (Joussaume et al. 1999).

                                               PAGES MAGAZINE ∙ VOLUME 29 ∙ NO 2 ∙ November 2021                                                     CC-BY
You can also read