Passing and Pressure Metrics in Ice Hockey - Cheriton School ...
←
→
Page content transcription
If your browser does not render page correctly, please read the page content below
Published in the Artificial Intelligence for Sports Analytics (AISA) Workshop at IJCAI ’21
                                                     Montreal, QC, Canada
                                                       August 21-23, 2021

                                 Passing and Pressure Metrics in Ice Hockey

               David Radke1 , Daniel Radke2 , Tim Brecht1 and Alex Pawelczyk1
               1
                 David R. Cheriton School of Computer Science, University of Waterloo
                    2
                      Department of Computer Science, Universität des Saarlandes
     dtradke@uwaterloo.ca, s8daradk@stud.uni-saarland.de, {brecht, alex.pawelczyk}@uwaterloo.ca

                           Abstract                                 common than goals, but the 2019-2020 average of only 1.7
                                                                    SOG per-player per-game also fails to accurately represent
     Advancements in player tracking technology and                 performance throughout a game, especially a player’s non-
     analytics have revolutionized how professional                 offensive play. In some cases, not including the recorded
     sports are managed, played, and even consumed.                 time-on-ice, there may be no indication from current statis-
     However, these tracking systems have mainly failed             tics that a player actually played in a game despite potentially
     to translate to ice rinks, leaving ice hockey to col-          bringing value to their team in other ways such as defense
     lect relatively coarse and offensively-biased data             or play making. This may lead to misaligned incentives be-
     for player statistics. As a result, current artificial in-     tween players trying to improve their statistics and their team
     telligence (AI) models for player valuation and op-            relying on them to play a less offensive role.
     timal group formation for ice hockey are limited to
     comparing with offensively-biased data, reinforc-                 Success in ice hockey relies on possession of the puck and
     ing these biases in models. The National Hockey                passing between teammates. Despite hundreds of passes ev-
     League (NHL) used a new tracking system in the                 ery game, no current ice hockey statistic records players’
     2020 Stanley Cup Playoffs, and we design a suite of            passing effectiveness. As a result, existing artificial intelli-
     novel analytics that add new insights into the per-            gence (AI) models for player valuation and optimal pairing,
     formance and behaviour of players, groups of play-             or coalition formation have no choice but to compare their
     ers, and teams. We calculate metrics for passing               results or use models that rely on existing offensively-biased
     lanes and player movement, passing effectiveness,              statistics based around goals, assists, and SOG. These statis-
     and pressure which have not previously been possi-             tics which overlook valuable position players who may not
     ble to compute in hockey. We expect our analytics              generate as much offense [Ljung et al., 2018; Luo et al.,
     to support future and more accurate performance                2020]. Utilizing biased data is a known problem in AI and
     and coalition models, and to be of direct interest to          has dramatic impact when deployed. New hockey analytics
     the ice hockey and AI communities.                             that capture other critical aspects of the game are necessary
                                                                    for a deeper understanding of player value and improved AI
                                                                    models.
1   Introduction                                                       Insights from modern analytics across other sports, many
Data analytics in professional sports has revolutionized how        of which depend on high-resolution player tracking sys-
and what data is collected and used, and is expected to reach       tems [Amin, 2018; Baysal and Sahin, 2016; Manafifard et
revenues of $4.5 billion by 2024 [BusinessWire, 2018]. In the       al., 2017], are used to improve player performance, ros-
National Hockey League (NHL), a team can roster 18 skating          ter management, and various AI applications [Lewis, 2003;
players and two goalies per-game, with five skaters and one         Lindström et al., 2020]. Unfortunately, the tracking methods
goalie in the game at a time. Players interchange during play       used in other sports have failed to transfer to ice hockey due
with fatigue and according to the situation, meaning play-          to technical challenges caused by the fast pace, small puck,
ers are often involved in different scenarios all over the ice.     white-coloured ice, and other hardware challenges [Walkters
However, current hockey statistics consider mainly offensive        et al., 2020; Vats et al., 2020; Douglas and Kennedy, 2019].
events like goals, assists, and shots-on-goal (SOG), which oc-      This has led to hockey metrics which infer performance based
cur relatively infrequently. The 2019-2020 NHL season saw           on the aggregation of sparse events instead of tracking actual
an average of 3.02 goals scored per-team per-game [NHL,             behaviour [Hammond, 2011]. Recent technological advance-
2020]; thus, traditional statistics would suggest a maximum         ments have led to the implementation and testing of a new
of nine players (45% of the roster) receive a point for a goal or   player and puck tracking system during the 2020 NHL Stan-
assist (assuming the maximum of two assists for every goal).        ley Cup Playoffs for the first time in real gameplay. While
In addition, a single player accumulating multiple points on        tracking itself is a technological accomplishment, the data
multiple goals means the number of possible players that re-        does not provide general managers, coaches, players, agents,
ceive statistical updates begins to decrease. SOG are more          fans, or AI models with meaningful information.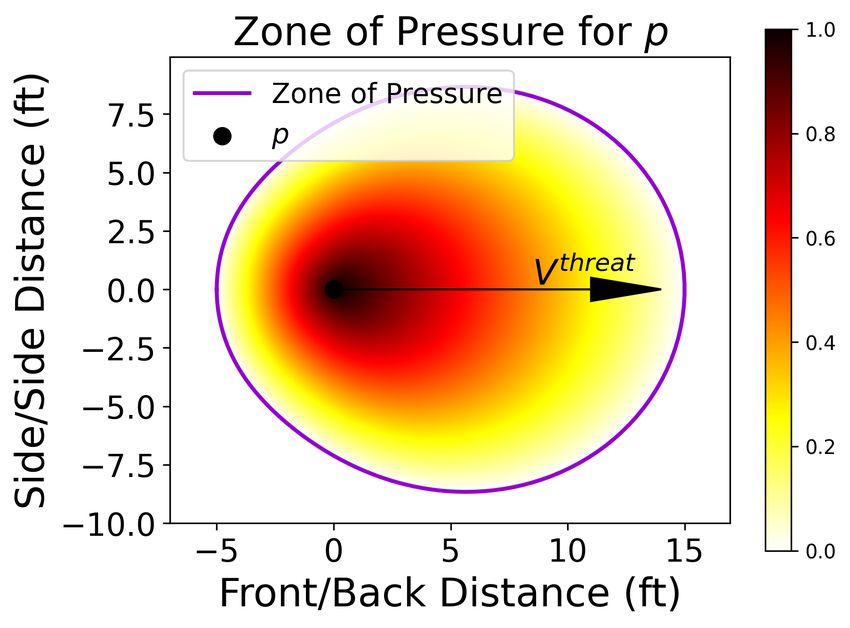
We propose a suite of novel player analytics in hockey de- develop advanced analytics for team and individual perfor-
signed to extract and aggregate insightful information from mance. Several studies leverage player and ball tracking data
the raw tracking data. To the best of our knowledge, we are to analyze passing, quantifying a pass’s disruption to defen-
the first to propose new ice hockey analytics using the re- sive formations [Goes et al., 2019] and the number of out-
cently collected tracking data. Our goal is to represent situ- played opponents [Steiner et al., 2019]. Other work, with
ational player strengths, weaknesses, and trends throughout sufficient tracking data, has used deep learning to evaluate the
the ice surface to offer new perspectives into player perfor- behaviour of players in soccer by predicting the performance
mance and value. We make the following contributions: of “league average” players and teams in simulated scenar-
• We develop new hockey analytics designed to improve ios [Meerhoff et al., 2019; Lindström et al., 2020]. [Kempe et
our understanding of passing, player movement, trends, al., 2018] evaluate tracking data to show that scoring events
and how players respond under pressure. and player performance typically highlighted by human an-
notators can be determined and assessed automatically using
• We propose a new passing lane metric and a metric to de- ridge regression. Similarly in [Fernández, 2019], tracking
termine the degree to which potential pass receivers are data, deep learning-based models and stochastic processes are
open (or available). These metrics can can be adapted to used to calculate the likelihood that a soccer possession ends
other sports that involve passing. in a goal and assign value to passes.
• We utilize real tracking data from the 2020 Stanley Cup
Playoffs to compute our new metrics and discuss initial 3.2 Analytical Insights in Ice Hockey
insights that our analytics provide. Existing research in ice hockey player valuation and an-
The aim of our work is two fold. First, we urge the AI and alytics has mainly utilized event data, typically using the
hockey communities to recognize the need for higher reso- SPORTLOGiQ NHL dataset which records the location, in-
lution hockey analytics that provide insight into how players volved players, and time of events, such as shots, hits, and
perform apart from sparse offensive events. Second, we hope passes [Liu et al., 2018; Silva et al., 2018; Yu et al., 2019].
our work provides new initial benchmarks for player valua- These have been utilized to extract representations of play-
tion and coalition formation AI models in hockey, helping to ers’ abilities through clustering and Markov Decision Pro-
provide a more balanced view of player performance. Es- cesses [Schulte and Zhao, 2017], and deep learning [Liu et
tablishing new metrics are necessary for AI to mature in ice al., 2020; Mehrasa et al., 2018; Guo et al., 2020]. These
hockey; thus, we view our contributions as the first steps in models typically benchmark their results with the offensively-
the new frontier of ice hockey analytics supported by track- biased currently recorded statistics due to a lack of recorded
ing data and towards a large corpus of future work involving ground truth statistics based around other aspects of the game.
game theory [Yan et al., 2020], multi-team systems [Zaccaro Current advanced statistics used by the NHL, such as Corsi
et al., 2020], and cooperative AI [Dafoe et al., 2021]. and Fenwick, have been shown to be good performance indi-
cators for teams [Macdonald, 2012]. Corsi is a plus/minus
2 Background rating of shot attempts (shots for minus shots against) dur-
Ice hockey in the NHL is played on an ice surface that is ing even strength play. Shot attempts include blocked shots,
200 feet long and 85 feet wide (imperial units are used in missed shots, and SOG, which have traditionally been tracked
the NHL). A game consists of two teams competing for three by human annotators [Hammond, 2011]. Fenwick is similar
20-minute periods. Overtime rules vary between the regular to Corsi, but omits blocked shots since this could be a player’s
season and playoffs. A maximum of six players of any com- positive skill. Positive Corsi and Fenwick scores imply the
bination of defense, forwards, and one goalie are allowed on player’s team produced more offense than their opponent dur-
the ice at any time for each team. Penalties remove a player ing the even strength time the player was on the ice.
from the ice surface for two or five minutes depending on the
severity of the infraction, so that the penalized team temporar- 4 Dataset
ily has fewer players in the game. Both teams playing with
the same number of players on the ice is referred to as “even We utilize a proprietary sample dataset made available
strength” and without penalties a team is at “full strength”. through an exclusive contract with Rogers Communica-
The objective of hockey is to score a goal by putting the tions [Rogers, 2021] and Sportsnet [Sportsnet, 2021]. Track-
puck into the opposing team’s net, referred to as the attacking ing data is collected by SportsMEDIA Technology [SMT,
net. The team with the most goals at the end of the game 2021] (a partner of the NHL) with infrared puck and player
wins. Throughout the paper, we refer to a player in possession tracking systems in every NHL arena. Our dataset consists
of or passing the puck as p; we use r to denote a teammate of player and puck tracking data from games five and six of
receiving the pass; and o refers to any player on the opposing the 2020 Stanley Cup Finals between the Tampa Bay Light-
team. ning and the Dallas Stars. Sensors are located inside the puck
and on the right shoulder of every player, sampled at rates
3 Related Work of 60 times per second (60 Hertz) for the puck and 12 Hertz
for players. The location coordinate system is based on the
3.1 Player Tracking in Soccer dimensions of a hockey rink with center-ice being the origin
Over the past decade, advancements in player tracking tech- (0, 0). The x-axis has a range of 100 x 100, and the y-
nology for professional soccer have enabled researchers to axis has a range of 42.5 y 42.5. Our dataset includes
One attempt to analyze passing lanes in soccer uses the
difference in angle between the direct passing lane, the line
pr from p to r, and the most threatening opponent o within
the distance of the pass [Steiner et al., 2019]. While this
method addresses 3) and 4), it fails to satisfy 1) and 2). The
circle-based -skeleton [Kirkpatrick and Radke, 1985] from
graph theory calculates a maximal empty region between two
points, addressing 1), 2), and 4), but point 3) remains unsatis-
fied. Therefore, we propose a novel method using Euclidean
geometry to simultaneously satisfy all four points above.
Our algorithm uses a non-negative real-number parameter
to define the passing lane region from p to r (P L(p, r, )),
shown as the coloured regions in Figure 1. Specifically,
Figure 1: Our method to calculate a passing lane. PA is the value of determines the shape and size of P L(p, r, ). PA, the pass
corresponding with the largest passing lane not containing any o. availability of a potential pass, is the value of with the
In this case, the pass availability PA = 0.6. largest P L(p, r, ) that does not contain any o. For exam-
ple, Figure 1 shows three passing lanes from p to r with
2 {0.6, 1.0, 1.4}. Since no opponents are inside the pass-
pre-labeled events such as hits, shots, passes, faceoffs, and ing lane region when 0.6, PA = 0.6. PAA is the average
puck possession gains and losses. We perform data cleaning value of PA for a player’s completed passes.
and pre-processing for player and puck locations rounded to Our passing lane is asymmetrical, meaning P L(p, r, ) 6=
0.1 second intervals to align with provided event labels. Note P L(r, p, ). The boundary of our passing lane is constructed
that our analytics can be implemented using data from any by two asymmetric circles Cp and Cr , centered at p and r re-
tracking system that provides frequent enough data for the spectively, and the area between the circles contained by two
locations of all players and the puck (or ball). arcs tangent to these circles, seen in Figure 1. This asymme-
try accounts for the directional nature of a pass, p ! r, and
5 Our Analytics the notion that an opponent close to r has more time to react.
Ice hockey is a unique sport due to its speed and dynamic The radii of circles Cp and Cr , Rp and Rr respectively,
game flow, with specific plays and decisions often taking only are calculated using Equations 1 and 2, where d = (p, r),
fractions of a second. Player and puck tracking makes high the euclidean distance from p to r, and t = 0.25 is fixed to
resolution analysis into specific situations possible. In this ensure passing lane asymmetry, scaling the growth of Rr 3
section, we detail our new player analytics with tracking data. times faster than Rp as increases.
A portion of our analytics are averaged over 60-minutes, as Rp = dt (1) Rr = d(1 t) (2)
a game in our dataset extended to double overtime, lasting
almost 90 minutes. Due to space constraints we often re- The arcs come from two larger circles tangent to both Cp
port the mean of each metric, however one could also ana- and Cr with radii Ra = cd , where c is used to scale the
lyze the distribution of values or changes over time to obtain
more detailed information. Our implementation is based in numerator to ensure the centre points of the arcs are real and
ice hockey, however we expect our contributions to translate not imaginary. Specifically, c must be 3 due to our choice
to other multi-player possession sports. of t = 0.25, so we use c = 4. Since Rr grows faster than Rp
as increases, when 2, Cr encompasses Cp and the
5.1 Passing Lanes passing lane is simply Cr .
When a team is at full strength, a passer has four passing The parameter monotonically affects the size and shape
lanes to their teammates, not including the goalie. We de- of P L(p, r, ), so that P L(p, r, 1 ) ✓ P L(p, r, 2 ) for 0
velop a novel method for analyzing passing lanes and record 1 2 . The naı̈ve method of calculating for any p, r, and
two metrics: the passing lane availability average of p’s com- o is to initialize = 0 so that P L(p, r, ) = pr, and subse-
pleted passes PAA; and the average “openness”, or passing quently increment by a small value until the lane contains o.
lane availability, to a player who is a potential receiver r for The most recent value of is then determined as the PA value
their teammate OPA. PAA provides insight into players’ deci- when a pass is made (i.e., the largest not containing o). For
sions, passing skill, and risk, while OPA shows their ability to efficiency, we use a binary search with a stopping resolution
become open for a pass from a teammate. of 0.01 to calculate . Since there are always opponents, we
Calculating a passing lane value has several challenges. guarantee < 1 for each pass and PA < 1. We summarize
Specifically, a proper method should: 1) always assign a pass- our passing lane metrics in Table 1.
ing lane a real number to allow aggregation; 2) incorporate
the area surrounding p and r (i.e., consider the proximity of 5.2 Passing Performance
all opponents); 3) be asymmetric with respect to p and r as A completed pass is when the puck moves from one player,
passes are directed events, and 4) scale with respect to the the passer p, to another player on the same team, the receiver
pass length, as longer passes take more time to reach r, giv- r. A pass that advances the puck beyond an opponent o, over-
ing opponents more time to potentially disrupt the pass. taking them, can leave o in a poor defensive position. Despite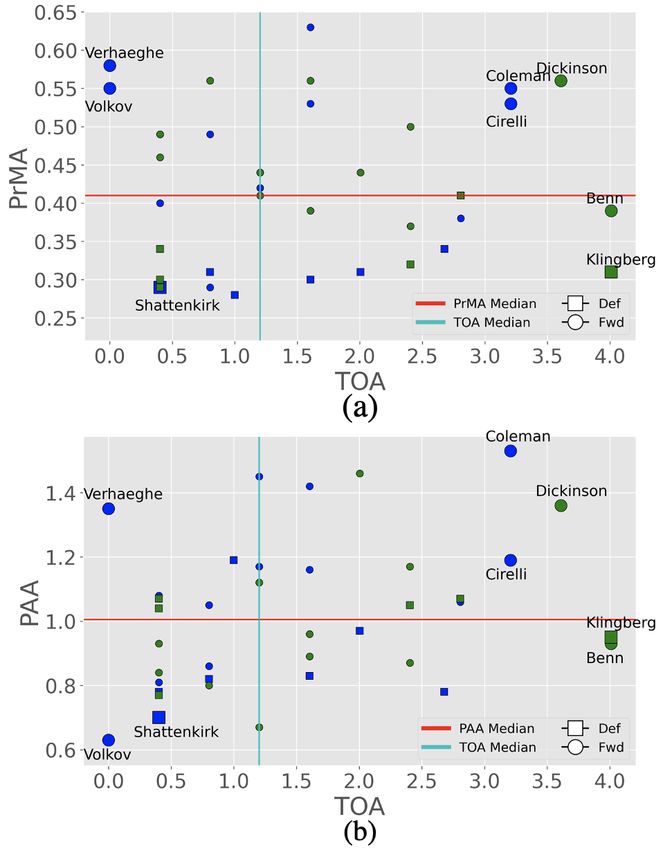
Sym Description Sym Description
PAA Pass availability (value of ) for a player’s com- PASA Successful passes made (average).
pleted passes (average). OVA Overtaken opponents with passes (average).
OPA Openness (value of ) as a receiver for each OVT Overtaken opponents with passes (total).
timestep a teammate has the puck (average). BTT Beaten by opponent’s passes (total).
Table 1: Passing lane analytics for a single player. PPM OVT - BTT
OVT BTT
NPPM count , PPM is normalized by the number of
passes when OVT or BTT are incremented.
hundreds of completed passes every game, there currently ex- TOA Turnovers made (average).
ists no recorded ice hockey metric to understand a player’s
passing with respect to opponent positions. Therefore, we Table 2: Passing analytics for a single player over 60 minutes.
introduce metrics to analyze passing in ice hockey inspired
by overtaking opponents in soccer [Steiner et al., 2019] and
zero-sum games [Dafoe et al., 2020].
We determine a player’s average number of successful
passes over 60 minutes (PASA) and for each pass compute
the ratio of possible opponents overtaken. The sum of those
values is the overtaken ratio total (OVT) and the mean of those
values is the overtaken ratio average (OVA). On the defensive
side, we similarly evenly distribute that ratio of opponents
overtaken across all players that have been beaten with the
pass. This sum of these values is denoted as BTT (beaten to-
tal). Note that OVT and BTT across all players is a zero-sum
game. Inspired by the current plus/minus statistic for goals,
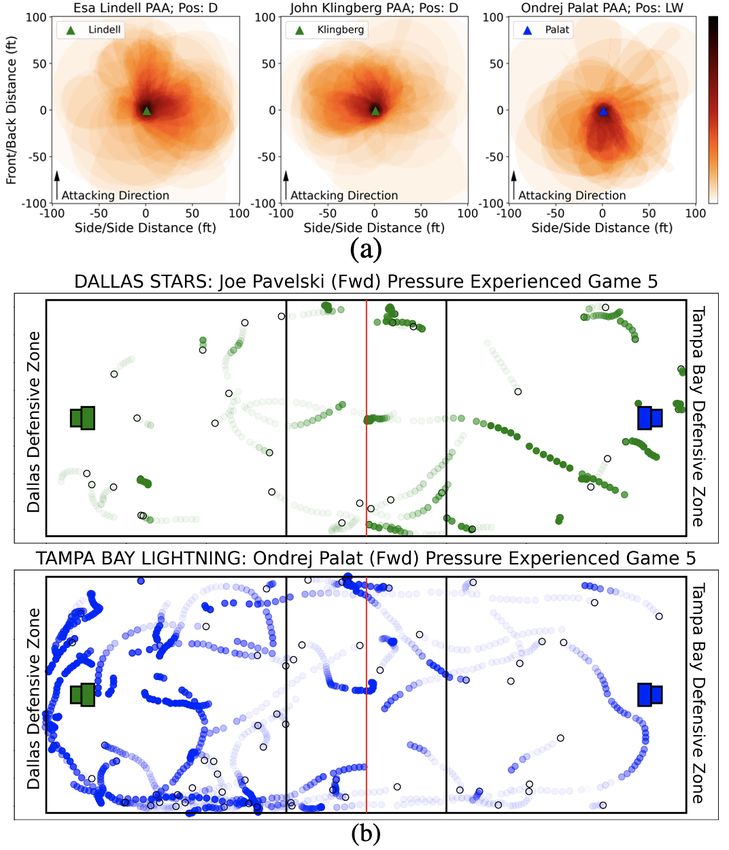
Figure 2: Zone of pressure (ZoP) around p, direction of V threat ,
for each player we calculate the difference between overtak-
and pressure p experiences from o 2 (0, 1) regarding the location of
ing players and being overtaken as “passing plus/minus” PPM o. Darker corresponds with more pressure.
= OVT - BTT. Additionally, we normalize PPM by the number
of times a player overtakes, or is overtaken by an opponent
PPM
(count) for “normalized PPM”, NPPM = count . As is the different scenarios, if they are putting themselves in difficult
case with the scoring plus/minus statistic, we only consider situations and if they are reacting quickly enough. To un-
even-strength play to avoid biases for players given heav- derstand pressure when players are in offensive situations we
ily offensive or defensive roles during penalties. Finally, we calculate the average amount of pressure on the player when
record a player’s average number of turnovers, an immediate they move the puck PrMA and shoot the puck PrSHA. On the
change of possession between teams, over 60 minutes (TOA). defensive side we compute the average pressure each player
Previous work in soccer records the number of oppo- exerts on shooting opponents PrSOA.
nents overtaken by each pass and computes a total from all To calculate pressure we slightly modify the Zone of Pres-
passes [Steiner et al., 2019]. A pass overtaking an oppo- sure (ZoP) used in soccer [Andrienko et al., 2017]. First, we
nent results in o being in poor defensive position, where r decrease the ZoP size since team formations and the playing
receiving the pass is now closer to o’s net. Formally, if surface are smaller in ice hockey. Next, we scale the disper-
NET is the entrance to o’s net, o is considered overtaken if sion of pressure in response to the smaller ZoP and to account
(p, N ET ) > (o, N ET ) and (o, N ET ) > (r, N ET ). for the use of hockey sticks which increasing the reach of o.
Directly translating this metric to ice hockey results in heavily As in [Andrienko et al., 2017], let the direction in front
defensemen-biased metrics since formations are more com- of p be represented by vector V threat (Figure 2). Instead
pact and defensemen typically have more opportunity to over- of V threat pointing up-ice, we define V threat to point to-
take opponents in their offensive direction than forwards. wards the center of the opening to the attacking net. The
Therefore, we scale the resulting values by calculating the pressure boundary is calculated using the same method as
ratio of players overtaken with a pass that were possible to in [Andrienko et al., 2017], resulting in an oval-like structure
overtake. For example, if there are 3 players between p and surrounding p with greater distance along V threat .
the net (not counting the goalie) and the pass overtakes 2 op- The limits of the ZoP directly in front and behind p are
ponents, the computed value is 0.67. In this example, OVT denoted as df ront and dback . We modify dback to be 5 feet,
for p would increase by 0.67, and BTT for the two opponents
overtaken would increase by 0.67 2 = 0.33 each. Our intuition
is the closer the value is to 1, the fewer players remaining for Sym Description
r to beat. We summarize our passing analytics in Table 2. PrMA Pressure when moving the puck (average).
PrSHA Pressure for each SOG by p (average).
5.3 Metrics Indicating Pressure
PrSOA Pressure excerted on a shooting opponent
Exerting pressure on the puck possessor p is a tactic used by while inside the ZoP of o (average).
one or more opponents o to try and force p to make a mistake.
Calculating pressure can help analyze how players respond to Table 3: Pressure analytics for a single player.Player PAA OPA PASA OVA OVT BTT PPM NPPM TOA PrMA PrSHA PrSOA
1 Bogosian* 1.19 0.44 15.00 0.55 4.38 0.98 3.40 0.28 1.00 0.28 0.47 0.57
2 Cernak 0.97 0.45 21.25 0.42 4.56 0.35 4.21 0.27 2.00 0.31 0.00 0.38
3 Sergachev 0.78 0.62 18.04 0.43 4.53 0.79 3.74 0.25 0.40 0.29 0.11 0.48
36 Maroon 1.42 0.36 4.01 0.67 0.27 2.27 -2.00 -0.14 1.60 0.63 0.00 0.56
37 Volkov* 0.63 0.44 3.00 0.75 0.75 2.60 -1.85 -0.14 0.00 0.55 0.00 0.48
38 Benn 0.93 0.44 9.62 0.40 0.64 6.39 -5.75 -0.15 4.01 0.39 0.76 0.43
Table 4: Analytic results, top three and bottom three players (excluding goalies) ordered by normalized passing plus/minus (NPPM) in
decreasing order. DAL = green, TBL = blue. (* = played one game)
equivalent to about the length of a hockey stick so that o can
reach p when they are directly behind p. Keeping the same
scale as in [Andrienko et al., 2017], we make df ront three
times larger (15 feet). We also simplify and alter their for-
mula for pressure from o onto p to scale linearly, so that the
(p,o)
pressure o exerts on p inside of the ZoP, o(p) = 1 (p,z) ,
where z is the point on the ZoP boundary in the direction of o.
This dispersion is less dramatic than in soccer because hockey
sticks increase the reach of o. The total pressure
Pexperienced
by p with O pressers is calculated by Pr(p) = o o(p). Fig-
ure 2 shows pressure in relation to p, with darker red corre-
sponding to higher pressure depending on the location of o.
We summarize pressure analytics in Table 3.
6 Evaluation
We compute our analytics using the dataset from two 2020
Stanley Cup Playoff games between the Tampa Bay Light-
ning (TBL) and the Dallas Stars (DAL). Due to space limi-
tations, Table 4 shows only the top and bottom three players
across both games according to decreasing normalized pass-
ing plus/minus (NPPM). The rows are coloured blue for TBL
and green for DAL players.
The top three players in Table 4 are all defensemen for
TBL, and the bottom three are all forwards. All players
display variation in PAA and OPA, with a slight openness
advantage for the defensemen, likely due to their position- Figure 3: Cross-referencing TOA with (a) PrMA and (b) PAA.
ing. Bogosian (TBL), Cernak (TBL), and Sergachev (TBL)
all frequently overtake opponents (high OVT) and do not get
overtaken much (low BTT), leading to relatively high NPPM. demonstrate potentially interesting observations. In Figure
While Volkov (TBL) and Maroon (TBL) have the highest 3a, Coleman (TBL), Cirelli (TBL), and Dickinson (DAL)
OVA, their frequency of passes is low and they are overtaken have both high PrMA and TOA, suggesting they move the
more than other players, leading to low NPPM. Benn (DAL) puck when under a lot of pressure and turn the puck over rel-
averages almost 10 passes over 60 minutes, however he does atively frequently. In contrast, Verhaeghe (TBL) and Volkov
not overtake opponents as often as some other players, seen (TBL) move the puck under similar pressure, but did not turn
through OVA and OVT, while he is also more frequently over- the puck over. Shattenkirk (TBL), Klingberg (DAL), and
taken with BTT = 6.39. Pressure measures are most useful Benn (DAL) move the puck under less pressure than the me-
when compared relative to other players, or cross-referenced dian, however Shattenkirk averages fewer turnovers.
with other metrics as described next. We note that although PAA shows completed passes, it
also captures general trends of risk level for a player’s de-
6.1 Cross-Referencing Metrics cisions (lower values means smaller passing lanes and riskier
We cross-reference a subset of our analytics to show how met- passes). In Figure 3b, we see that Coleman (TBL), Cirelli
ric pairings could potentially lead to further player insights. (TBL), Dickinson (DAL), and Verhaeghe (TBL) have higher
Figure 3a compares the average pressure on puck movement PAA than the dataset median, suggesting they find and/or use
(PrMA) with the average turnovers (TOA) and Figure 3b com- more open passing lanes. Comparing these metrics with aver-
pares the pass availability average (PAA) with the average age turnovers (TOA), we see that Verhaeghe has a much lower
turnovers (TOA). We highlight a handful of players which turnover rate than Coleman, Cirelli, and Dickinson. Playersplayer behaviour, which has been done in soccer [Lindström
et al., 2020]. Modeling how a player spatially handles pres-
sure helps understand their playing style beyond when they
move or shoot the puck. Figure 4b shows each possession
by Joe Pavelski (DAL; top) and Ondrej Palat (TBL; bottom)
throughout game five. Note that although teams change ends
at the start of each period, we have adjusted these diagrams so
they are relative to the direction of the opponents net. Each
dot represents a timestep of possession beginning with hol-
low black circles. The shade in subsequent dots represents
the experienced pressure normalized between 0 (transparent;
low pressure) and 1 (dark; high pressure). This view suggests
significant differences in playing style and handling pressure
which could inform future simulations and models. Specifi-
cally, Pavelski tends to possess the puck for shorter durations
on average than Palat, which we confirmed with an average
possession time of 0.8 s compared to 1.13 s. Palat also tends
to skate towards pressure when possessing the puck, whereas
Pavelski doesn’t carry the puck as long. These visualizations
provide some preliminary analysis of how our analytics might
be used to identify different playing styles. Further analy-
sis into distributions, timelines, and play-by-play situations
could further expose behavioural differences.
7 Discussion and Future Work
Figure 4: (a) PAA heatmaps, (b) Pressure maps. Although our analytics provide us with the possibility of
identifying trends in player behaviour, it is important to em-
below the dataset median for PAA are Volkov (TBL), Shat- phasize that our dataset only includes two games due to
tenkirk (TBL), Klingberg (DAL) and Benn (DAL), meaning data availability limitations. Therefore, we emphasize that
smaller (possibly riskier) passing lanes. Note the differences these initial example insights may not be representative of a
in TOA for these players. This type of analysis could help player’s true longer-term behaviour. Furthermore, some of
adjust a player’s game or anticipate opponents’ actions. our metrics result in slightly defensive-bias results since for-
wards tended not to overtake defense often. While our meth-
6.2 Spatial Trends ods allow for forwards to overcome this bias with larger re-
wards in OVT, we believe a complete representation of per-
PAA Heatmaps: We have constructed pass availability aver- formance can be achieved when combined together with the
age (PAA) heatmaps for each player by overlaying the passing current offensively-biased data. Additionally, our metrics are
lane P L(p, r, ) oriented to their attacking direction for com- most effective when comparing players of the same position
pleted passes. In these heatmaps darker areas represent more as their in-game situations would be more similar.
passes being made in that direction due to more overlapping We expect the broader impact of our work to change the
passing lanes and the variation in colours shows passing be- way AI and ice hockey work together, supporting an abun-
haviour across positions and players. Figure 4a shows three dance of work around game theory, optimal coalition forma-
heatmaps for two defensemen, Lindell (DAL) and Klingberg tion, and learning deep representations that are of broader in-
(DAL) who are often paired together and one forward, Palat terest to the AI community. Specifically, our metrics pro-
(TBL). Each chart is coloured according to its own scale. We vide a new perspective of performance and we hope future
notice significantly different trends in passing across defense models of performance can learn and validate which actions
and forwards in our dataset. For example, Lindell and Kling- are valuable apart from sparsely recorded offense. Addition-
berg tend to pass between each other and up-ice, whereas ally, analytics can change the way players, coaches, general
Palat makes most of his passes backwards. A larger dataset managers, and fans interact and understand the game, poten-
is needed for more general trends, however initial studies of tially helping to identify undervalued or overvalued players.
passing lanes and direction help identity key differences in By visualizing passing lanes and pressure for each timestep a
passing style due to position and player. Identifying trends player has the puck, new temporal and situational analysis of
becomes more important for coalition models pairing de- players’ trends can be studied.
fensemen, three forwards, or a pairs of defense with forwards. In conclusion, our contributions help capture attributes
Pressure Maps: Another method of visualizing our metrics about every player in the game, not just those who gener-
is to display them directly on a 2-dimensional rink, as shown ate offense. Future work involves improving AI in ice hockey
in Figure 4b. The spatial aspect of understanding pressure is with new player evaluation and roster management models
important when designing representative models of simulated and trying to quantify the elusive notion of momentum.Acknowledgments [Hammond, 2011] Richard Hammond. Understanding
We thank the Natural Sciences and Engineering Research advanced stats, part one: Corsi and Fenwick. https:
Council of Canada (NSERC) for financial support. We thank //www.matchsticksandgasoline.com/2011/7/29/2290643/
The NHL, Rogers, Sportsnet, and the University of Waterloo understanding-advanced-stats-part-one-corsi-fenwick,
for organizing the 2020 Sportsnet Hockey Hackathon: Pow- 2011. Accessed: 2021-02-09.
ered by Rogers 5G where the first and fourth authors were [Kempe et al., 2018] Matthias Kempe, Floris R. Goes, and
given access to the tracking data. We thank Braden Hill, Koen A. P. M. Lemmink. Smart data scouting in profes-
Rachel Li, Marhew Maradin, Navpreet Kaur, Ryan Trainor, sional soccer: Evaluating passing performance based on
Hanwen Zhang, and Paula He for their teamwork during the position tracking data. 2018.
initial hackathon. The authors also broadly thank all coaches
and support staff for their guidance throughout the authors’ [Kirkpatrick and Radke, 1985] D. Kirkpatrick and J. D.
combined 75+ years of amateur, collegiate, and professional Radke. A framework for computational morphology. Ma-
hockey playing experience. chine Intelligence and Pattern Recognition, 2:217–248,
1985.
References [Lewis, 2003] M.M. Lewis. Moneyball: The Art of Winning
[Amin, 2018] Jiten B. Amin. Soccer player tracking system. an Unfair Game. Norton paperback. W.W. Norton, 2003.
International Journal for Research in Applied Science and [Lindström et al., 2020] Per Lindström, Ludwig Jacobsson,
Engineering Technology, 6:3455–3461, 2018. Niklas Carlsson, and Patrick Lambrix. Predicting player
[Andrienko et al., 2017] G. Andrienko, N. Andrienko, trajectories in shot situations in soccer. In Ulf Brefeld,
G. Budziak, J. Dykes, G. Fuchs, T. V. Landesberger, and Jesse Davis, Jan Van Haaren, and Albrecht Zimmermann,
Hendrik Weber. Visual analysis of pressure in football. editors, Machine Learning and Data Mining for Sports An-
Data Mining and Knowledge Discovery, 31:1793–1839, alytics, pages 62–75, Cham, 2020. Springer International
2017. Publishing.
[Baysal and Sahin, 2016] S. Baysal and P. D. Sahin. Sentio- [Liu et al., 2018] Guiliang Liu, Wang Zhu, and O. Schulte.
scope: A soccer player tracking system using model field Interpreting deep sports analytics: Valuing actions and
particles. IEEE Transactions on Circuits and Systems for players in the NHL. In MLSA@PKDD/ECML, 2018.
Video Technology, 26:1350–1362, 2016. [Liu et al., 2020] Guiliang Liu, O. Schulte, P. Poupart, Mike
[BusinessWire, 2018] BusinessWire. Global $4.5 billion Rudd, and M. Javan. Learning agent representations for
sports analytics market forecasts up to 2024. https:// ice hockey. In NeurIPS, 2020.
www.businesswire.com/news/home/20181205005823/en/
[Ljung et al., 2018] Dennis Ljung, N. Carlsson, and P. Lam-
Global-4.5-Billion-Sports-Analytics-Market-Forecasts,
2018. Accessed: 2021-04-08. brix. Player pairs valuation in ice hockey. In
MLSA@PKDD/ECML, 2018.
[Dafoe et al., 2020] A. Dafoe, Edward Hughes, Yoram
Bachrach, T. Collins, Kevin R. McKee, Joel Z. Leibo, [Luo et al., 2020] Y. Luo, O. Schulte, and P. Poupart. In-
K. Larson, and T. Graepel. Open problems in cooperative verse reinforcement learning for team sports: Valuing ac-
AI. ArXiv, abs/2012.08630, 2020. tions and players. 2020.
[Dafoe et al., 2021] Allan Dafoe, Yoram Bachrach, Gillian [Macdonald, 2012] B. Macdonald. Adjusted plus-minus
Hadfield, Eric Horvitz, Kate Larson, and Thore Grae- for NHL players using ridge regression with goals, shots,
pel. Cooperative AI: machines must learn to find common fenwick, and corsi. Journal of Quantitative Analysis in
ground. Nature, 593:33–36, 2021. Sports, 8, 2012.
[Douglas and Kennedy, 2019] A. Douglas and C. Kennedy. [Manafifard et al., 2017] M. Manafifard, H. Ebadi, and
Tracking in-match movement demands using local posi- H. Moghaddam. A survey on player tracking in soccer
tioning system in world-class men’s ice hockey. Journal videos. Comput. Vis. Image Underst., 159:19–46, 2017.
of strength and conditioning research, 2019.
[Meerhoff et al., 2019] L. Meerhoff, F. Goes, A. D. Leeuw,
[Fernández, 2019] J. Fernández. Decomposing the immea- and A. Knobbe. Exploring successful team tactics in soc-
surable sport: A deep learning expected possession value cer tracking data. In PKDD/ECML Workshops, 2019.
framework for soccer. 2019.
[Mehrasa et al., 2018] Nazanin Mehrasa, Yatao Zhong,
[Goes et al., 2019] F. Goes, Matthias Kempe, L. Meerhoff, F. Tung, L. Bornn, and G. Mori. Deep learning of player
and K. Lemmink. Not every pass can be an assist: A data- trajectory representations for team activity analysis. 2018.
driven model to measure pass effectiveness in professional
soccer matches. Big data, 7 1:57–70, 2019. [NHL, 2020] NHL. NHL league averages. https://
[Guo et al., 2020] Tianxiao Guo, Kuan Tao, Qingrui Hu, www.hockey-reference.com/leagues/stats.html, 2020. Ac-
cessed: 2021-04-17.
and Yanfei Shen. Detection of ice hockey players and
teams via a two-phase cascaded cnn model. IEEE Access, [Rogers, 2021] Rogers. Rogers communications. https://
8:195062–195073, 2020. www.rogers.com, 2021. Accessed: 2021-04-30.[Schulte and Zhao, 2017] O. Schulte and Z. Zhao. Apples- to-apples: Clustering and ranking NHL players using lo- cation information and scoring impact. 2017. [Silva et al., 2018] R. M. Silva, J. Davis, and T. B. Swartz. The evaluation of pace of play in hockey. Journal of Sports Analytics, 4(2):145–151, 2018. [SMT, 2021] SMT. SportsMEDIA technology. https://www. smt.com, 2021. Accessed: 2021-04-30. [Sportsnet, 2021] Sportsnet. Sportsnet. https://www. sportsnet.ca, 2021. Accessed: 2021-04-30. [Steiner et al., 2019] Silvan Steiner, S. Rauh, M. Rumo, Karin Sonderegger, and R. Seiler. Outplaying oppo- nents—a differential perspective on passes using position data. German Journal of Exercise and Sport Research, 49:140–149, 2019. [Vats et al., 2020] Kanav Vats, M. Fani, Pascale B. Wal- ters, David A Clausi, and J. Zelek. Event detection in coarsely annotated sports videos via parallel multi recep- tive field 1d convolutions. 2020 IEEE/CVF Conference on Computer Vision and Pattern Recognition Workshops (CVPRW), pages 3856–3865, 2020. [Walkters et al., 2020] Pascale Walkters, Mehrnaz Fani, David Clausi, and Alexander Wong. Bendernet and ringer- net: Highly efficient line segmentation deep neural net- work architectures for ice rink localization. Journal of Computational Vision and Imaging Systems, 2020. [Yan et al., 2020] Tom Yan, Christian Kroer, and Alexander Peysakhovich. Evaluating and rewarding teamwork using cooperative game abstractions. ArXiv, abs/2006.09538, 2020. [Yu et al., 2019] David Yu, Christopher Boucher, Luke Bornn, and Mehrsan Javan. Playing fast not loose: Evalu- ationg team-level pace of play in ice hockey using spatio- temporal possession data. 2019. [Zaccaro et al., 2020] S. Zaccaro, Samantha Dubrow, E. Tor- res, and L. Campbell. Multiteam systems: An integrated review and comparison of different forms. 2020.
You can also read