Perceptually Adaptive Graphics
←
→
Page content transcription
If your browser does not render page correctly, please read the page content below
EUROGRAPHICS 2004                                                                                          STAR – State of The Art Report

                                       Perceptually Adaptive Graphics

                            Carol O’Sullivan, Sarah Howlett, Rachel McDonnell, Yann Morvan, Keith O’Conor

                                               Image Synthesis Group, Trinity College Dublin

        Abstract

        In recent years, the Graphics community has come to realise the importance of taking human perception into ac-
        count when striving for realism in images, animations and Virtual Environments. In May 2001, a EUROGRAPH-
        ICS/SIGGRAPH Campfire brought together a group of researchers from various fields, including computer graph-
        ics and visualisation, psychology, neuroscience, eye-movements and medicine to discuss the future and current
        state of the field. Since then, many researchers have been very active in furthering the field of perceptually adap-
        tive graphics. In this report, we outline the state of the art as discussed at that event and the progress that has been
        made since.
        Categories and Subject Descriptors (according to ACM CCS): I.3.7 [Computer Graphics]: Three-Dimensional
        Graphics and Realism Keywords: Graphics and Perception, Perceptual Metrics, Psychophysics

1. Introduction                                                             Graphics researchers can learn much by studying the lit-
                                                                         erature from experimental psychology, psychophysics, neu-
At this stage in the development of the field of Computer                rophysiology and related areas. Many computational mod-
Graphics, great progress has been made in generating highly              els of various perceptual functions have been developed and
realistic renderings and simulations of objects, characters,             used in recent years by the graphics community. However,
fluid, smoke, fire and many other effects. New hardware                  such models are often difficult to apply or generalise to han-
architectures enable users of commodity PCs to run high-                 dle the complex visual tasks typical in graphical scenes and
quality graphical applications heretofore only available on              simulations. Experiments are often designed to study quite
costly high-performance graphics workstations. Meanwhile,                specific factors in isolation and in unnatural laboratory situa-
the demand for visually appealing applications on low-end                tions. Therefore, many researchers from the field of psychol-
mobile devices such as PDAs and cell phones has increased                ogy have realised the potential of using Computer Graph-
dramatically, leading to the development of new architec-                ics to devise more natural scenes and higher level tasks that
tures and libraries to achieve this purpose. This myriad of              more truly reflect the situations being simulated. Therefore,
computational and display opportunities brings with it more              interdisciplinary studies involving Graphics and Perception
than algorithmic and technical challenges. For photorealistic            work to the benefit of both communities.
images and movies, how do we know that we are not simply
producing pretty pictures and actually representing reality in              The increasing interdisciplinary interest in graphics and
a faithful manner? For real-time rendering and simulation,               perception in recent years has resulted in new insights into
how do we make speed-accuracy trade-offs while minimis-                  both areas. Those working on the borders of both disciplines
ing the perceptibility of any resulting anomalies? What types            needed a forum in which to meet like-minded people and
of anomalies are most noticeable and when can we fake real-              discuss the state of the art and, in response to this need,
ity and get away with it? How can we quantify these factors              a SIGGRAPH/EUROGRAPHICS Campfire on Perceptually
and use them in a methodical way to adapt our graphics to                Adaptive Graphics [MO01] was held in Snowbird Utah.
the perception of the viewer? Perceptually adaptive Graph-               Prior to this informal workshop, participants were asked to
ics involves the investigation of these issues and will be the           submit position statements, which were subsequently cate-
subject of this State of the Art Report.                                 gorised under 6 headings: Image Fidelity, Scene Perception,


c The Eurographics Association 2004.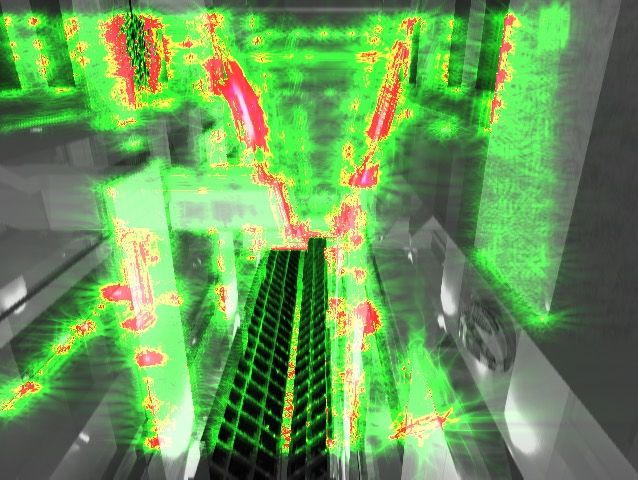
142                                          O’Sullivan et al. / Perceptually Adaptive Graphics

         Figure 1: Eye-tracking can be used both to evaluate metrics and for perceptually adaptive collision handling

Applications, Visualization, Interactive Graphics and finally,
Distance and Scale in Computer Graphics. The resulting po-
sition papers provide a good snap-shot of the state of the
art in perceptually adaptive graphics at that time. In this re-
port, we will start our review of recent work from that point
onwards, and provide some indicative citations of progress
in the meantime. Recent and ongoing research will be pre-
sented under the following main headings:

   Interactive Graphics: We will discuss how perceptually
driven criteria can be used to accelerate interactive render-
ing, including perceptually adaptive LOD techniques, and
approaches that take attention and eye-movements into ac-
count.

   Image Fidelity: Topics will include image fidelity met-
rics, perceptual display of high dynamic range images, and
perception-driven global illumination techniques.

   Animation: Recent work on perceptual metrics for eval-
uating physically based animation and character animation              Figure 2: One set of stimuli from Watson’s experiment:
will be presented, including methods that use eye-tracking             Original (top), QSlim at 80% (middle), Vclust 80% (bottom)
(see Figure 1).                                                        (Image from [WFM01] courtesy of Ben Watson.)

   Virtual Environments: We consider the problem of ef-
fectively generating images of objects and environments that
convey an accurate sense of distance and size, along with              2. Interactive Graphics
fidelity metrics for Virtual Environments and methods for
measuring and predicting Presence.                                     In interactive graphics applications, the ideal situation would
                                                                       be to render a fully detailed and photorealistic scene in real-
     Visualisation and Non-Photorealistic Rendering                    time. However, despite recent advances in current computer
(NPR) A major challenge in visualisation is the design of              graphics technology, this is not yet a feasible option in gen-
algorithms that represent large, complex datasets in such a            eral. Therefore, the aim is to produce the best perceived im-
way that people can quickly understand and grasp their main            age in the time available. An important measurement of vi-
features. An understanding of human perception is integral             sual quality is perceptual i.e., how much does the simulated
to the success of such systems and some ongoing research in            scene look like the original. The properties of human vision
this area will be presented. Recent work in the application of         are therefore very important in the design of perceptually
perceptual principles to non-photorealistic rendering is also          based graphics. In this section, we review some of the most
discussed.                                                             recent work in this field. Many of these approaches rely on


                                                                                                         c The Eurographics Association 2004.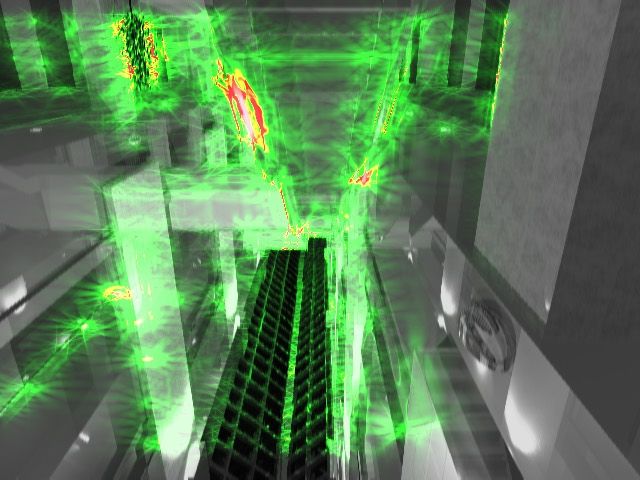
O’Sullivan et al. / Perceptually Adaptive Graphics                                        143

                                                                         duction in quality has no effect on performance even if it is
                                                                         noticeable.
                                                                            Focus Plus Context Screens are one result of new research
                                                                         into extending gaze-contingent displays. Foveal regions of
                                                                         arbitrary shape or size can be created, with peripheral re-
                                                                         gions degraded by arbitrary means such as colour or con-
                                                                         trast and not simply resolution. Additionally, the simulta-
                                                                         neous display of multiple foveal regions is possible, which
                                                                         can be used for prediction. Usually, when peripheral content
                                                                         is rendered at low resolution, the display hardware is still
                                                                         the same resolution as any other part of the screen surface.
                                                                         However, in the case of a focus plus context screen, there
                                                                         is a difference in resolution between the focus and the con-
                                                                         text area. It contains a wall sized low-resolution display with
                                                                         an embedded high-resolution screen. When the user moves
Figure 3: A view presented in the second experiment. Here                the mouse, the display content pans and can be brought into
the periphery uses the 20 x 15 LOD, while the lowest con-                high resolution focus as required. This is interesting for large
trast background is used. The central area is (always) dis-              maps or chip design where certain areas need to be focused
played at the highest HMD resolution. Four distractors are               upon.
shown. (Image from [WWH04] courtesy of Ben Watson.)
                                                                            Baudisch et al. also describe attentive user interface tech-
                                                                         niques for directing a system’s resources towards the scene
                                                                         components in real-time 3D graphics. Specifically, attentive
models of visual attention or on an explicit measurement of              3D-rendering engines are discussed, which uses a viewer’s
gaze direction using eye-tracking.                                       gaze position to vary the LOD at which an object is drawn
                                                                         (see Luebke et al., for further details [LRC∗ 02]). Although
2.1. Gaze-contingent approaches                                          similar to a gaze-contingent display, such approaches have
                                                                         one main difference; objects in an attentive 3D-rendering en-
There is an increasing demand for better display resolu-                 gine are simplified at the object geometry level instead of the
tion with greater numbers of pixels, posing a constant chal-             image level.
lenge as large numbers of pixels consume a lot of compu-
tational resources. However, this is one scenario in which                  Finally, they describe displays in which the user’s atten-
failures of the visual system can be exploited. Baudisch et              tion is captured as opposed to followed, referred to as Easily
al. [BDDG03] present several different approaches to take                Perceived Displays. In such systems, the idea is to guide the
advantage of this using attentive displays, discussed in the             user’s attention and allow computer generation of aestheti-
following paragraphs.                                                    cally pleasing images. Such systems use a perceptual model
                                                                         that works from the gaze information of one user to decide
   When there is not sufficient computer power for a given               which parts of a photograph should be removed. The result
task, there is a negative effect of large-screen technology              is stylized using smooth black lines and colored regions and
on user productivity. As a step towards compensating for                 not just blurred, thus guiding attention to what the original
the demand for rendering power and display resolution, the               user found important.
user’s attentional focus can be taken into account. Instead
of having to add more hardware, display and computation                     In all cases described by Baudisch et al., the intent is to
resources can be instead directed to where they are needed               match the characteristics of human vision to the character-
most. A single user can only ever focus on a small portion               istics of computer displays, namely its distinction between
of the display at a time. Approaches using an eye-tracker                foveal and peripheral vision. Gaze-contingent displays and
are examined, which aim to match the subjective quality of               3D approaches improve display frame rates and responsive-
a non-degraded display. Alternatively, image content can be              ness given certain rendering hardware; focus plus context
removed to achieve a different effect; by presenting view-               screens achieve better immersion and visual context given
ers with only the most important information, their cognitive            certain display hardware; and nonphotorealistic rendering
load can be reduced.                                                     saves the resources of the user’s attention.
   Gaze-contingent displays degrade the resolution in the pe-               In some cases, a model of visual attention has been used
ripheral image regions. The high resolution area moves with              to predict fixations instead of tracking the user’s gaze. How-
the user’s focus, so the area under scrutiny is always ren-              ever, the success of the resulting system depends strongly
dered at a higher resolution. An imperceptible degradation               on the similarity between the predicted and actual regions
is difficult to achieve but often, in visual search tasks, the re-       foveated by the observer. Marmitt and Duchowski [MD03]


c The Eurographics Association 2004.
144                                          O’Sullivan et al. / Perceptually Adaptive Graphics

have developed and evaluated a new method for the com-                 that task driven focus seems to override low-level visual at-
parison of human and artificial scanpaths recorded in virtual          tention when it comes to noticing artifacts. Therefore, they
reality. They use a string editing methodology for the eval-           claim, intentional blindness can be exploited to significantly
uation of human-human or human-artificial scanpaths. They              reduce the rendered quality of a large portion of the scene,
compare the sequence of regions of interest identified using           without having any significant effect on the overall percep-
Itti et al’s attentional model [IKN98] with those recorded             tion.
from a human observer. The experiment examined three dif-
ferent scenarios; a simple cube, a panorama, and a more
complex graphical environment, which participants were al-
lowed to free-view.
   They showed that, for all three situations, the similarities
between the human and the artificial scanpaths are less than
expected. Although this attentional model works reasonably
well for still images, it does not accurately predict human
fixations in a virtual reality environment. They found that
the attentional model assigns attention to a wider area of the
image, whereas observers pay more attention to the central
region of the display.
   Recent work by Cater et al. [CCW03] supports the sug-
gestion that visual attention is largely controlled by the task.
One key advantage to this approach is that attention is there-
fore only dependent upon a specific task and not on the user.
Therefore, no eye-tracker would be needed as different peo-
ple performing the same task should, the authors claim, be
using similar visual processes. They show how task seman-
tics can be used to selectively render in high quality only the
details of the scene that are attended to.
   They carried out experiments involving a task on a
still image. Participants were required to count the num-
ber of teapots in a computer generated office scene, which
was rendered at three different levels of resolution; high
(3072x3072), low (1024x1024) and selective level. At the
selective level the scene was mostly rendered at a low level
except for the visual angle of the fovea (2 degrees) centered          Figure 4: Results from the saliency experiment depicted as
on each teapot. All scenes were exactly the same except for            a colour-map (white representing the greatest number): the
the position of the teapots.                                           total length of fixations on the familiar natural objects (top),
                                                                       the duration of the first fixations on the man-made artifacts
   Results showed that, when carrying out a task, partici-
                                                                       (middle), the total number of fixations on the unfamiliar ob-
pants consistently failed to notice any difference between
                                                                       jects (bottom).
the high and the selective quality image. Twenty percent of
observers even failed to notice the difference between the
high and low quality images. Furthermore, when there was
no task involved, the difference almost always went unno-              2.2. Perceptually guided polygonal simplification
ticed. This demonstrates that people primarily attend to task-         In the recent work of Luebke et al. [LH01], the primary
related objects and the authors postulate that such objects            objective was to improve interactive rendering rather than
can often be identified in advance, depending on the task.             develop offline rendering approaches such as ray tracing,
They show experimentally that it is possible to render scene           which are typically too computationally expensive to be
objects not related to the task at lower resolution without the        evaluated interactively. They demonstrate a novel approach
viewer noticing any reduction in quality.                              to reducing model complexity that is driven by perceptual
   As a confirmation and a demonstration that this was in-             criteria. They use a psychophysical model of visual percep-
deed the effect of inattentional blindness and not peripheral          tion to create a framework that improves interactive ren-
vision, they used an eye-tracker to show that attention was            dering and is used for multiresolution rendering techniques.
fully consumed by the counting task. Even though partici-              The circumstances under which simplification will be per-
pants fixated on non-teapot objects, these fixations were not          ceptible are determined, and those that are deemed per-
enough to distinguish the difference in quality. They noted            ceptible are not carried out. Their framework is applied to


                                                                                                          c The Eurographics Association 2004.
O’Sullivan et al. / Perceptually Adaptive Graphics                                      145

view-dependent polygonal simplification and factors such                  The effect of object type was particularly interesting.
as imperceptible simplification, silhouette preservation and           Firstly, it took longer to name the natural objects, which
gaze-directed rendering are taken into account. Their results          was consistent with earlier results. Furthermore, the ratings
demonstrate that imperceptible simplification was achieved             results showed that the animal models were more like the
with a limited reduction in polygon count when this method             standard when simplified using QSlim, but that the artifacts
was used. In their evaluation it was found that the probability        were more like the standard when Vclust had been used dur-
of seeing a difference was no better than chance. They claim           ing simplification. Regarding preferences, the preference for
that models could potentially be reduced even more i.e., up            QSlim-simplified stimuli was greater for the animal models
to three times further, without a degradation in perception            than for the artifact models and for the 80% simplified mod-
due to the conservative estimate of the spatial frequency at           els than the 50% objects.
present.                                                                  Watson et al. also examined three automatic techniques
                                                          ∗            to see how well they predicted these experimental measures.
   Closely related is work from Williams et al. [WLC 03],              They found that they were generally good predictors of qual-
who describe a best-effort simplification of polygonal                 ity as judged by ratings and preferences, but were not as suc-
meshes based on rules of visual perception. Best-effort ren-           cessful at predicting naming times. In general the automatic
dering is a form of time-critical computing where processing           measures correlate well to preferences, less well to ratings
must occur within a certain time budget. This work applies             and poorly to differences in naming times. Correlations were
to a wider range of models and accounts for textures and dy-           worse for animals than for artifacts.
namic lighting. They use parameterized texture deviation to
measure distortion more accurately, leading to better simpli-             Pojar and Schmalstieg [PS03] present a tool for user-
fications for a certain number of polygons. The simplifica-            controlled creation of multiresolution meshes, allowing se-
tion of lit models is improved by accounting for both spec-            lective control of simplification. The user is allowed to
ular and diffuse effects, under both Gouraud-shaded vertex             identify mesh regions of high semantic or functional im-
lighting and per-pixel normal-map lighting. Here the focus             portance. These importance weightings are supplied by the
is not so much on imperceptible simplification, but on the             user through a Maya plug-in interactively. In this approach,
approach of perceptually-guided best-effort rendering to a             the original Quadric Error Metric of Garland and Heckbert
budget. The most obvious advantage of this approach is on              [GH97] is weighted by the user input during simplification.
vertex-lit models, because the distortion and tessellation ar-         The resulting framework allows the user to improve the qual-
tifacts in specular highlights are highly perceptible. Normal          ity of a multiresolution mesh by taking semantic and func-
maps are used to maintain smooth highlights even at low res-           tional importance into account.
olutions. The system has the ability to simplify low-contrast             In a similar approach, Kho and Garland [KG03] pro-
regions and to preserve high-contrast areas such as silhou-            vide another user-guided simplification system that allows
ettes.                                                                 the user to interactively control an automatic simplification
                                                                       method. As before, they use a weighted quadric error met-
   How can we tell if one simplification is actually bet-              ric. However, as well as adaptive simplification they provide
ter than another? To answer this question, Watson et al.               a tool that allows the user to apply geometric constraints.
[WFM01] looked at techniques that experimentally and au-               These constraints preserve features by guiding the placement
tomatically measured and predicted the visual fidelity of              of vertices on the approximation. The resulting system needs
simplified models. A set of 36 3D polygonal models were                only a short interaction time to produce better semantic or
simplified using two different simplification methods (QS-             functional models and there is no time difference between
lim and Vclust) to two levels of detail (50% and 80% of                user-guided simplification and the original automatic sim-
the original detail), as shown in Figure 2. The stimuli were           plification.
divided into two different object categories; natural objects
and man-made artifacts. Three experimental measures were                  More recently, Howlett et al. [HHO04] attempted to de-
used to measure the fidelity of these images; naming time              termine salient features by using an eye-tracking device to
(i.e., time taken to verbalise the name of an object), ratings         capture human gaze data and then investigated if the visual
and forced choice preferences. All measures were affected              fidelity of simplified polygonal models can be improved by
by simplification level and type of simplification. Naming             emphasizing the detail of salient features identified in this
times were longer with increasing simplification and it took           way (see Figure 4). To try to evaluate the visual fidelity
longer to name objects simplified using Vclust. When ratings           of models simplified using both metrics, a set of naming
were measured, participants were sensitive to simplification           time, matching time and forced-choice preference experi-
level and also rated objects simplified by QSlim as closer             ments were carried out.
to the ideal. The preference results showed that there was a              It was found that the perceptually weighted metric led to
greater preference for Qslim-simplified stimuli, which was             a significant increase in visual fidelity for the lower lev-
greater for the animal models and greater for the objects at           els of detail of the natural objects, but that for the man-
80% detail.                                                            made artifacts the opposite was true. It was concluded that


c The Eurographics Association 2004.
146                                          O’Sullivan et al. / Perceptually Adaptive Graphics

visually prominent features may be predicted in this way               should often be increased in difficult situations, compensat-
for natural objects, but not for synthetic objects. A reason           ing for the challenging environment and maintaining a suf-
for this may be that man-made artifacts are more generally             ficient level of perceptibility. Threshold-based LOD control
related to a task, thus defining prominent features differ-            should only be used when supra-threshold contrast is low.
ently. As described by Hayhoe [Hay00], when a participant’s            When LOD control begins to affect task performance, de-
eye-movements were tracked while making a snack, results               tail should be preserved where sensitivity is lowest. Detail
showed that almost all of the fixations focused on the task,           should be added to low contrast regions before high, and to
rarely focusing elsewhere; This suggests that visual activity          eccentric regions before foveal.
is largely controlled by the task.
  Much of the previous work on LOD control is based upon               2.3. Interruptible Rendering
perception at the threshold i.e, when exactly an artifact be-
comes perceivable. Watson et al. [WWH04] point out that,               Interruptible rendering, as described by Woolley et al.
however, most LOD control happens above threshold. They                [WLWD03], is a trade-off between fidelity and performance.
highlight results from perception research that shows how              It combines spatial error caused by rendering and temporal
supra-threshold perception differs from perception at thresh-          error caused by delay to create a single image-space error
old and carried out two experiments to investigate this appar-         measure called dynamic visual error. Basically, a progres-
ent anomaly.                                                           sive rendering framework is used, which draws a coarse im-
                                                                       age to the back buffer. This is continuously refined while the
   The first experiment they carried out studied the connec-           temporal error is simultaneously checked. When the error
tion between supra-threshold LOD, contrast, eccentricity,              due to the time delay becomes greater than the error due to
and efficient location of complex potential target objects in          the coarseness of the image, reducing the quality of the im-
the visual periphery during search. It had a three way design;         age any further is pointless, so the image is rendered. They
4 LODs, 3 target/background contrasts and 5 target eccen-              produce a system which results in a coarse, high frame-rate
tricities. The display environment consisted of a background           display when input is changing rapidly, and finely detailed,
image indicated by the current level of contrast. If present,          low frame rate display when input is static.
the target was placed over the background at the peripheral
location decided by the eccentricity. The target was a 12 de-             Different rendering algorithms are described, along with
gree square polygon textured with the monochromatic image              implementations based on polygonal rendering and ray-
of a human face. Participants were instructed to press one of          casting. For depth-buffered interruptible rendering, a method
3 mouse buttons if the target was visible to the left, right or        that has containment is required i.e, each refined version of
not at all.                                                            a model should completely contain the simplified version.
                                                                       An ideal interactive renderer simulates off-line renderings
   As expected, results followed supra-threshold predictions:          as a gold standard for comparisons in evaluation. Their re-
LOD became more important as contrast declined and, as ec-             sults from this evaluation show that interruptible rendering
centricity increased, all perceivable LODs were equally im-            is more similar to an ideal, instantaneous render than other
portant. They speculated that below a certain level of reliable        fidelity control schemes. They also show that interruptible
target discrimination, all LODs would have equal impact on             ray-casting also works significantly better than unmanaged
accuracy, while above this level, all LODs would have no               ray casting. Although not as significantly, depth-buffered in-
impact and results confirmed this.                                     terruptible rendering also improves dynamic visual accuracy
                                                                       compared to traditional fidelity-control schemes.
   Additionally, in a second experiment they measured per-
formance by time and used variable LOD control. Partic-
ipants had to find one target among four distractors in a
                                                                       3. Image Fidelity
random location (Figure 3). A head-tracked display was
used as peripheral LOD and contrast were varied. Results               In computer graphics, particular effort has been expended
demonstrate the effects on search time. Mostly equal im-               to develop perceptual metrics and heuristics to measure or
provements in LOD resulted in equal improvement in perfor-             predict the fidelity of images. At the Campfire on percep-
mance, following supra-threshold perceptual research. Sur-             tually adaptive graphics, Ferwerda discussed "Hi-Fi render-
prisingly they found a level of minimum reliability. Even in           ing" and noted that physical accuracy is neither necessary
a more dynamic and higher level display, threshold predic-             nor sufficient to produce visually realistic images. He de-
tions were contradicted. Instead of requiring less detail with         scribed three standards of realism that might help to define
low contrast, participants required more. Again, participants          the criteria needed for good Image Fidelity metrics and has
found coarse and fine details equally important.                       since elaborated on these ideas [Fer03]. Three types of real-
                                                                       ism are defined:
  Overall, results were consistent with their hypothesis and
showed that it is dangerous to base supra-threshold LOD                1. Physical realism, where the image provides the same vi-
control on perception at threshold. Results show that LOD                 sual stimulation as the scene depicted


                                                                                                         c The Eurographics Association 2004.
O’Sullivan et al. / Perceptually Adaptive Graphics                                       147

2. Photorealism, in which the image produces the same vi-             sequences, which show that their performance is not sta-
   sual response as the scene, and                                    tistically distinguishable from PSNR [VQE00], Wang et al.
3. Functional realism, where the focus is on providing the            [WBL02] investigate possible causes. They enumerate the
   same visual information.                                           assumptions made by traditional metrics based on error sen-
   Also at the campfire, Ward noted that, while a good deal of        sitivity and perceptual channel decomposition and discuss
effort has been spent in achieving physical accuracy, this is         their validity. They particularly find fault with the assump-
overkill if the aim is simply to produce something that looks         tion that interaction between channels is weak. They also il-
real to a human observer. Under this same topic, Gibson dis-          lustrate the limitations of Minkowski error pooling, which is
cussed the benefits of knowledge of the human visual system           widely used to combine information over channels in those
for simplifying the process of capturing illumination data in         metrics. Stating that "The main function of the human eyes is
inverse rendering techniques and accelerating the rendering           to extract structural information from the viewing field, and
of synthetic objects. McNamara emphasized the importance              the human visual system is highly adapted for this purpose.
of design when running perceptual experiments to evalu-               Therefore, a measurement of structural distortion should be
ate realism, while Rushmeier emphasized the need to estab-            a good approximation of perceived image distortion.", they
lish guidelines on how to evaluate new methods that apply             propose a simple metric integrating three structural factors,
perceptual principles to computer graphics. Myzkowski pre-            namely loss of correlation, mean distortion and variance dis-
sented perception-driven global illumination solutions while          tortion. They obtain encouraging preliminary results, at a
Tumblin discussed the problem that computer-generated im-             fraction of the cost of metrics simulating the response of the
ages, when represented as a simple 2-D map of scaled scene            visual system.
intensities, often make poor representations of reality be-              Walter et al. [WGP02] present a technique to make er-
cause of display short-comings in reproducing intensities             ror tolerance elevation maps resulting from visual mask-
and contrasts.                                                        ing available through the standard texture mapping pipeline.
   Our discussions are organized as follows: firstly recent           Computation of each texture’s masking properties is inspired
contributions and discussions on image fidelity metrics are           from the JPEG process, allowing for construction of the map
presented. This is followed by a survey of new perceptu-              as the image is decoded. The elevation maps are stored in
ally guided rendering techniques. Finally, progress in the            each texture’s mip-map. At rendering time, standard tex-
reproduction of High Dynamic Range images is discussed.               ture lookup and interpolation make error tolerance elevations
Throughout this section, the exposé continues on from where           available on a per pixel basis to any algorithm that makes use
McNamara’s EG2000 State of the Art Report on visual per-              of them. Applications similar to those discussed in the next
ception in realistic image synthesis [McN01] concludes.               section are presented.

3.1. Metrics                                                          3.2. Rendering
Taking insights from a study of user preferences in con-              3.2.1. Interactive rendering of global illumination
sumer photography [SEL00], Winkler [Win01] proposes to                       solutions
enhance visual fidelity metrics with a visual appeal com-
                                                                      Dumont et al. [DPF03] present a general framework, based
ponent. Among the criteria that the study found, correlated
                                                                      on a decision theory approach, which uses perceptual crite-
to appeal, Winkler singles out two that do not rely on se-
                                                                      ria to handle resource constraints in interactive rendering of
mantics and can be efficiently computed from image data,
                                                                      pre-computed global illumination solutions. The rendering
namely sharpness and colorfulness. He bases his evaluation
                                                                      of a frame is seen as the result of a set of rendering actions,
of the sharpness of an image on analysis of isotropic local
                                                                      each with an associated cost and utility. The cost represents
contrast using a previously presented technique combining
                                                                      the amount of resources needed to take the action. The util-
analytic oriented filter responses [WV99]. For colorfulness,
                                                                      ity measures the contribution of the action to the result. Re-
he uses the sum of the mean distance of pixel chroma to a
                                                                      source constraints can then be met by running a resource
neutral grey and the standard deviation of chroma in the im-
                                                                      allocation algorithm that will maximize utility.
age. He finds that chroma computed in the CIE L∗ u∗ v∗ color
space give the best results. Both indicators are combined to             They describe three applications of their framework, out-
derive a Perceptual Distortion Metric [Win99, Win00] and              lined in the following paragraphs. A common property is that
are tested on video sequences using data gathered from the            a gold standard is available in the form of the global illumi-
Video Quality Experts Group [VQE00], as well as data ob-              nation solution. The utility is therefore defined as a measure
tained from experiments by the author. Results show a sig-            of fidelity to it, provided by a Visual Difference Predictor
nificant increase of correlation with opinion scores for both         (VDP). A key point is that, at equal cost, an ordering of the
indicators.                                                           utilities of rendering actions is sufficient, as opposed to an
                                                                      absolute estimation.
   Recalling the discouraging findings of the VQEG’s as-
sessment of visual fidelity metrics over a wide range of video           The first application deals with diffuse texture manage-


c The Eurographics Association 2004.
148 O’Sullivan et al. / Perceptually Adaptive Graphics
ment. The constraint here is the amount of texture memory Farugia and Peroche classify their subdivision cells by
available. The rendering actions are then the choice of mip- evaluating a VDP between an interpolation computed using
map level at which each texture is stored. The utility func- the previously computed samples and an interpolation, tak-
tion used is a customized version of the VDP proposed by ing into account the samples added at the next refinement
Ramasubramanian et al. [RPG99] in their global illumina- step. They build their metric by computing a distance on
tion guiding framework: the spatial frequencies component, the output of Pattanaik et al.’s Multiscale Model of Adap-
which accounts for visual masking, is pre-computed when tation and Spatial Vision [PFFG98], which consists of con-
the mip-map levels for each texture are generated. trast maps corresponding to spatial frequency bands. For
efficiency, following Albin et al. [ARPT02], they evaluate
The second application is an extension of the previous
their metric over each cell pair using a statistical approach.
method to non-diffuse reflections. The authors choose to
render them using prefiltered environment maps. The con- Stokes et al. [SFWG04] present a new approach to effi-
straints are the memory space available for environment cient, high quality global illumination rendering using per-
maps as well as the time needed to compute and filter them. ceptual illumination components. Their work is based on the
Because of view dependence, the spatial frequency term of fact that the illumination of a surface can be split into com-
the VDP has to be approximated. ponents that are separately computable, namely: direct, in-
The last application aims at simplifying the radiosity mesh direct glossy, indirect diffuse and indirect specular illumina-
from the global illumination solution so as to meet rasteri- tions (if one is to neglect the interaction between the latter
zation limitations, which constitute the constraint here. Ren- three).
dering actions are the display of radiosity elements, the more Their aim was to produce a perceptual metric functioning
finely subdivided, the more costly. The utility function is on those terms that they could use to drive rendering. They
again a specifically tailored VDP. started by conducting a perceptual experiment to obtain data
In each case, interactive frame rates are achieved with on the relative visual importance of each term. A test scene
minimal perceptual impact out of configurations where no representative of typical global illumination scenarios was
resource allocation led to catastrophic results. rendered from different viewpoints, each component sepa-
rately, then the results blended in all possible combinations
3.2.2. Global illumination for static images to serve as visual stimuli for the experiment (a full global
illumination solution was also computed to serve as gold
Farugia and Peroche [FP04] have recently modified a pro-
standard). Participants were asked to sort the images by per-
gressive radiance evaluation technique by Guo [Guo98] by
ceived quality. The results confirmed the marginal percep-
substituting the refinement criterion based on discontinuity
tual contribution of light path interactions between the three
for a perceptual metric.
indirect components (only present in the gold standard). The
Guo’s technique consists of computing radiance samples paper explains thoroughly how a mathematical model was
in an order that will maximize the speed of convergence to fitted to the experimental data to formulate the metric. Ren-
the final result. The process is driven through iterative con- dering was then driven using the metric to predict the relative
struction of a Directional Coherence Map, which is an ir- importance of each component as a function of the materials
regular subdivision of the image in basic blocks that either visible from the desired viewpoint.
correspond to smooth regions (smooth block) or disconti-
nuities (edge block, complex or simple). At each iteration 3.2.3. Global illumination for animation
step, the current configuration of the DCM guides where to
Myszkowski [Mys02] describes an Animation Quality Met-
take new samples in order to refine the block classification.
ric (AQM), which is based on the widely used original VDP
Roughly, children of smooth blocks are considered smooth
by Daly [Dal93]. The time dimension is introduced in the
if none of their corner values vary sensibly from the value
metric by replacing the purely spatial Contrast Sensitivity
obtained by interpolating their parent’s corners. Otherwise,
Function (CSF) with a spatiovelocity CSF, which expresses
they are classified as edge blocks. Edge blocks are sampled
the sensitivity of the eye to contrast in a visual stimulus as a
along their boundaries to determine if they are complex (i.e.,
function of both its spatial frequency and its speed over the
they contain more than one image edge). For simple edge
retina. A spatiovelocity CSF, as opposed to spatiotemporal,
blocks, a discrepancy direction is computed, which is used
is chosen principally because the AQM is expected to be ap-
for interpolating the values to be compared with the samples
plied for the rendering of animation sequences. This means
taken at the next iteration for classification of the children.
that both camera pose and range data are available, there-
Rendering is done by linear interpolation of the samples, fol-
fore allowing for easy computation of pixel flow through im-
lowing the discrepancy direction in the case of edge blocks.
age warping, which yields velocities for each pixel since the
How blocks are flagged (smooth or edge) in the initial regu-
frame rate is known. (Another reason is that accounting for
lar grid has a great impact on convergence speed. Guo uses a
eye movement is made easier).
perceptual criterion based on contrast over the samples cor-
responding to the corners of each block. Myszkowski’s first application of the AQM is to speed-
c The Eurographics Association 2004.O’Sullivan et al. / Perceptually Adaptive Graphics 149
Figure 5: Views wrapped from keyframes at both ends of a frame interval. (Image courtesy of Karol Myszkowski)
Figure 6: Probability of difference detection between the two images (transparent = 0, green = low, red = high): Original pixel
flow (left) and accelerated pixel flow (right). (Image courtesy of Karol Myszkowski)
up the rendering of walk-throughs of static environments. the RADIANCE [War94] irradiance caching mechanism. RA -
The main idea is to use cheap Image Based Rendering tech- DIANCE uses an ambient accuracy parameter as an error tol-
niques to compute as many pixels of the in-between frames erance threshold when interpolating values from its irradi-
as acceptable by using keyframes as reference views. Warp- ance cache, as opposed to computing them accurately. Yee
ing gaps and areas where the pixel flow is slow are accu- et al. modify this parameter on a per pixel basis using a spa-
rately rendered. Keyframes have to be chosen intelligently tiotemporal error tolerance map computed on estimate ren-
so as to minimize the number of pixels that have to be ren- derings of each frame. The computation of the tolerance map
dered. From an initial coarse regular placement of keyframes is similar to Miszkowski’s AQM, the major difference being
along the sequence, new keyframes are added by recursively that they incorporate an optional saliency estimation using
splitting those intervals where the AQM gives a high dif- Itti et al.’s model [IKN98].
ference between the two instances of the middle in-between
view warped respectively from each bound of the interval
(See Figures 5 and 6). When run on test walk-through, the 3.3. High Dynamic Range image reproduction
method provides a speed-up by a factor of two, with 50 to 30 Through multi-exposure photography and the use of new de-
percent of pixels needing accurate rendering for each frame. vices that allow for exposure adaptation on a per pixel basis
The second application, first described in [MTAS01], aims [NM00], the capture of High Dynamic Range (HDR) images
at keeping noise below noticeable thresholds in stochastic is fast becoming common. Current display devices are only
global illumination rendering of dynamic scenes. able to reproduce luminance ranges that are several orders of
magnitude below what can be captured. The human visual
Yee et al. [YPG01] present a perceptual method to guide system however, through the mechanism of local adaptation,
c The Eurographics Association 2004.150 O’Sullivan et al. / Perceptually Adaptive Graphics
is able to perceive local contrast in stimuli that exhibit wide of luminance values: luminance values on one side of a dis-
luminance disparities. HDR display devices are just starting continuity should not contribute to the smoothing of values
to appear. In media such as hard-copy, prospects are not as on the other side.
bright and contrast reduction methods, which have recently
aimed at narrowing the perceptual response gap between the Yee and Pattanaik [YP03] provide a four step method to
captured and reproduced signal by simulating local adapta- achieve this. First, the HDR image is segmented by classify-
tion, will remain dominant. ing each pixel in luminance interval bins. Then, contiguous
pixels belonging to the same bin are grouped using a flood
3.3.1. High Dynamic Range display device fill, and the mean of log luminance values computed for each
group. Groups of insignificant size are then merged into big-
In the design of their display device, Seetzen et al. [SHS∗ 04]
ger neighbour groups whose mean luminance is close. Those
exploit limitations of the human eye in handling high con-
three first steps are repeated for increasing bin sizes, produc-
trast in small regions. Because of its scattering properties,
ing several layers. The last step of the method averages the
the eye is unable to clearly make out the edges or judge rel-
values over layers corresponding to the closest bin sizes. The
ative intensities of local luminance discontinuities of a ratio
method is fast and gives nice results, getting rid of the halo
above 150 to 1. Some of the energy from the luminous side
artefacts that appear when sharp luminance discontinuities
will be transmitted to cells that should be perceiving the dark
are not preserved. A drawback is that five user specified pa-
side near the edge.
rameters are needed.
The main idea is to replace the uniform back-light of an
LCD device with a modulated one capable of much higher Edge-preserving smoothing can be seen as adapting the
brightness. The theoretical reproduced dynamic range is the support of the smoothing function so as to avoid consider-
product of the dynamic ranges of the two modulators. How- ing outlier values (i.e., values that belong to the other side
ever, light path blending reduces that figure. of a discontinuity). Tomasi and Manduchi’s [TM98] non-
linear bilateral filter does just that, by treating the weights
They present two designs, one using a Digital Mirror De-
used for smoothing using a Gaussian distribution centered
vice and one using an array of LEDs as modulated back-
on the current pixel’s luminance value. Durand and Dorsey
lights. In both cases, the HDR signal has to be decomposed
[DD02] apply it to contrast reduction with good results.
into two signals to drive each modulator. Psychophysical
Pattanaik and Yee [PY02] propose a more direct approach
results describing Just Noticeable luminance Difference at
for outlier rejection inspired by the field of photography.
given luminance levels are used to determine the appropriate
Simply put, they discard values from neighboring pixels
number of JND steps in each case, from which the optimal
whose luminance is outside a factor of 5 intervals centered
number of bits necessary to drive each modulated back-light
on the current pixel’s value. Building upon both Fattal et
is derived. In the case of the LED array, the minimal num-
al.’s [FLW02] use of gradient information for contrast re-
ber of LEDs to maintain the same visual response is cho-
duction and Tomasi and Manduchi’s bilateral filter, Choud-
sen based on perceptual experiments carried out by the au-
hury and Tumblin’s [CT03] trilateral filter further adapts the
thors [SWW03]. The blur introduced by the digital projec-
support of the smoothing function to the signal by tilting
tor’s point spread function is made acceptable by the same
it along the bilaterally-smoothed luminosity gradient. The
results.
neighbourhood used for smoothing is also adaptively grown.
On a related note, Mantiuk et al. [MKMS04] also exploit
the limitations of the Human Visual System in high contrast Seetzen et al. [SHS∗ 04] note that there has been little psy-
perception to propose an efficient encoding method for HDR chophysical validation of contrast reduction methods so far
video. and suggest that the availability of HDR display devices will
help design experiments to investigate that topic. Their dis-
3.3.2. Progress in local adaptation contrast reduction play device has already been used by other researchers to
methods compare tone mapping operators. Recent work by Drago
et al. [DMMS02] addressed this issue by subjecting seven
The aim of local adaptation contrast reduction methods is
tone-mapping operators to perceptual evaluation based on
to construct a map of appropriate adaptation levels to local
similarity and naturalness ratings.
luminance for each pixel. A psychophysically based tone-
reproduction technique, such as [PFFG98] can then take ad-
Other work that has followed on from research presented
vantage of it to produce an image resulting in a visual re-
at the campfire include Reinhard and Devlin’s approach to
sponse similar to the response to the HDR stimulus.
dynamic range reduction inspired by photoreceptor physi-
Ideally, each pixel should be given an adaptation lumi- ology [RD04], Reinhard et al’s method of perceptually in-
nance in accordance with the perceived luminances of pix- spired colour transfer between images [RAGS01] and Par-
els of its group as segmented by the eye’s local adaptation raga et al’s [PTT02] investigation of spatio-chromatic prop-
mechanism. This amounts to an edge-preserving smoothing erties of natural images and human vision.
c The Eurographics Association 2004.O’Sullivan et al. / Perceptually Adaptive Graphics 151
4. Animation
In tandem with investigations into image fidelity, the impor-
tance of animation and simulation fidelity has also grown.
We now review some work in the field of simulation and an-
imation that aims to evaluate and/or improve animations by
applying perceptual principles.
4.1. Physical simulation
Barzel and Hughes [BHW96] first introduced the concept
of plausible simulation, and pondered the meaning of physi-
cally plausible vs. visually plausible motion. They suggested
that there are situations in which inaccurate or probabilis-
tic techniques implemented in a noisy or textured environ-
ment are likely to look more realistic than the physically
correct solutions, which have the tendency to appear sterile
and repetitive. Building on these ideas, Chenney and Forsyth
[CF00] developed a scheme for sampling plausible solutions
to constrained physical simulations. They allow a user to
provide a function that describes physical plausibility, which Figure 7: Experiments with visually similar (left) and dis-
is then used to generate a range of animations that satisfy similar (right) distractors (from [OD01])
both this user-defined definition of plausibility and any phys-
ical constraints to be imposed upon the system. For example,
the product of unnormalised Gaussian bell-shaped functions
is used to describe the physical plausibility of a bouncing has shown that most people have erroneous, yet very robust,
ball animation - each collision normal is thus considered to pre-conceptions regarding the physical behaviour of objects
be normally distributed around the perfect, vertical, direc- [Cle82].
tion. In real-time animation, if fully-accurate processing of dy-
∗ namic events such as collisions is performed, this can often
Popovic et al. [PSE 00] also allow for the manipulation of
physically-based animations by letting an animator play with lead to long delays if the objects are complex or there are
the physical properties of a simulation until a desired end- many colliding groups. We found that the effect of such a
result is achieved. In this case, the definition of plausibility delay at the moment of impact on the perception of the user
is purely under the control of the animator. However, only re- was highly detrimental to the perceived realism [OD01]. To
cently has there been a concerted effort to examine issues of ameliorate this effect, simplified volumes are often used to
perceptibility and plausibility with respect to the simulation compute collisions between objects in real-time simulation,
of motion for animations. In order to guarantee plausibility, but this can also lead to a variety of dynamic anomalies -
an awareness of the perceptual impact of simplifications and separation between the objects when they collide, or less ac-
distortions is imperative. In recent work, we investigated the curate physical response. We found that the negative effect
role of various factors on human perception of anomalous of both of these factors was significant, but found that per-
collisions and the exploitation of these factors for develop- ception could be improved by adding more distracters (other
ing adaptive simulation systems [OD01, ODGK03]. We also objects moving in the scene - See Figure 7), occluding the
investigated the use of eye-tracking for evaluation and adap- view or adding a random spin after collision.
tive control of interactive graphical systems [ODH03], and These studies provided some interesting insights into the
to investigate the role of attention when viewing collision factors that affect our perception of certain dynamic events.
events [OL04] (see Figure 1). They were not, however, sufficient to provide the basis for an
empirical metric, as they were more qualitative than quanti-
Humans make decisions about the properties of objects
tative in nature. Therefore, more recently we ran some psy-
based on the way in which they interact with each other; We
chophysical experiments that allowed thresholds to be found
judge whether objects are animate or inanimate depending
for human sensitivity to dynamic anomalies [ODGK03].
on whether we perceive them as moving of their own voli-
These studies were inspired by some earlier psychophysical
tion, or being "caused" to move by another object (referred
experiments carried out by Kaiser and Proffitt [KP87].
to as the perception of causality [Mic63]). Many studies have
shown that these perceptual mechanisms are establised very We showed participants a range of simple dynamic events
early on in infancy [BSW85] but it is not clear how accu- i.e., collisions between spheres, or between a sphere and
rate they are. Research in the realm of physics education a more complex object (see Figure 8), and applied distor-
c The Eurographics Association 2004.152 O’Sullivan et al. / Perceptually Adaptive Graphics
Incorporating perceptual principles into such simulations is
a promising future area of research, with a view to improv-
ing quality and gaining insights into where to concentrate
limited computational time in human and crowd animation.
Human animations can look unbelievable for many reasons:
perhaps the technique used to generate the motion is not ac-
curate enough, or motion editing has introduced noticeable
artefacts; important behavioural features may not be present
or have not been modelled correctly; or maybe there sim-
ply was not enough time or computational power available
to perform the computations necessary to produce the re-
quired simulation. Oesker et al. [OHJ00] demonstrated that
there is psychological evidence that observers were affected
by the level of detail of a character’s animation in making
judgments about the skill of virtual football players, while
Hodgins et al. [HOT98] showed that the geometric model
type used to represent the human affected people’s ability to
perceive the difference between two human motions. In this
section, we provide an overview of some recent studies that
further investigated several of these issues.
4.2.1. Motion Transitions
Lee et al. [LCR∗ 02] developed a technique for keyframe
transitioning. Their aim was to retain the realism of motion
Figure 8: Screenshots from the experiments to examine per- capture, while allowing new motions to be created. More
ception of dynamic anomalies in collisions [ODGK03]. specifically, this involves the creation of a motion capture
database and a graph to incorporate the interconnections of
the motion frames in this database, along with a search strat-
egy for traversing the graph to form new paths.
tions in a methodical manner in order to find the thresholds
at which these distortions became perceptible. Such distor- Wang and Bodenheimer [WB03] conducted a set of exper-
tions included linear and angular velocity errors, delays or iments to evaluate the motion transition cost function pro-
separation between objects at the moment of impact and er- posed by Lee et al. The goal of the paper was to produce
roneous changes to the post-collision trajectories of the ob- a set of optimised weights that select good transitions and
jects. Some interesting biases were found and this informa- validate these results with a cross validation study and a
tion, along with the thresholds measured, was used to define user study. Lee et al. set weights to one for shoulders; hips,
a visual plausibility function. This was similar to that pro- knees, elbows, pelvis and spine, and all others had a value
posed by Chenney and Forsyth [CF00], but was now based of zero. Wang and Bodenheimer used 16 different segments
on psychophysical data and hence took the perception of the of captured motion and manually selected 16 good transi-
viewer into account. To illustrate its potential, the metric was tions and 26 bad ones and then solved for the optimal values
used in two case studies: simulation levels of detail using of the weights using a constrained least square minimisation.
collision proxies, and constrained dynamics. The optimisation was constrained such that the weights were
non-negative and symmetric.
In the future, the perception of sound
[vdDPA∗ 02, KPK00] and haptics [OL03] should be A cross validation study was performed, where the
included in any metrics that aim to evaluate the fidelity weights were optimised with one set of training data deleted.
of simulations. Multisensory displays are becoming more The resulting weights were then used to compute the optimal
prevalent and related perceptual issues are also recently value of a transition for the deleted data set. The algorithm
receiving more attention - see the notes from Fels et al’s proved to be both robust and general enough to pick reason-
recent course on design of interactive multimodal media able transitions for a wide variety of motions.
systems [FFM∗ 03] for a full discussion of these issues. A user study was then conducted to evaluate the weight-
ing determined by the optimisation. Participants were shown
a series of motion clips and asked to rate how noticeable
4.2. Animation of Human Motion
and natural the discontinuities were. Half of the motion clips
A particularly challenging new area of research is evaluat- used Lee et al.’s weights and the other half used optimal
ing the perceptual impact of anomalies in human animation. weights. The comparison was made on clips without the use
c The Eurographics Association 2004.You can also read