Plantar pressure sensors indicate women to have a signicantly higher peak pressure on the hallux, toes, forefoot, and medial of the foot compared ...
←
→
Page content transcription
If your browser does not render page correctly, please read the page content below
Plantar pressure sensors indicate women to have a
signi cantly higher peak pressure on the hallux,
toes, forefoot, and medial of the foot compared to
men
Tetsuya Yamamoto
Kobe Daigaku Igakubu Fuzoku Byoin https://orcid.org/0000-0002-9998-3427
Yuichi Hoshino ( yuichi-h@mta.biglobe.ne.jp )
https://orcid.org/0000-0001-6142-8973
Noriyuki Kanzaki
Kobe Daigaku Igakubu Fuzoku Byoin
Koji Nukuto
Kobe Daigaku Igakubu Fuzoku Byoin
Takahiro Yamashita
Kobe Daigaku Igakubu Fuzoku Byoin
Kazuyuki Ibaraki
Kobe Daigaku Igakubu Fuzoku Byoin
Kanto Nagai
Kobe Daigaku Igakubu Fuzoku Byoin
Kouki Nagamune
Fukui Daigaku
Daisuke Araki
Kobe Daigaku Igakubu Fuzoku Byoin
Takehiko Matsushita
Kobe Daigaku Igakubu Fuzoku Byoin
Ryosuke Kuroda
Kobe Daigaku Igakubu Fuzoku Byoin
Research
Keywords: Plantar pressure, In-shoe pressure sensor system, Sex difference, Center of pressure
DOI: https://doi.org/10.21203/rs.3.rs-20441/v3
Page 1/13License: This work is licensed under a Creative Commons Attribution 4.0 International License.
Read Full License
Page 2/13Abstract
Background: Sex-related differences of plantar pressure distribution during activities should be
thoroughly inspected as it can help establish treatment and prevention strategies for foot and ankle
problems. In-shoe measurement systems are preferable without space and activity restrictions; however,
previously reported systems are still heavy and bulky and induce unnatural movement. Therefore, a slim
and light plantar pressure sensor was newly developed to detect the effect of sex difference on plantar
pressure during standing and walking.
Methods: One-hundred healthy adult volunteers (50 women and 50 men) were recruited. Ten plantar
pressure sensors were implanted in a 1-mm thick insole, with a total weight of 29 g. Plantar pressure was
recorded with 200 Hz during 3 seconds of standing and while walking 10 steps. The maximum loads
during standing and walking were analyzed in each sensor, and the results were compared between
different areas of the foot in the antero-posterior direction and the medio-lateral direction and between
different time points. The movement of the center of pressure (COP) during walking was also evaluated.
Analyses were adjusted for body mass index and gait speed.
Results: The movement of COP was constant for both sexes. In all cases, the maximum load was
observed on the medial of the foot. Women had a signi cantly higher peak pressure on the hallux, toes,
forefoot, and medial aspect of the foot compared to men while standing and walking (p < .05).
Conclusions: A newly introduced in-shoe plantar pressure sensor demonstrated a typical loading
transition pattern of the foot. Furthermore, higher plantar pressure in the forefoot was detected in healthy
women as compared to men during standing and walking activities.
Introduction
Analysis of the loading condition of the sole during walking and running is vital to improve footwear
design[1], sports performance analysis and injury prevention[2], balance control[3], and for diagnosing
diseases[4]. Various foot pressure evaluation devices have been developed, and the currently available
systems are categorized into the plantar platform system and the in-shoe system.
At present, over 50 different devices are used for foot loading analysis[5]. Some systems require
specialized laboratories, whereas others require relatively expensive and delicate insoles with pressure
sensors[6]. The in-shoe system is preferable over the plantar platform system because of its portability,
simplicity, and applicability on various shoe types[7], and participants can perform natural movement
during the experiment without the restriction of space and activity [8]. However, existing in-shoe systems
are heavy and bulky, and induce unnatural movement, urging the need of a light and slim in-shoe type
sensor.
Skeletal structure and muscular strength differ between women and men. However, the effect of sex on
plantar pressure during activities remains undetermined. Putti et al. did not nd any sex-based
Page 3/13differences in plantar pressure while walking eight steps on the same walkway[9]. Darlene et al. reported
that no signi cant differences were found in normalized plantar pressure values between men and
women[10]. On the other hand, in some investigations, there was a signi cant difference in the peak
pressure between men and women. Demirbuken et al. reported that higher toe peak pressure was
identi ed more often in women than in men during early adolescence[11]. Chung et al. indicated that men
had higher peak pressure in the medial toe and all forefoot areas than women[12]. McKay et al reported
that there was no signi cant difference between boys and girls aged 3-9 years, at ages 10-19, men had
signi cantly higher midfoot peak pressure than women and at age 20 and older men had signi cantly
higher rearfoot peak pressures than women[13].
To examine the effect of sex difference on plantar pressure, testing activities should be performed in
positions as natural as possible, without any obstruction from the measurement.
Therefore, a slim plantar pressure sensor was newly developed to measure plantar pressure of healthy
adults during unrestricted activities. The purpose of this study was to evaluate pressure distribution on
the sole during gait and stance using the newly developed in-shoe measurement system and compare the
results between sexes.
Analysis of the loading condition of the sole during walking and running is vital to improve footwear
design[1], sports performance analysis and injury prevention[2], balance control[3], and for diagnosing
diseases[4]. Various foot pressure evaluation devices have been developed, and the currently available
systems are categorized into the plantar platform system and the in-shoe system.
At present, over 50 different devices are used for foot loading analysis[5]. Some systems require
specialized laboratories, whereas others require relatively expensive and delicate insoles with pressure
sensors[6]. The in-shoe system is preferable over the plantar platform system because of its portability,
simplicity, and applicability on various shoe types[7], and subjects can perform natural movement during
the experiment without the restriction of space and activity [8]. However, existing in-shoe systems are
heavy and bulky, and induce unnatural movement, urging the need of a light and slim in-shoe type sensor.
Skeletal structure and muscular strength differ between women and men. However, the effect of sex on
plantar pressure during activities remains undetermined. Putti et al. did not nd any sex-based
differences in plantar pressure while walking eight steps on the same walkway[9]. Darlene et al. reported
that no signi cant differences were found in normalized plantar pressure values between men and
women[10]. On the other hand, in some literatures, there was a signi cant difference in the peak pressure
between men and women. Demirbuken et al. reported that higher toe peak pressure was identi ed more
often in women than in men during early adolescence[11]. Chung et al. indicated that men had higher
peak pressure in the medial toe and all forefoot areas than women[12]. McKay et al reported that there
was no signi cant difference between boys and girls aged 3-9 years, at ages 10-19, men had signi cantly
higher midfoot peak pressure than women and at age 20 and older men had signi cantly higher rearfoot
peak pressures than women[13].
Page 4/13To examine the effect of sex difference on plantar pressure, testing activities should be performed in
positions as natural as possible, without any obstruction from the measurement.
Therefore, a slim plantar pressure sensor was newly developed to measure plantar pressure of healthy
adults during unrestricted activities. The purpose of this study was to evaluate pressure distribution on
the sole during gait and stance using the newly developed in-shoe measurement system and compare the
results between sexes.
Materials And Methods
Participants
One hundred healthy adult volunteers (50 women and 50 men) were included in the study. Demographic
data are shown in Table 1. We analyzed both left and right feet in all 100 cases. There was no difference
between left and right feet, and, therefore, the results of the left foot were presented. Participants were
excluded if they had experienced foot pain within the previous 6 months, had previously undergone foot
surgery, or had presented with congenital or acquired foot deformities on clinical examination.
Demographics including age, sex, height, weight, and foot size were recorded. The study protocol was
approved by the Institutional Review Board of our institution and written informed consent was obtained
from all participants before their enrollment.
Table 1 Demographic data
Sex comparison of demographic data, * p < .05 significantly higher, Paired t-test. Values are given as mean ± SD.
Measurement devices
The newly developed plantar pressure sensor (University of Fukui Graduate School of Engineering,
Japan) has 10 sensors of 1 mm thickness and 12 g weight. They are connected to a measuring unit that
has 200 Hz of sampling rate and is 17 g in weight (Figure 1). Three sensors were placed on the toes, four
on the forefoot, two on the midfoot, and one on the hindfoot. Four sizes (23 to 28 cm) of sports shoes
and corresponding sizes of plantar pressure sensors were prepared to provide the best t shoes for each
participant.
Measurement and analysis
Page 5/13The participants were allowed to acclimatise to the shoes by walking a minimum of 10 steps before data
collection, which did not begin until the participant veri ed that they were comfortable. Each participant
rested for 3 seconds after wearing the device, after which plantar pressure was measured while standing.
Next, participants were instructed to walk at least 10 steps at a comfortable speed while the plantar
pressure was recorded (Figure 2). The maximum loading while walking was measured in the hallux (the
sensor a), and the movement of the maximum loading point while walking was analyzed by evaluating in
different areas of antero-posterior (AP) direction and medio-lateral (ML) direction (Figure 3). The hallux
was measured individually, considering that there might be a difference in the hallux between women and
men because hallux valgus was more common in women. The prevalence of hallux valgus was 22.8% in
Japan. The prevalence in women was 2.54 times higher than in men[14]. Results were compared between
sexes by converting body mass index (BMI) to 22 and gait speed to 118 steps / min (Excel 2016,
Microsoft and COP graph creator, University of Fukui Graduate School of Engineering, Japan). The gait
speed was 120 ± 9 steps / min for women and 116 ± 11 steps / min for men and there was no signi cant
difference between men and women. Since the overall average was 118 steps / min, we used that value
for adjustment. The movement of COP during walking was analyzed in the AP and ML directions. When
compared based on sex, the sensor was converted to 25.5 cm equivalent and calculated.
Statistical Analysis
A two-sample t-test was used for a sex-based comparison of the data (Excel 2016, Microsoft). For all
analyses, statistical signi cance was set at P < .05. All analyses except of demographic data was used
Bonferroni’s correction for multiple comparisons. All data were reported as the mean ± SD.
Results
Women had a signi cantly higher peak pressure on the hallux, toes, forefoot, and medial aspect of the
foot compared to that of men during standing (Table 2. All; p < .05). Similar to the results during standing,
a signi cantly higher peak pressure was observed on the hallux, toes, forefoot, and medial aspect of the
foot in women than men during walking (Table 2, All; p < .05). In all cases, greater loading was applied to
medial aspect of the foot in the middle of the stance phase than lateral. COP movements were similar
across participants such that they translated from the hindfoot through the middle of the midfoot, and
nally toward the base of the rst toe (Figure 4). There were no signi cant differences between sexes
(Table 3, All; p > .05).
Table 2 The state of standing and walking peak pressure
Page 6/13Sex comparison of the state of standing and walking peak pressure, * p < .05 significantly higher, Paired t-test,
Bonferroni’s correction. Values are given as mean ± SD (kPa). Diff. = Mean difference in women from men.
Table 3 The COP movement
Sex comparison of the COP movement, there was no significant difference between sex, Paired t-test. Values are
given as mean ± SD (mm). Diff. = Mean difference in women from men. AP; antero-posterior, ML; medio-lateral.
Discussion
The most important nding of this study was that women applied a signi cantly higher peak pressure on
the hallux, toes, forefoot, and medial aspect of the foot while both standing and walking than men.
Women have a higher pelvic tilt and a center of gravity anterior to men[15], which can result in higher
plantar pressure at the toes and forefoot. The movement of knee-in while walking was likely to occur in
women because of weaker gluteus medius strength compared to men[16]. Thus, the peak pressure at the
medial aspect of the foot may be higher. In previous reports, the results regarding the difference in peak
pressure between men and women were varied. Some reports indicated that there was no signi cant
difference between men and women[9,10], and some reports indicated that men have higher peak
pressure in the medial toe and all forefoot areas than women[12]. On the other hand, higher toe peak
pressure was identi ed more often in women than in men during early adolescence[11]. It is also reported
that the peak pressure shifts from the hind foot to the forefoot depending on the age[13].
Technical improvement of the measurement system was demonstrated for evaluation of the plantar
pressure during natural activities. The Pedar system (Novel gmbh, Munich, Germany) and F-scan system
(Tekscan, Inc, Boston, MA) are the main models of the in-shoe plantar pressure measurement system in
the previous studies [17][18]. However, they are relatively heavy (The Pedar system; 400 g, F-scan system;
400 g) and bulky (The Pedar system; 600 , F-scan system; 300 ). To evaluate natural walking, the size
and weight of a measurement device should be as light and small as possible. The newly developed in-
shoe device in the current study weighs 17 g and has a volume of 15 , making it possible to perform
standing and walking with less interference than previous products. Additionally, conventional products
have 50 Hz of sampling rate, whereas this device has 200 Hz of sampling rate. Therefore, the new system
could have less chance to miss some instant and important changes of the plantar pressure during
activities. The newly introduced device can be applied to faster movements, such as running and sports
activities.
Page 7/13The COP is de ned as the centroid of the total number of active sensors, which suggests the spatial
distribution of pressure over time[19]. It has been suggested that the COP provides greater insight into
dynamic foot function compared to pressure at discrete regions[20]. Buldt et al reported a difference
between the planus and a normal foot in relation to the medial shift of the lateral-medial force index
during terminal stance[21]. In this study, COP movements were similar across healthy adult participants
such that they translated from the hindfoot through the middle of the midfoot, and nally toward the
base of the rst toe. Future studies comparing healthy feet with pathological conditions, such as at foot
and hallux valgus, are warranted.
Although this study did not include cases of hallux valgus (HV), women had a higher plantar pressure at
the hallux than men. Nix reported a meta-analysis that estimated that female HV prevalence (30%) was
2.3 times greater than in men (13%)[22]. Studies have reported plantar pressure in HV in the past;
however, their results have been inconsistent. Some have reported a high plantar pressure on the
hallux[23][24], while others have reported an inverse correlation between severity and plantar pressure at
the hallux[25]. There are various causes of HV; however, this sex-based difference in pressure can be
suggested as one of the causes.
The ndings of this study should be considered after taking into consideration ve limitations. We have
not recorded the foot posture of the participant in this study, however, according to a systematic review of
foot posture by Buldt et al., there was a signi cant difference in peak pressure between the pes cavus, the
pes planus, and the normal foot[26]. Since we selected healthy foot participants, it was considered that
foot posture had little effect on peak pressure. We have not recorded the foot morphology of the
participant in this study. Mahshid et al. reported that Japanese women had narrower feet in the heel and
forefoot, and their instep, rst and fth toes and navicular height were also lower than men’s[27]. Zhao et
al. demonstrated that Japanese men generally had longer, larger and higher arched feet than women[28].
Since we adjusted the shoe size to 25.5 cm and compared, it was considered that foot morphology had
little effect on peak pressure. Plantar pressure measurement systems are limited in that they only
measure force perpendicular to the sensor surface. Therefore, other relevant forces including shear force
cannot be measured. However, the current study examined the force during standing and walking when a
vast majority of force is applied perpendicular to the foot. The in uence of other related forces might be
considered when more active sporting activities are involved, i.e. turning, stop-and-go motions. Footwear
characteristics such as sole bending stiffness are likely to in uence the parameters. To avoid this impact,
the same shoes of different sizes were used in the current study; however, care should be taken when
using different shoes in future studies. Lastly, although statistical signi cance was achieved in the
comparisons, the sample size might be insu cient to apply this study result to the general population of
wider age and/or other cultural backgrounds. It should be noted that the current study results stem from
participants who were relatively younger than most foot and ankle patients, but older than most active
sport athletes.
The current study result could be used to develop sex speci c design of insole or shoes. Wearing
appropriate shoes may help prevent foot and ankle pathological conditions. In addition, checking the COP
Page 8/13movement may help improve gait balance and gait posture. In order to invent therapeutic ones, further
detailed evaluations of plantar pressure in pathological feet are needed, and the new measurement tool
might be applicable.
Conclusions
Women tend to put more pressure on the front and medial side of the foot during natural standing and
walking than men.
Abbreviations
COP: center of pressure; AP: antero-posterior; ML: medio-lateral; HV: hallux valgus
Declarations
Ethics approval and consent to participate
The study protocol was approved by the institutional review board of Kobe University Graduate School of
Medicine (No. B190150). Written informed consent was obtained from each participant.
Consent for publication
Not applicable.
Availability of data and materials
The datasets used and/or analyzed during the current study are available from the corresponding authors
on reasonable request. Please contact authors for data requests (MD, PhD. Yuichi Hoshino – email
address: yuichi-h@mta.biglobe.ne.jp).
Competing interests
The authors declare that they have no competing interests.
Funding
The authors received no nancial support for the research, authorship, and/or publication of this article.
Authors' contributions
TY, YH and NK were involved in study conception and design, data collection, data analysis and
interpretation, and drafting the manuscript. KN, KI and KN were involved in data interpretation and
contributed to drafting the manuscript. DA, TM and RK was involved in study design, data interpretation,
and contributed to drafting the manuscript. All authors have read and approved the nal manuscript.
Page 9/13Acknowledgements
The authors would like to thank Editage (www.editage.jp) for the English language review.
References
1. Hung K, Zhang YT, Tai B. Wearable medical devices for tele-home healthcare. Conf Proc . Annu Int
Conf IEEE Eng Med Biol Soc IEEE Eng Med Biol Soc Annu Conf. United States; 2004;7:5384–7.
2. Bonato P. Wearable sensors/systems and their impact on biomedical engineering. IEEE Eng. Med.
Biol. Mag. United States; 2003. p. 18–20.
3. Rodgers MM. Dynamic biomechanics of the normal foot and ankle during walking and running. Phys
Ther. United States; 1988;68:1822–30.
4. Margolis DJ, Knauss J, Bilker W, Baumgarten M. Medical conditions as risk factors for pressure
ulcers in an outpatient setting. Age Ageing. England; 2003;32:259–64.
5. Lorkowski J, Grzegorowska O, Kotela I. [The Use of Pedobarographic Examination to Biomechanical
Evaluation of Foot and Ankle Joint in Adult - Own Experience]. Ortop Traumatol Rehabil. Poland;
2015;17:207–13.
6. Buldt AK, Allan JJ, Landorf KB, Menz HB. The relationship between foot posture and plantar pressure
during walking in adults: A systematic review. Gait Posture. England; 2018;62:56–67.
7. Zulki i SS, Loh WP. A state-of-the-art review of foot pressure. Foot Ankle Surg. France; 2020;26:25–
32.
8. Burn eld JM, Few CD, Mohamed OS, Perry J. The in uence of walking speed and footwear on
plantar pressures in older adults. Clin Biomech (Bristol, Avon). England; 2004;19:78–84.
9. Putti AB, Arnold GP, Abboud RJ. Foot pressure differences in men and women. Foot Ankle Surg.
France; 2010;16:21–4.
10. D.F. M, B.D. B, J.D. M, P.M. V. E cacy of plantar loading parameters during gait in terms of reliability,
variability, effect of gender and relationship between contact area and plantar pressure. Foot Ankle
Int [Internet]. 2005;26:171–9.
11. Demirbuken I, Ozgul B, Timurtas E, Yurdalan SU, Cekin MD, Polat MG. Gender and age impact on
plantar pressure distribution in early adolescence. Acta Orthop Traumatol Turc. Turkey; 2019;53:215–
20.
12. Chung MJ, Wang MJ. Gender and walking speed effects on plantar pressure distribution for adults
aged 20-60 years. Ergonomics. 2012;55:194–200.
13. McKay MJ, Baldwin JN, Ferreira P, Simic M, Burns J, Vanicek N, et al. Spatiotemporal and plantar
pressure patterns of 1000 healthy individuals aged 3–101 years. Gait Posture. 2017;58:78–87.
14. Nishimura A, Kato K, Fukuda A, Nakazora S, Yamada T, Uchida A, et al. Prevalence of hallux valgus
and risk factors among Japanese community dwellers. J Orthop Sci. 2014;19:257–62.
Page 10/1315. Medina McKeon JM, Hertel J. Sex differences and representative values for 6 lower extremity
alignment measures. J Athl Train. United States; 2009;44:249–55.
16. Nakagawa TH, Moriya ETU, Maciel CD, Serrao F V. Trunk, pelvis, hip, and knee kinematics, hip
strength, and gluteal muscle activation during a single-leg squat in males and females with and
without patellofemoral pain syndrome. J Orthop Sports Phys Ther. United States; 2012;42:491–501.
17. Putti AB, Arnold GP, Cochrane L, Abboud RJ. The Pedar in-shoe system: repeatability and normal
pressure values. Gait Posture. England; 2007;25:401–5.
18. Ahroni JH, Boyko EJ, Forsberg R. Reliability of F-scan in-shoe measurements of plantar pressure.
Foot ankle Int. United States; 1998;19:668–73.
19. Cornwall MW, McPoil TG. Velocity of the center of pressure during walking. J Am Podiatr Med Assoc.
United States; 2000;90:334–8.
20. Wong L, Hunt A, Burns J, Crosbie J. Effect of foot morphology on center-of-pressure excursion during
barefoot walking. J Am Podiatr Med Assoc. United States; 2008;98:112–7.
21. Buldt AK, Forghany S, Landorf KB, Murley GS, Levinger P, Menz HB. Centre of pressure characteristics
in normal, planus and cavus feet. J Foot Ankle Res. England; 2018;11:3.
22. Nix SE, Vicenzino BT, Collins NJ, Smith MD. Gait parameters associated with hallux valgus: a
systematic review. J Foot Ankle Res. England; 2013;6:9.
23. Bryant A, Tinley P, Singer K. Plantar pressure distribution in normal, hallux valgus and hallux limitus
feet. Foot. 1999;9:115–9.
24. Martinez-Nova A, Sanchez-Rodriguez R, Perez-Soriano P, Llana-Belloch S, Leal-Muro A, Pedrera-
Zamorano JD. Plantar pressures determinants in mild Hallux Valgus. Gait Posture. England;
2010;32:425–7.
25. Menz HB, Lord SR. Gait instability in older people with hallux valgus. Foot ankle Int. United States;
2005;26:483–9.
26. Buldt AK, Allan JJ, Landorf KB, Menz HB. The relationship between foot posture and plantar pressure
during walking in adults: A systematic review. Gait Posture [Internet]. Elsevier; 2018;62:56–67.
Available from: https://doi.org/10.1016/j.gaitpost.2018.02.026
27. Saghazadeh M, Kitano N, Okura T. Gender differences of foot characteristics in older Japanese
adults using a 3D foot scanner. J Foot Ankle Res. Journal of Foot and Ankle Research; 2015;8:1–7.
28. Zhao X, Tsujimoto T, Kim B, Katayama Y, Tanaka K. Characteristics of foot morphology and their
relationship to gender, age, body mass index and bilateral asymmetry in Japanese adults. J Back
Musculoskelet Rehabil. 2017;30:527–35.
Figures
Page 11/13Figure 1
Plantar pressure measurements (A) Ten of the sensors are attached underneath the insole and connected
to the measuring unit. The sensors are only 1mm in thickness and total 12g in weight. (B) The measuring
unit is only 17g in weight and collects data at 200Hz. (C) The sensor is placed underneath the insole and
connected to the measuring unit on the top of the foot.
Figure 2
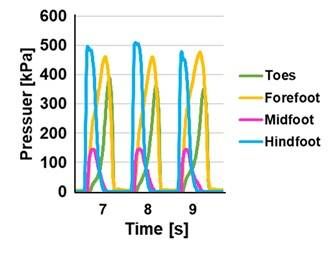
Plantar pressure during walking Plantar pressure in each the toes, forefoot, midfoot and hindfoot area
during walking. The maximum loading in each part reached its peak starting from the hindfoot, the
midfoot and the forefoot, consistently.
Page 12/13Figure 3
The evaluation of plantar pressure (A) The value of the sensor a in the gure was de ned as Hallux. (B)
Areas for analyzing weight-bearing point in anteroposterior direction. The evaluation was divided into
four parts: toes, forefoot, midfoot, and hindfoot, and the average value was calculated. (C) Areas for
analyzing weight-bearing point in medio-lateral direction. The average value was calculated separately
for the medial and lateral.
Figure 4
The COP movement A typical case of COP movement during walking. The COP movements were similar
across participants such that it translated from the hindfoot through the middle of midfoot, nally toward
the base of rst toe.
Supplementary Files
This is a list of supplementary les associated with this preprint. Click to download.
Table1rev.jpg
Table2rev.jpg
Table3rev.jpg
Page 13/13You can also read