Platinum & Passes The Impact of Mining Investments on Education Outcomes in South Africa - Africa Portal
←
→
Page content transcription
If your browser does not render page correctly, please read the page content below
RESEARCH REPORT 16
           Development Effectiveness Project
           M a y 2 014

Platinum & Passes
The Impact of Mining Investments on Education
Outcomes in South Africa
Neissan Alessandro Besharati
ABOUT SAIIA

The South African Institute of International Affairs (SAIIA) has a long and proud record as South
Africa’s premier research institute on international issues. It is an independent, non-government think
tank whose key strategic objectives are to make effective input into public policy, and to encourage
wider and more informed debate on international affairs, with particular emphasis on African
issues and concerns. It is both a centre for research excellence and a home for stimulating public
engagement. SAIIA’s research reports present in-depth, incisive analysis of critical issues in Africa
and beyond. Core public policy research themes covered by SAIIA include good governance and
democracy; economic policymaking; international security and peace; and new global challenges
such as food security, global governance reform and the environment. Please consult our website
www.saiia.org.za for further information about SAIIA’s work.

                 ABOUT THE WITS SCHOOL OF GOVERNANCE

The Wits School of Governance at the University of Witwatersrand, which opened in 1993 as
the Graduate School of Public and Development Management, is considered the leading
academic institution in Africa within the arena of public policy and development. The School of
Governance works closely with international institutions, governments and NGOs across Africa.
It supports national and local policy development, the establishment of governance frameworks
and institutional arrangements, enhancing management systems, strengthening service delivery,
strategic planning, public finance mechanisms and monitoring and evaluation. Its main clients are
government institutions from the SADC countries and beyond. It also hosts the Anglophone Africa
Regional Centre for Learning on Evaluation and Results (CLEAR-AA), which aims to build the capacity
of institutions in developing countries for monitoring and evaluation and performance management.
The Wits School of Governance has a reputation for contributing to the intellectual discourse within
the public sector of South Africa and the broader African continent, and for training numerous civil
servants and leaders in Africa's public administration and development across all sectors.

Project manager: Neissan Besharati, Neissan.Besharati@wits.ac.za

© SAIIA & Wits School of Governance May 2014
All rights are reserved. No part of this publication may be reproduced or utilised in any form by any means,
electronic or mechanical, including photocopying and recording, or by any information or storage and retrieval
system, without permission in writing from the publisher. Opinions expressed are the responsibility of the individual
authors and not of SAIIA or the Wits School of Governance.

Cover photograph credit: Neissan Alessandro Besharati.
Unless otherwise stated, all the photographs in this report are © Neissan A. Besharati.
Cover photograph caption: Grade 12 learners in Matsibe school, Limpopo Province writing the
National Senior Certificate examination in 2013.

ISBN: 978-1-919969-85-5

Please note that all currencies are in US$ unless otherwise indicated.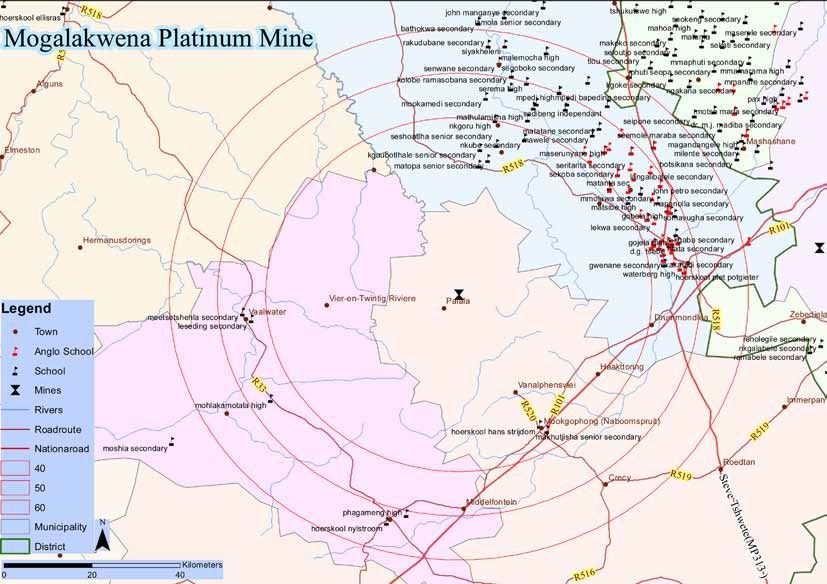
Contents

About the Author and the Development Effectiveness Project            4
Acknowledgements                                                      5
Abbreviations and acronyms                                            6
Abstract                                                              7

Chapter 1: Background                                                  8
  The role of platinum in South Africa’s socio-economic development    8
  Snapshot of the education sector in Limpopo and North West          12
  Education interventions by Anglo American Platinum                  18

Chapter 2: Research Design and Methodology                            22
  Key questions                                                       22
  Qualitative field visits and local informants                       22
  Data preparation                                                    24
     Confounding interventions                                        25
     Outcome data: NSC results                                        25
     School administrative and demographic data                       26
     Final data cleaning and rendering                                28
  Impact evaluation techniques                                        28
     Regression analysis                                              29
     Quasi-experimental design                                        29
     Measuring effectiveness                                          33

Chapter 3: Evaluation Findings                                        36
  Results from qualitative assessment                                 36
      Selection issues                                                36
      Implementation challenges                                       38
      Strategy, co-ordination and alignment with government           40
      Teachers are top!                                               41
      Leadership, management and accountability                       42
      Unintended impact of the mines                                  42
  Results of the econometric analysis                                 43
      Interpretations, explanations and theories                      45
  Results of quasi-experimental evaluation                            46
      Problems with cut-off-point design                              46
      The ‘proximity to mine’ effect                                  49
      Impact of Anglo American Platinum’s education programme         52
  The evaluation paradox                                              55
      Problems with CSI programme designs and evaluations             58

Chapter 4: Conclusions                                                59
  Bottom line for Anglo American Platinum                             59
  Lessons learnt and recommendations                                  60
  Follow-up research                                                  62

Appendices                                                            63
Endnotes                                                              74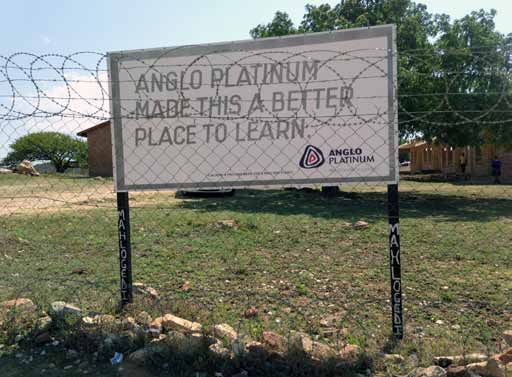
DEVELOPMENT EFFECTIVENESS PROJECT

                           ABOUT THE AUTHOR

Neissan Alessandro Besharati is the lead researcher and manager of the Development
Effectiveness Project of SAIIA and the Wits School of Governance, where he also lectures.
He is an associate of the Anglophone Africa Regional Centre for Learning on Evaluation and
Results (CLEAR-AA) and works with numerous international development think tanks.
He provides regular policy advice to bilateral and multilateral donors, corporate investors
and different departments of the South African government. His areas of expertise include
monitoring and evaluation, international co-operation, development policy and corporate
social investments. His current area of enquiry is school improvement in South Africa.
After working for 10 years with the UN and various NGOs in developing and post-conflict
countries, he returned to South Africa to dedicate himself to policy-oriented research.
He holds a Masters from the University of New South Wales, and is completing his
doctorate at the University of the Witwatersrand.

ABOUT THE DEVELOPMENT EFFECTIVENESS PROJECT

The Development Effectiveness Project (DEP) is a joint programme of SAIIA and the Wits
School of Governance. It aims to explore the current international development landscape,
with its variety of diverse financing mechanisms, approaches, partnership modalities and
institutional players, and to gather empirical evidence on what works in development and
poverty alleviation in Africa. The DEP aims to develop frameworks, methodologies and
instruments for the monitoring, evaluation and analysis of the impact and effectiveness
of different development interventions and development partners operating on the
continent. The current focus of the research is on two main policy streams namely
1) south–south co-operation and emerging economies; and 2) the role of the private sector
in development.

                        S A I I A R E S E A R C H R E P O R T N U M B E R 16

                                                4
I M PA C T O F M I N I N G I N V E ST M E N TS O N E D U C AT I O N O U TC O M E S I N S A

                           ACKNOWLEDGEMENTS

This report is the product of joint research by SAIIA and the Wits School of Governance,
with input from the Wits schools of Education, Economics and Statistics. The research
was implemented in close collaboration with the Council for Quality Assurance in
Education (Umalusi), the provincial governments of Limpopo and North West, the
national Department of Basic Education, the Department for Performance Monitoring
and Evaluation in the Presidency, Statistics South Africa (StatsSA), and various other
institutions which kindly made data available to the research team. The research team also
thanks the various circuit managers, principals and teachers of the numerous schools in
Limpopo and North West for their co-operation and for providing valuable inputs during
the field visits.
    This study was made possible thanks to the generous financial support of Anglo
American Platinum’s Community Engagement and Development business unit, and
smaller contributions by Anglo American Chairman’s Fund, First Rand Foundation and
iBurst. The team is grateful to Prof. M Muller, Prof. I Abedian and Prof. A McLennan
for their feedback and advice on content and methodology. Finally, this study was made
possible by the hard work of research assistants, Khotso Tsotsotso and Mpho Nthlola,
who provided support in the field work, data cleaning and editorial stages of the project.

                          S A I I A R E S E A R C H R E P O R T N U M B E R 16

                                                  5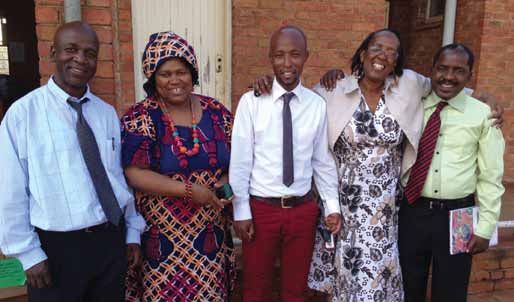
DEVELOPMENT EFFECTIVENESS PROJECT

            A B B R E V I AT I O N S A N D AC R O N Y M S

BEE       black economic empowerment
CEA       cost-effectiveness analysis
CED       Community Engagement and Development
CSI       corporate social investments
DBE       Department of Basic Education
DID       difference-in-difference
EMIS      Education Management and Information Systems
FET       Further Education and Training
GIS       geographic information system
HDSA      historically disadvantaged South Africans
HOD       head of department
LTSM      Learning and Teaching Study Material
M&E       monitoring and evaluation
MEC       Member of the Executive Committee
MoU       memorandum of understanding
MST       maths, science and technology
NSC       National Senior Certificate
NGO       non-governmental organisation
PSM       propensity score matching
SLP       social and labour plans
SMD       standardised mean difference
SPSS      Statistics Package for the Social Sciences
StatsSA   Statistics South Africa
RBI       Royal Bafokeng Institute
RDD       regression discontinuity design
Umalusi   Council for Quality Assurance in Education
Wits      University of the Witwatersrand

                    S A I I A R E S E A R C H R E P O R T N U M B E R 16

                                            6
I M PA C T O F M I N I N G I N V E ST M E N TS O N E D U C AT I O N O U TC O M E S I N S A

                                         ABSTRACT

P    latinum mining is a major engine of South Africa’s economy, producing exports and
     generating employment for many South Africans. It is, however, highly dependent
on skilled labour, engineers and technicians, who are drawn from the limited pool of
graduates emerging from the weak South African schooling system. Public-private
partnerships have been established to address this gap. This study looks at the delivery,
effectiveness and impact of the ZAR1 100 million (about $14 million) Anglo American
Platinum education programme implemented in the Limpopo and North West provinces to
improve learning outcomes in public schools, particularly in the critical subjects of maths
and science. The study utilises a rich pool of data and combines qualitative, econometric,
meta-analytical and quasi-experimental methods of evaluation, while engaging several
institutions and stakeholders in the process. The research reveals some surprising findings
with regard to the effects that mines have on learning results in surrounding schools
and affected communities. The study re-affirms many current theories and raises new
questions with regard to the role of educators, the impact of interventions, socio-economic
factors, and other aspects affecting the school system. Moreover, the report illustrates some
of the problems and shortfalls of development evaluation common practices. The findings
provide useful inputs for the policies, programmes and investments of the government
and corporate sector in addressing education and development challenges in South Africa.

                          S A I I A R E S E A R C H R E P O R T N U M B E R 16

                                                  7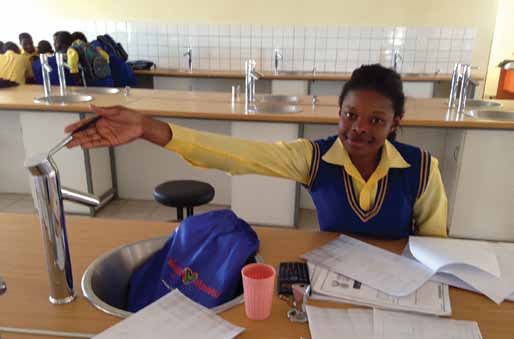
DEVELOPMENT EFFECTIVENESS PROJECT
CHAPTER 1
B ACKGROUND
T H E R O L E O F P L AT I N U M I N S O U T H A F R I C A’ S
SOCIO-ECONOMIC DEVELOPMENT
M ining plays a central role in South Africa’s history, economy and social structures.
Migration to urban areas, the wide divide between capital and labour (mostly drawn
on racial lines) and the extreme social inequalities that fuelled the apartheid system are
intrinsically linked to the mining industry. Even the rise of the metropolis of Johannesburg
and the township of Soweto took place on the back of the ‘Witwatersrand Gold Rush’ of
the late 1800s. Although less dominant than in the previous century, the mining sector
still generates up to 18% of the nation’s gross domestic product. It also provides direct
employment to over 500 000 people and indirect employment to another 1 million
South Africans.2
South Africa has large deposits of numerous minerals, ranging from chromium, iron
ore, diamonds, palladium and gold to coal, from which most of the country’s energy is
produced. However, since 1990 platinum has emerged as the largest component of South
Africa’s mining sector 3 with around 130 tonnes of output a year. This grew by 67% from
1994 to 2009.4 South Africa holds 80 to 90% of the world’s platinum reserves.5
The Merensky Platinum Reef stretches from southern Zimbabwe, through Polokwane
all the way to the Rustenburg region, with the largest concentration around the Bushveld
Complex in the Bojanala district. Since the early 1900s this complex has attracted
major platinum corporations such as Anglo American, Impala, Lonmin and Bafokeng
Rasimone Mines. Another platinum-rich area is the Twickenham Reef in the Sekhukhune
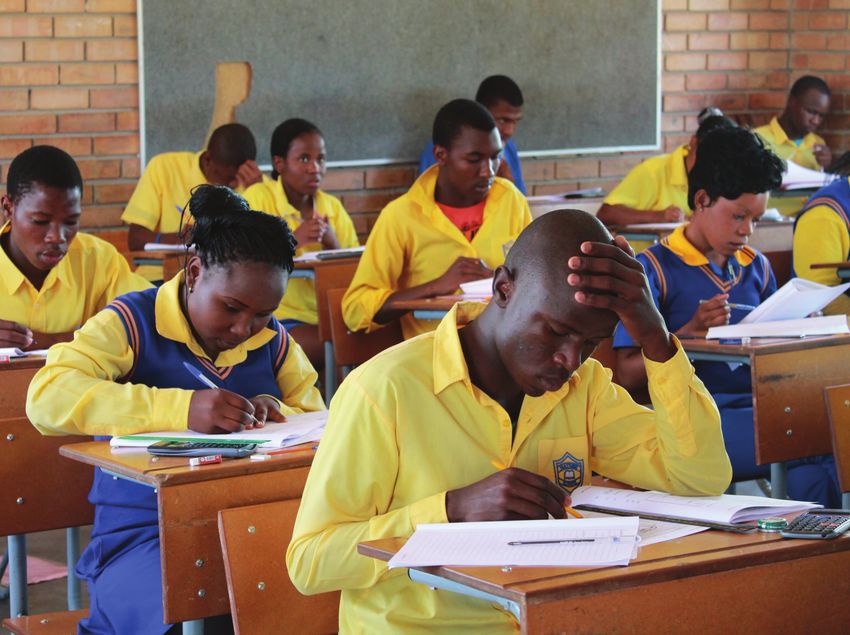
district, situated roughly 100 km south-east of Polokwane. The map in Figure 1 indicates
the locations of some of the major platinum projects in the Limpopo and North West
provinces.
S A I I A R E S E A R C H R E P O R T N U M B E R 16
8
I M PA C T O F M I N I N G I N V E ST M E N TS O N E D U C AT I O N O U TC O M E S I N S A

Figure 1: Locations of platinum deposits in northern South Africa

                                                                                                     MPUMALANGA
         Polokwane

                                                   deposits
                                                   Platinum

                                                                                                                                    Emalahleni
                     Mokopane

                                                                  Bela Bela

                                                                                           GAUTENG
                                         LIMPOPO

                                                                                                                         Pretoria
                                                                              NORTH WEST

                                                                                                        Brits
                                                                                                            Rustenburg

Source: Author’s own compilation; map data: Tom-Tom, 2013

                                S A I I A R E S E A R C H R E P O R T N U M B E R 16

                                                              9
Boikgantsho Project Polokwane
Bushveld complex
Mogalakwena Mine
Project (JV) Mokopane
Polokwane
Operation (100% owned) Smelter
Operation (JV)
Bokoni Platinum Mine
Project (100% owned)
Ga-Phasha Project
Process (100% owned) Twickenham Platinum Mine
Smelter
Bela Bela Modikwa Platinum Mine
Dishaba Mine
Tumela Mine LIMPOPO
10
Mortimer Mototolo Platinum Mine
Union Mine
Smelter Der Brochen Project
Magazynskraal Project
Zandspruit Agreement
NORTH WEST Precious Metals Refiners
Rustenburg Base Metal Refiners
S A I I A R E S E A R C H R E P O R T N U M B E R 16
DEVELOPMENT EFFECTIVENESS PROJECT
BRPM and Waterval Smelter
Sheba’s Ridge
Figure 2: Anglo American Platinum operations in northern South Africa
Khomanani Mine Pandora Project GAUTENG
Project
Thembelani Mine
Khuseleka Mine
Bathopele Mine MPUMALANGA
Kroondal Mine
Source: Anglo Platinum, http://www.angloplatinum.com/sus/overview/operations.asp, 2013
Siphumelele Mine Pretoria
Marikana Mine
EmalahleniI M PA C T O F M I N I N G I N V E ST M E N TS O N E D U C AT I O N O U TC O M E S I N S A
South African platinum production is mainly geared towards international exports,
which have been growing since early 2000,6 driven by demand from the European
automotive, medical and chemical industry7 and by the growing Chinese jewellery
manufacturing industry.8 Nonetheless, due to the increasing cost of labour and electricity
in South Africa9 platinum prices have remained stagnant, with expansion projects put on
hold and the potential threat of mine closures ever present. The labour situation badly
deteriorated during the course of 2012 and 2013, with massive retrenchments, strikes,
worker unrest, union fragmentation, violence and even murder leading to the 16 August
2012 ‘Marikana massacre’, which made international headlines when 34 miners were
killed in clashes with the police.
Like the rest of the mining industry, the platinum houses of South Africa are regulated
by the Mineral and Petroleum Resources Development Act, which is aimed at minimising
economic turbulence and natural resource depletion. The Act also makes provision for
human resource issues such as employment equity, health, work safety and mine workers’
living conditions. The Department of Mineral Resources grants licences and the rights
to mineral exploration and production to private companies on certain socio-economic
and environmental conditions (eg, black economic empowerment [BEE] requirements)
that need to be fulfilled in and around mining operations.10 An intrinsic part of these
requirements is the development of social and labour plans (SLPs) detailing how the
companies deal with human resources (employment equity, retrenchment, housing, skills
development, etc.) and support the social, economic and infrastructure development of
the communities around the mines. These SLPs are generally developed in a participatory
manner through ethnographic techniques and by engaging the numerous local
stakeholders (community groups, local government, traditional authorities, labour unions,
NGOs and other civil groups) through consultative forums. SLPs are generally supposed
to be aligned with the Integrated Development Plans of the specific localities.
Another impetus to aligning the mining sector with the country’s transformation
process was the introduction of the BEE policy by the Department of Trade and Industry,11
aimed at transferring 25% of the country’s productive assets to black ownership. BEE
favours historically disadvantaged South Africans (HDSAs) in the areas of shareholding,
management, staff, skills development and the procurement of sub-contractors. BEE
compliance was a primary determinant in whether companies were granted conversion
from the old to the new order rights under the Mineral and Petroleum Resources
Development Act. Within the BEE framework, the Mining Charter (developed in 2004 and
updated in 2010) also provides higher scorecards to companies that ensure sustainable
environmental management, facilitate local beneficiation of commodities and resources,
and support local community development activities.
The last decade saw the intensification of ‘sustainability reports’ by South Africa’s
private sector to highlight companies’ contributions to the welfare of the country and
relevant communities. This has resulted in major mining houses such as Anglo American
Platinum, Kumba, Impala, De Beers and BHP Billiton spending over ZAR 100 million
every year on corporate social investments (CSI).12 Community investments by mining
corporations in South Africa are implemented for a variety of reasons and motivations,
including securing social licences, maintaining good relations with local stakeholders,
improving BEE scorecards, marketing and enhancing public image, and genuine
philanthropic efforts aimed at making a positive change in society. In recent years, CSI
S A I I A R E S E A R C H R E P O R T N U M B E R 16
11DEVELOPMENT EFFECTIVENESS PROJECT
approaches have also been more pragmatic, driven by ‘enlightened self-interest’, stemming
from a realisation that having a healthy, educated, uplifted and prosperous local community
is ultimately also good for business. By the same token, almost 92% of corporations in
South Africa invest in education, because a knowledgeable and skilled population will
enhance the workforce, clientele and quality of private sector service providers, and thus
produce long-term returns for business. Overall, the local corporate sector’s financing
of South Africa’s education sector surpasses by and large official development assistance
from all the traditional bilateral and multilateral donors.13 Just one company, such as
Anglo American, spends more every year on social and education projects than the likes
of the World Bank, the UN, the Japanese International Co-operation Agency, the Canadian
International Development Agency, the United Kingdom’s Department for International
Development, and other foreign aid agencies operating in South Africa.
S N A P S H OT O F T H E E D U C AT I O N S E C TO R I N L I M P O P O
AND NORTH WEST
As discussed in previous papers,14 the mining and service sectors (financial, logistical,
telecommunications, retail) are the foundations of the South African economy. However,
the country is not able to meet the high demand for engineers, financial analysts and
technical specialists required by the key sectors to run the economy and allow for further
growth. There are not enough young South Africans entering and completing university
degrees in technical fields. This is mostly due to the poor performance of the South
African secondary education system, which is not able to produce enough learners with
the minimum competencies in maths and science. Roughly 4% of South African learners
Grade 12 learners in Matsibe Secondary School, Limpopo, writing the 2013 NSC examination
S A I I A R E S E A R C H R E P O R T N U M B E R 16
12I M PA C T O F M I N I N G I N V E ST M E N TS O N E D U C AT I O N O U TC O M E S I N S A
who start grade 1 finish grade 12 with a pass rate above 40% in maths.15 An older study16
explained that of the total number of learners enrolling in grade 1 in the new post-1994
South African education dispensation, only 1.5% achieved a pass in higher grade (HG)
maths during their 2006 grade 12 Senior Certificate (SC) exams. This poses a serious
challenge for the mining industry, which needs to invest in education in order to increase
and improve the labour pool of future technicians, artisans and engineers. Due to the
national socio-economic transformation processes discussed earlier, it is imperative that
mining companies pay special attention to sourcing future employees from their areas of
operation, focusing on the black population and the indigenous communities affected
by mining. Yet mining companies have reported that they struggle to award university
scholarships and bursaries to youths from the communities around their operations.17
It would thus be appropriate to start looking at the academic performance of schools in
the areas where the platinum mining operations occur, namely Limpopo and North West,
particularly in the subject areas of maths and science.
The results from the National Senior Certificate (NSC) examination, undertaken at the
end of grade 12 in all South African secondary schools, are potentially the best indicator
to measure learner achievement and the progress of schools and regions. NSC exams are
independently assessed by the central agency of Umalusi, using a universal system. Data
is checked for quality and made available annually at micro level.
Figure 3: Overall and bachelor pass rates for NSC examination in South Africa
80%
70%
% of learners passing
60%
50%
40%
30%
20%
10%
0%
2008 2009 2010 2011 2012
Overall pass 60% 58% 65% 67% 69%
Bachelor pass 17% 17% 20% 21% 22%
Source: Author’s own compilation, 2013
The downfall of using the NSC examination results as the main indicator for progress in
learning is that external interventions, schooling and social factors have less of an impact
on older and formed pupils than on younger children. It is a well-documented fact in
education and developmental literature that the greater percentage of learning gains occur
at lower grades,18 rather than at the end of the formal schooling process. Nevertheless,
S A I I A R E S E A R C H R E P O R T N U M B E R 16
13DEVELOPMENT EFFECTIVENESS PROJECT
the NSC provides a good indication of learner ‘preparedness’ for university and tertiary
training in the commercial, technical and engineering subjects desperately needed by
most businesses and the national economy. Aside from the overall NSC pass rates, of
particular interest are the ‘bachelor passes’ that allow for university entry. As the NSC
examination system changed between 2007 and 2008, the current graphs try to capture
the progress in the overall and bachelor pass rates in the relevant regions from 2008 to
2012, in relationship to the overall country average.
Figure 4: Overall and bachelor pass rates for NSC exam in North West and Limpopo
North West
90%
80%
70%
% of learners passing
60%
50%
40%
30%
20%
10%
0%
2008 2009 2010 2011 2012
Overall pass 68% 68% 74% 77% 78%
Bachelor pass 19% 20% 26% 26% 25%
Limpopo
90%
80%
70%
% of learners passing
60%
50%
40%
30%
20%
10%
0%
2008 2009 2010 2011 2012
Overall pass 53% 49% 58% 64% 66%
Bachelor pass 10% 11% 14% 17% 18%
Source: Author’s own compilation, 2013
S A I I A R E S E A R C H R E P O R T N U M B E R 16
14I M PA C T O F M I N I N G I N V E ST M E N TS O N E D U C AT I O N O U TC O M E S I N S A
Figure 4 shows that schools in North West tend to perform above the national average,
while schools in Limpopo generally perform slightly below the national average, most
likely due to the different socio-economic conditions in rural areas that differentiate these
two provinces. Due to the presence of mining operations in the Bojanala district, North
West receives a lot of attention and is the focus of various initiatives by public and private
institutions. Limpopo manages three to four times more schools than North West and thus
its limited educational resources are spread thinner.
Figure 5: Subject specific (maths & physics) pass rates for NSC exam in South Africa
70%
60%
% of learners passing
50%
40%
30%
20%
10%
0%
2008 2009 2010 2011 2012
Maths
49% 44% 42% 35% 35%
participation
Maths pass 52% 54% 53% 54% 56%
Maths excel 17% 17% 20% 21% 22%
70%
60%
% of learners passing
50%
40%
30%
20%
10%
0%
2008 2009 2010 2011 2012
Physics
37% 38% 37% 35% 33%
participation
Physics pass 54% 36% 47% 53% 58%
Physics excel 14% 9% 16% 18% 21%
Source: Author’s own compilation, 2013
S A I I A R E S E A R C H R E P O R T N U M B E R 16
15DEVELOPMENT EFFECTIVENESS PROJECT
Figure 6: Subject specific (maths & physics) pass rates for NSC exam in North West
70%
60%
% of learners passing
50%
40%
30%
20%
10%
0%
2008 2009 2010 2011 2012
Maths
49% 44% 42% 35% 35%
participation
Maths pass 52% 54% 53% 54% 56%
Maths excel 23% 20% 19% 17% 20%
70%
60%
% of learners passing
50%
40%
30%
20%
10%
0%
2008 2009 2010 2011 2012
Physics
40% 38% 38% 32% 32%
participation
Physics pass 65% 39% 51% 57% 61%
Physics excel 15% 10% 17% 20% 21%
Source: Author’s own compilation, 2013
Figures 5, 6 and 7 focus on the ‘gateway subjects’ of maths and the physical sciences, due
to their importance to both the economy and the mining industry. Close attention will
again be paid to the subject passes above 50% (excel), the minimum entry to university.
However, studies19 have shown how with the introduction of the new NSC system,
grades above 60% in maths seem to predict more accurately satisfactory performances at
university level for students in commercial and scientific subjects.
What might be surprising to international readers is that a minimum score of 30%
is sufficient to pass the NSC grade 12 exams in the specific subject areas, highlighting
the general poor quality of the South African education system. NSC pass rates are also
S A I I A R E S E A R C H R E P O R T N U M B E R 16
16I M PA C T O F M I N I N G I N V E ST M E N TS O N E D U C AT I O N O U TC O M E S I N S A
masked by the fact that many South African learners drop out of school before they write
the exam. In public schools the number of grade 12 learners is on average half the number
of grade 10 learners. In Figures 5, 6 and 7, maths and science participation relates to the
percentage of learners writing the NSC who chose to take those specific subjects as part
of their examination.
Figure 7: Subject specific (maths & physics) pass rates for NSC exam in Limpopo
70%
60%
% of learners passing
50%
40%
30%
20%
10%
0%
2008 2009 2010 2011 2012
Maths
56% 55% 51% 47% 43%
participation
Maths pass 38% 39% 38% 44% 49%
Maths excel 13% 11% 11% 14% 16%
70%
60%
% of learners passing
50%
40%
30%
20%
10%
0%
2008 2009 2010 2011 2012
Physics
38% 43% 41% 41% 38%
participation
Physics pass 50% 30% 40% 52% 57%
Physics excel 9% 5% 11% 15% 17%
Source: Author’s own compilation, 2013
These graphs confirm trends that are familiar to some readers. Over the years there has
been a gradual and expected increase in the general pass rates, as well as in the bachelor
S A I I A R E S E A R C H R E P O R T N U M B E R 16
17DEVELOPMENT EFFECTIVENESS PROJECT
passes. In early 2011 the Minister of Basic Education, Angie Motshekga, announced that
despite the ‘lost time’ in 2010 due to the FIFA World Cup and the teacher and learner
strikes that occurred that year, there had been a surprising spike in pass rates across the
country. The big dip in the 2009 science passes was confirmed by Umalusi and explained
by the fact that the exam’s science paper was particularly difficult, resulting in a drop in
science passes that year. There is an interesting correlation between the gradual reduction
in the number of learners writing the maths and science exams and the increase in the
pass rates in those subjects. This can be ascribed to stricter learner selectivity, a smaller
teacher-to-learner ratio and the better spread of learning resources.
All of these are important general trends that need to be borne in mind when
undertaking impact assessments of specific interventions that have been implemented in
the two provinces to improve maths and science learning outcomes. This is to ensure that
general social, economic and environmental trends do not confine or distort the results of
the impact evaluation.
E D U C AT I O N I N T E R V E N T I O N S BY A N G LO A M E R I C A N P L AT I N U M
Several big mining houses in South Africa undertake extensive CSI programmes in
education, among which are Kumba, Impala, BHP Billiton, De Beers and Rio Tinto.
However, this study will focus mainly on the education interventions of Anglo American
Platinum in North West and Limpopo between 2009 and 2012. Anglo American Platinum
is by far the largest platinum producer in South Africa, producing 40% of the world’s
platinum output and employing over 50 000 people every year. Previously known as
Johannesburg Consolidated Investments and then Amplats before becoming Anglo
American Platinum, the company has been undertaking education interventions since the
1990s, as revealed by a 1999 report by Eric Scholar and Associates evaluating its school
development programme, which features are not drastically different to what it is today.
Together with Kumba, Anglo American Platinum manages the largest corporate social
investment budget in the Anglo American group. Within its Corporate Affairs division,
the company established the Community Engagement and Development (CED) sub-unit,
which deals with the mines’ multiple stakeholders and develops, finances, implements and
monitors socio-economic development programmes in local communities.
The current Anglo American Platinum education programming is based on its
2010–2014 SLP, which the company negotiated with the communities, local government
authorities and other stakeholders affected by its mining operations in Magalakwena,
Amandelbult, Union, Rustenburg, Twickenham and Der Brochen. These included local
tribal groups in North West and Limpopo, such as the Bafokeng, Bengwenyama and Langa
Mapela. Some of the labour-sending areas in the Eastern Cape such as OR Tambo District
Municipality and the Taung community also form part of Anglo American Platinum’s
SLP. The community development activities to which Anglo American Platinum has
committed itself are extensive and range from projects for health and welfare, poverty
reduction, agricultural development and job creation to the establishment of basic
community infrastructure. Within the SLP, education and skills development initiatives
play a significant role. Shortly after finalising its SLP, Anglo American Platinum signed a
memorandum of understanding (MoU) with North West and the Limpopo Department
S A I I A R E S E A R C H R E P O R T N U M B E R 16
18I M PA C T O F M I N I N G I N V E ST M E N TS O N E D U C AT I O N O U TC O M E S I N S A
of Education, through a North West Department of Education member of the executive
committee (MEC) and the Limpopo head of department (HoD) of Education, in order to
implement its whole school development programme. As the programme unfolded, Anglo
American Platinum’s local CED officials regularly liaised with district and circuit managers
closer to the areas affected by the mines, and collaborated in the implementation of Anglo
American Platinum’s support activities to local schools.
A major part of Anglo American Platinum’s infrastructure support has gone towards
building or rehabilitating schools, extending classrooms and constructing administration
blocks, toilets, and water and sewerage facilities for education centres close to the mining
areas. This has included refurbishing libraries, outfitting science labs and donating
computers, photocopiers and other equipment to schools and even circuit offices. During
the past five years over ZAR 25 million (about $2.4 million) worth of infrastructure
initiatives have been implemented in schools around the mines. Of greater interest,
however, are Anglo American Platinum’s education, skills development and youth-targeted
initiatives, which have seen nearly ZAR 70 million (about $6.7 million) budgeted for the
SLP timeframe. The company’s education programme is extensive and covers many areas,
including adult education and literacy (ABET), early childhood development, primary
and general education training, special needs schools, bursaries for university students,
apprenticeships, and technical and professional development for young professionals.
This study will focus on Anglo American Platinum’s further education and training
(FET) interventions in secondary schools, as it is easier to correlate development outcomes
for beneficiaries with the results of the NSC examinations in the two provinces, for
Placard in front of Mahlogedi Secondary School in Limpopo, where Anglo American Platinum
undertook renovations and infrastructure enhancements
S A I I A R E S E A R C H R E P O R T N U M B E R 16
19DEVELOPMENT EFFECTIVENESS PROJECT
which more reliable and detailed data is available. Some of the Anglo American Platinum
interventions analysed are learner focused and some are educator focused, while others
involve the provision of learning and teaching study materials (LTSM), or a combination
of the above. Based on documentation and reports retrieved from the company and its
service providers, a brief overview is provided of the major FET interventions Anglo
American Platinum implemented between 2009 and 2012. Table 1 provides summaries of
the projects’ features, the costs and number of beneficiaries involved, the service providers
responsible and the theory of change upon which these interventions were based.
Table 1: Anglo American Platinum’s FET interventions to improve maths and
science results
Supplementary Saturday The Radical Math & Science company has been providing
classes these classes since 2003 in the Rustenburg district, and in
2009 the classes were expanded to the operation areas
of Atok, Polokwane, Mokopane and Swartklip. After an
initial test and selection process, around 400 grade 10, 11
and 12 learners were selected to be part of the ‘A team’,
which took additional classes in maths, physical sciences
and business and social skills (including English). About 40
learners were grouped in each area of operation and met
on Saturdays for half a day, receiving coaching, additional
study guides and prizes for best performance. In 2010 the
contract for the Saturday supplementary classes was given
to the Star Schools NGO, which trained 600 grade 12
learners from all the operations in maths, science
and English.
Winter enrichment camps Special workshops were organised during the school
holidays for over 900 learners from the schools around
the various Anglo operations. The programme focused
on maths, physical sciences, English and geography. Extra
classes run by local educators normally lasted for five days,
and were aimed at addressing some of the content gaps
faced by learners due to the poor quality of teaching in
their schools, and the difficulties they faced in covering the
ambitious syllabus required for the grade 12 examination.
The winter schools provided study guides, study materials
and example questions from the exams, as well as pre-
and post-assessments of the learners. These holiday camps
were organised in 2011 and 2012 by Radical Math &
Science, usually in three to five different venues across
the two provinces, while accommodation, catering and
transport were organised by the various mines.
S A I I A R E S E A R C H R E P O R T N U M B E R 16
20I M PA C T O F M I N I N G I N V E ST M E N TS O N E D U C AT I O N O U TC O M E S I N S A
Educator training This consisted of a programme offered by the Centre for
Research and Development in Mathematics, Science and
Technology Education (Radmaste Centre) at the University
of the Witwatersrand (Wits), involving a two-week workshop
during the winter holidays for 60 teachers from 27 schools
from across the Anglo operations. The course focused on
content knowledge in maths, science and accounting to
give educators more confidence in the subjects they were
teaching. The workshop was hands on and interactive,
and followed the official Department of Education
curriculum. It was followed by a two-day follow-up session
in September. The programme started in 2012 and was
officially supposed to run for three years (up to 2014), but
the initial plan was cut short due to the Marikana incident
and the subsequent disruptions and financial crisis in the
platinum industry. The programme was intended to give
inadequately trained teachers supplementary in-service
training from a reputable teacher-training tertiary institution.
Source: Author’s own compilation, 2013
Aside from these major interventions implemented directly by Anglo American Platinum
through private companies, NGOs and educational institutions, the company supported
the flagship initiatives of the government by, for example, providing over ZAR 1 million
($140,000) in maths and science equipment to all the Dinaledi20 schools of the North West.
Most of these interventions were well documented, with basic information available
on the implementation of activities, including information on participants and the
progress they made through pre- and post-learning assessments. As the evaluations were
produced mostly by the service providers running the projects, assessments overall tend
to be positive, subjective and more reliant on qualitative methods to judge achievement
of activities and outputs. Programme logic and results frameworks are less explicitly
illustrated in the reports, therefore leaving readers to infer the theory of change, which
otherwise is fairly simple and straightforward for each of the above interventions.
Different schools benefitted from different projects (eg, teacher training, winter schools,
infrastructure, etc.) by different service providers (Star Schools, Radical, Radmaste, etc.)
and in different dosages (ie, number of learners and teachers participating). The research
team endeavoured to gather as much information as possible through primary and
secondary sources, consolidated all the activities and identified 137 schools in Limpopo
and North West that received some kind of support from Anglo American Platinum over
the last five years. In the following analysis these will be considered the ‘Anglo-treatment
schools’, converted into a dummy variable of ‘Anglo yes’.
S A I I A R E S E A R C H R E P O R T N U M B E R 16
21DEVELOPMENT EFFECTIVENESS PROJECT
CHAPTER 2
R E S E A R C H D E S I G N A N D M E T H O D O LO GY
KEY QUESTIONS
E merging from discussions with Anglo American Platinum, its service providers, other
mining companies, education authorities and other stakeholders affected by the
platinum mines, the following are some of the questions that guided the research team in
their enquiry on the impact of the mining sector’s education interventions.
• Were the education projects implemented according to plan? Were the beneficiaries
and partners satisfied? Did the right stakeholders and groups benefit from the
interventions?
• What impact did the presence of the mine have on schools in North West and
Limpopo?
• Has the Anglo American Platinum education programme been effective in improving
learning outcomes and pass rates (particularly maths and science) in the targeted
schools?
• What can be improved in future education investments and how can greater impact be
achieved?
• What important lessons can the mining industry and other corporate social investors
learn from the successes and failures in addressing education gaps in South Africa?
• What have been the most successful interventions to improve learning results that
should be replicated and scaled up? What provides the best value for money when
addressing education outcomes in South Africa?
These questions were investigated from the standpoint of an independent evaluation team
from Wits University that did not have any particular stake in the outcome of the study. As
most interventions have already occurred, the evaluation was ex-post and used rigorous
scientific and empirical methods of enquiry. The study was the first to pilot21 an evaluation
model and methodology framework, which consisted of a combination of participatory
mixed methods, theory-based quasi-experimental impact evaluations, cost-effectiveness
analysis and meta-analytical techniques. The purpose was to inform government and
corporate strategic planning, improve education policies and systems, and guide future
investments.
Q U A L I TAT I V E F I E L D V I S I T S A N D LO C A L I N F O R M A N T S
The methodological framework used for this study22 relies heavily on quantitative
approaches such as quasi-experimental evaluation. Nevertheless, the research team
S A I I A R E S E A R C H R E P O R T N U M B E R 16
22I M PA C T O F M I N I N G I N V E ST M E N TS O N E D U C AT I O N O U TC O M E S I N S A
decided to begin the enquiry by integrating classical field visits, although this was not as
rigorous and systematic as a full-fledged qualitative study. However, it was important to
better understand the context, identify the various interventions implemented, unpack the
theories of change, analyse the factors influencing outcomes, and uncover insights and
information that would otherwise be difficult to gauge from a purely quantitative analysis
and desktop review.
The study began with two months (October and November 2013) of intense field
immersion in Limpopo and North West to the sites and schools around the platinum
mining operations. This involved the direct observation of a sample of 22 schools that
received significant support from Anglo American Platinum in Rustenburg, Moses Kotane
East, Thabazimbi, Leboagomo, Mokopane, Sekukune and other areas. The school visits,
interactions with stakeholders and contextual analyses were enriched by the fact that the
evaluation team consisted of individuals of different local and international cultural and
linguistic backgrounds, which provided fresh perspectives on the issues being observed.
During the field visits, semi-structured interviews and focus group discussions
were held with numerous stakeholders involved in maths and science interventions in
secondary schools in Limpopo and North West. These would typically consist of informal
conversations between the Wits–SAIIA research team and school principals, maths and
science educators, curriculum advisors, circuit managers and district managers. The team
tried to keep discussions relaxed, informal and non-threatening by ensuring confidentiality
under the ‘Chatham House Rule’23 and by not utilising recording devices. Conversations
with local education authorities and school management were usually guided by open
questions, such as those listed below.
• What are the factors that have had the biggest influence and impact on improved
learning results in your school/area?
• What interventions (by government, NGOs, donors and private companies) have
occurred in your area/school to improve maths and science results? What was the
theory behind these programmes?
• Have you received support from mining companies over the last five years? What
kind of assistance? How have these programmes been implemented? Have you been
satisfied with the results? Any feedback?
• What are the most pressing needs and most important aspects in the current education
system that need to be addressed in order to improve learning outcomes?
• What are the recommendations you have for mining companies on how they can
improve their programmes and make best use of their resources to increase maths and
science pass rates in your school/area?
The stakeholders with whom the research team interacted during the field trips in
Limpopo and North West are listed in Appendix 1. These include interviews in Gauteng
with national education authorities and managers of service providers implementing
maths and science programmes in the two provinces of interest. Shaded stakeholders refer
to the schools that received an on-site visit.
S A I I A R E S E A R C H R E P O R T N U M B E R 16
23DEVELOPMENT EFFECTIVENESS PROJECT
Research assistant Khotso Tsotsotso (middle) with a circuit manager and three school
principals in Mokgodumo, Limpopo
D ATA P R E PA R AT I O N
Considering the complex impact evaluation methods used in the study, large datasets had
to be compiled that combined data gathered by different institutions and from diverse
sources. Some of the data that needed to be merged included
• intervention information;
• NSC (matric) exam results; and
• school administrative, social & economic data.
The main units of analysis were ‘schools’, therefore all the datasets had to be merged
using the official school Education Management and Information Systems (EMIS) number
(a unique code used by the Department of Education to identify schools). This resulted
in an initial mega dataset with a total population of 1 412 schools in Limpopo and
385 schools in North West with which to conduct the subsequent statistical analysis.
Traditionally, in South Africa especially, a lot of the econometric and experimental
work in this genre is done by economists using Stata software. However, as the research
team consisted mainly of social scientists, the group chose to use the Statistics Package
for the Social Sciences (SPSS), which has a more user-friendly interface and does not
require much time to learn a whole new coding language. In order to accommodate
some of the more complex statistical analysis, such as propensity score matching,
R plugins were downloaded. In the process of managing and cleaning the data, software
such as Excel and Access was also used, especially when receiving data from Umalusi and
the Department of Education, but eventually these were all merged and converted into
SPSS data files.
S A I I A R E S E A R C H R E P O R T N U M B E R 16
24I M PA C T O F M I N I N G I N V E ST M E N TS O N E D U C AT I O N O U TC O M E S I N S A
Confounding interventions
Programme and project information included the type of activities, the beneficiary schools,
locations, time periods and implementation costs. This has been provided by Anglo
American Platinum and its service providers, as well as other organisations (government,
NGOs and private sector) implementing programmes to improve maths and science in
secondary schools. This information was extracted either from official reports or through
interviews with relevant officials.
The primary interventions under analysis are the Anglo American Platinum education
programmes implemented between 2009 and 2012. However, during this time frame many
other interventions occurred in Limpopo and North West to address the same outcome of
improving maths and science learning results in secondary schools. Although the scope
and resources of this study would not permit doing an impact evaluation on each and
every one of these programmes, the research team felt that it was important to be aware
of them and be able to control for these potentially confounding interventions in the
statistical analysis so as to isolate the effects of the Anglo American Platinum programme
from the effects of other interventions. Through the fieldwork in the two provinces and
interviews with school and education authorities, the research team was able to identify
some of the major interventions implemented to improve maths and science in secondary
schools (see Appendix 2).
While there certainly may be more maths and science interventions in North West
and Limpopo than the list contains, this is the extent to which the research team was
able to investigate through literature review and interactions with the relevant schools
and education authorities. Some of the bigger and more interesting interventions require
their own separate impact evaluation in the future, allowing for additional time, resources
and data.
These initiatives by various institutions might also have had an effect on the maths and
science results of the schools in the region, therefore the research team tried to control for
them during the statistical analysis and impact evaluation of the Anglo American Platinum
programme. When data was made available for external interventions, especially with the
specific schools affected, these interventions were turned into binary dummy variables.
A further dummy variable (ANY_intervention_Yes) was created indicating whether the
school received any intervention from any institution between 2008 and 2012.
Outcome data: NSC results
As discussed earlier, the main outcome indicator used to measure schools’ progress was
the NSC grade 12 exam results. Thanks to its close collaboration with Umalusi, the
research team was able to get detailed and accurate data for all the schools in Limpopo
and North West from 2008 to 2012. This included the number of learners who wrote
the exam, the overall pass rates and the quality of the pass rates in the specific subjects
of maths and physical sciences. Data on English (first additional language) passes was
also observed, as this is believed to correlate with the overall results and performance in
scientific subjects. Initially data was provided on the exact number of learners who wrote
and passed the exams with different marks, but this was later converted into percentages
for more appropriate and fair comparisons between schools of different sizes. Appendix 3
S A I I A R E S E A R C H R E P O R T N U M B E R 16
25DEVELOPMENT EFFECTIVENESS PROJECT
shows the intervention variables that were created by the research team for all the schools
in North West and Limpopo.
School administrative and demographic data
In order to undertake some of the econometric and complex matching operations and
have enough control variables (covariates) for the impact evaluation (see the following
sections), it was important to gather as much information as possible about each of
the schools in the dataset, including demographic, social and economic data, resource
availability, characteristics of learners and educators, management and other aspects.
This was gathered primarily through EMIS. Some data was also sourced through StatsSA
and the provincial EMIS offices. The EMIS data used was taken from the Annual School
Surveys. Since the information changed over the years, the EMIS data from 2010 was used
as a mid-reference point for when interventions were implemented.
The team was also cautioned that the EMIS data was not always accurate and
reliable, as schools sometimes under- or over-reported due to education funding and
resource allocation often being linked to school characteristics. This raised the risk of
misspecification errors. If the researchers were not sure about the usefulness or accuracy
of the data, such variables were often taken out of the analysis. In many instances the
research team had to cross-reference, check and undertake additional calculations,
transformations and re-coding of some of the variables during the data cleaning process.
Whenever possible, absolute numbers were converted into percentages (eg, of total
learners or teachers) in order to have a more useful variable with which to compare
schools of different sizes and to make the results easier to understand by the common
reader. The research team finally generated a mega-dataset of over 100 intervention,
outcome and school characteristics variables (as shown in Appendices 3, 4 and 5) for
each of the nearly 1 800 schools in the population of secondary schools in North West
and Limpopo used in the study.
From the field research it was evident that the school’s location could have a significant
impact on learning results, as each area received attention and support from different
external institutions, while each circuit and district education office also had different
officials with different levels of commitment and enthusiasm for new initiatives, which
could push results up. As the urban/rural data did not prove to be complete and accurate,
the other option was to convert the categorical variables of the locations into numerical
values. As the circuits were far too many and the provinces only two, the research
team decided to convert into dummy variables all 23 district municipalities, with each
containing between 10 (Kagisano Malopo in North West) and 233 schools (Capricorn in
Limpopo).
S A I I A R E S E A R C H R E P O R T N U M B E R 16
26I M PA C T O F M I N I N G I N V E ST M E N TS O N E D U C AT I O N O U TC O M E S I N S A
Figure 8: Calculating proximity to mining operations
latitude
A = (4, 5)
5
4
3 4
2
B = (1, 1)
1 (4, 1)
3
0 longitude
0 1 2 3 4 5 6
Source: Author’s own compilation, 2013
Another geographic factor discovered to have an impact on schools (see section on
findings) was their proximity to mining operations. In order to calculate the distance
(km) between schools and mines, and subsequently construct the dummy variable ‘50 km
from mines’, the geographic information system (GIS) co-ordinates (latitude/longitude)
of each school and platinum mine were gathered and a basic formula of trigonometry was
applied. Assuming a flat surface, a straightforward Pythagoras theorem could be used to
calculate the distance (d) between the mines (m) and the schools (s) as in:
2 2
d= (Latm − Lats) + (Lonm − Lats)
However, the surface of the earth is spherical and when calculating distances above
17 km, the Pythagoras formula becomes inaccurate and causes errors. A more precise
way to calculate the distance between the schools and platinum mines in North West and
Limpopo is through the Harversin formula:
d = 2r arcsin ( haversin(ø2 − ø1) + cos(ø1) cos(ø2) haversin(λ2 − λ1) )
where
haversin(θ) = sin2 (θ ) = 1 − cos(θ )
2 2
d is the distance between the two points (along a great circle of the sphere;
see spherical distance);
r is the radius of the sphere;
ø1 , ø2 latitude of point 1 and latitude of point 2; and
λ1 , λ2 longitude of point 1 and longitude of point 2.
S A I I A R E S E A R C H R E P O R T N U M B E R 16
27DEVELOPMENT EFFECTIVENESS PROJECT
Final data cleaning and rendering
To conduct econometric analysis on the data gathered from the various institutions, most
of the variables needed to be converted into numerical values. Some were made into
binary dummy variables, some into scale (absolute numbers and percentages), and others
ordinary (such as the variables for school quintile and school specialisation).
In order to use some of the more sophisticated statistical techniques such as propensity
score matching (discussed in the next section), it was important that the dataset did not
have any missing or incomplete values. There was a lot of missing data in the original
datasets provided by the various institutions, so the research team had to take decisions
on how to treat the missing data. For many of the variables such as information about the
infrastructure, resources, curriculum, language and socio-economic status of schools and
learners, the team was able to estimate the missing values by using the mode (majority
value) of the cases, the mean (average), or the value that appeared most logical based on
theory and fieldwork. In the event where there were too many cases of missing data that
could not be estimated and the variable did not seem to have a major impact on results
(such as with the variables of former Bantustan24 schools, the percentage of educators with
academic degrees, the urban/rural location, repeaters and drop-outs), the team decided
to omit these variables from the matching process. If there were only a few missing and
problematic values (such as with some of the NSC results), the analysts decided to delete
the specific cases from the dataset, as long as this did not affect the schools receiving
interventions (which were important for the evaluation).
Finally, the dataset was checked for any outliers and anomalous cases and corrections
were made accordingly. By the end of the data cleaning process, the total number of
secondary schools from Limpopo and North West included in the analysis was reduced
from 1 796 to 1 536, and the total number of Anglo-supported schools was reduced from
137 to 134. Both the treatment sample and the population sample from which to extract
the control groups were large enough to arrive at statistically significant results during the
next stages of the impact evaluation.
I M PA C T E VA L U AT I O N T E C H N I Q U E S
Once the dataset for the complete population of schools in North West and Limpopo
was prepared and cleaned, the team was ready to conduct the statistical analysis required
to measure the impact of the maths and science interventions. As the evaluation taking
place is ex-post and a randomised experiment was never planned at the start of the
interventions, the research team had to rely on quasi-experimental methods, which were
cheaper but required access to a lot of administrative data, which luckily was available.
The use of unobstructive ex-post analytical methods also prevented the study from
unwarranted ‘Hawthorne effect’25 and ‘John Henry effect’26, which could have occurred
in the control and programme group if a real-life experiment had been set up. Below are
the techniques used during the quantitative analysis based on the evaluation model and
methodological approach presented in previous papers.27
S A I I A R E S E A R C H R E P O R T N U M B E R 16
28You can also read