Poisonings in Singapore: A Poison Center Perspective - Openventio ...
←
→
Page content transcription
If your browser does not render page correctly, please read the page content below
ISSN 2474-8978

TOXICOLOGY AND FORENSIC MEDICINE
                                                                  Open Journal

Systematic Review
Poisonings in Singapore: A Poison Center Perspective
Ponampalam R, MBBS, FRCS (Ed), FAMS, GDOM*

Senior Consultant, Department of Emergency Medicine, Singapore General Hospital, Outram Road, Singapore 169608

Corresponding author
*

Ponampalam R, MBBS, FRCS (Ed), FAMS, GDOM
Senior Consultant, Department of Emergency Medicine, Singapore General Hospital, Outram Road, Singapore 169608; Tel. (65) 63213558; Fax: (65) 63214873;
E-mail: ponampalam@singhealth.com.sg

Article information
Received: December 10th, 2018; Revised: January 25th, 2019; Accepted: January 27th, 2019; Published: February 7th, 2019

Cite this article
Ponampalam R. Poisonings in Singapore: A poison center perspective. Toxicol Forensic Med Open J. 2019; 4(1): 8-12. doi: 10.17140/TFMOJ-4-127

           ABSTRACT
      The Drug and Poison Information Center (DPIC) in Singapore was run as a pilot project over 4 years from April 2004 to March 2008.
      The center provided a hotline service for toxic exposure assessment and management to healthcare professionals and the general public.
      The aim of this study was to review poisonings through the perspective of this poison center.
      Method
      A retrospective review of records in the DPIC call database was made covering the 4 years of its operation. Drug information and ad-
      verse effects calls were excluded from the study.
      Results
      There was a total of 15227 calls to the DPIC over the study period. Of these, 1817 calls (11.9%) were on acute toxic exposures involving
      patients. Healthcare personnel working in public restructured hospitals were the most frequent users (71.4%) of the service with the
      majority of these calls originating from the emergency departments (86%). Public inquiries accounted for 16.6% of the call volume. The
      cohort of poisoning cases showed a bimodal distribution of age groups with peaks in the less than 5 age group and the 20 to 40 year
      age group. The racial distribution followed local population demographics but with almost equal gender representation (50.3%males).
      Most exposures were accidental (67.4%) and occurred at home (69%). The number of agents involved in each exposure ranged from one
      (84.5%) to a maximum of 6 (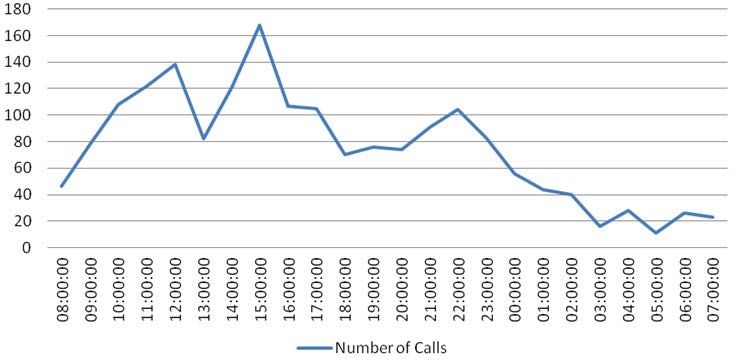
Toxicol Forensic Med Open J. 2019; 4(1): 8-12. doi: 10.17140/TFMOJ-4-127
from April 2004 to March 2008. Drug information and adverse
Table 2. Age Distribution of Poisoning Cases
effects calls were excluded from the study and only toxic exposure
Age (years) Number of incidents (Total)
calls were analyzed. Demographic data, toxic exposure, advice pro-
0-5 425 (37.1%)
vided and outcome information were analyzed.
6-10 50 (4.4%)
RESULTS 11-15 68 (5.9%)
16-20 98 (8.6%)
There was a total of 15227 calls to the DPIC since its operation 21-30 203 (17.7%)
on April 04 to March 2008. Of these 13364 calls were excluded as 31-40 133 (11.6%)
they covered drug information and adverse drug reaction related 41-50 75 (6.6%)
inquiries. A further 46 calls were excluded as they were inquiries on 51-60 38 (3.3%)
toxins with no patient involvement. The remaining 1817 (11.9%) 61-70 19 (1.7%)
included in the study were on acute toxic exposures involving pa- >70 37 (3.2%)
tients. Total 1146
Missing data 671
DPIC User Profile
Total 1817
Healthcare workers in public hospitals were the most frequent us-
ers (71.4%) of the DPIC service (Table 1), predominantly from the
Emergency Departments (86%). Overall, physicians (78.8%) were Table 3. Toxic Exposure Incident Site
the primary users of the service with majority originating from jun- Place Number of incidents
ior level medical staff (70%) including house officers and medical Home 1072 (69%)
officers. Calls from members of the public mainly non-medical Workplace 116 (7.4%)
persons accounted for 16.6% of the call volume. Public areas* 242 (15.6%)
Unknown 124 (8%)
Table 1. Origin of Poison Information Calls Total 1554 (100%)
Location Number of calls Missing data 263
Public Restructured hospitals 1296 (71.4%) Total 1817
Private hospitals 53 (2.9%) Includes places such as beach, parks, and other recreational placese.g. pubs
*
GP Clinics 108 (5.9%)
Other healthcare institutions 32 (1.8%) sures to analgesics (13.5%), antidepressants and sedatives (10.6%),
*
Other+ 26 (1.4%) industrial chemicals (5.7%) and bites and stings (8.4%) forming the
Member of Public@ 302 (16.6%) bulk of agents involved. The commonest route of exposure was
Total 1817(100%) oral (70.4%).
*
Includes polyclinics, private pharmacies, National Dental Centre, National Cancer
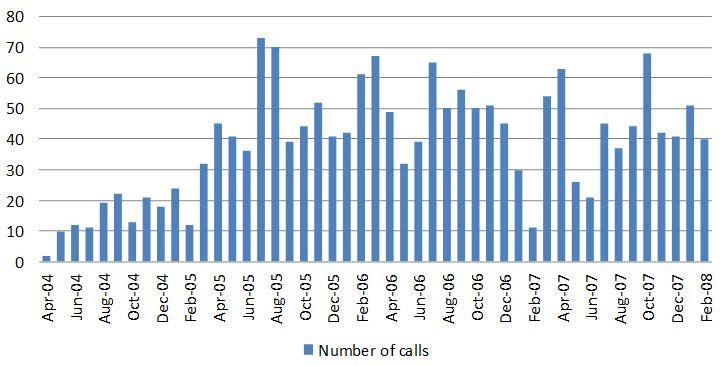
Centre, National Heart Centre, National Neuroscience Institute, National Skin The distribution of calls during the DPIC pilot phase is
Centre, and Singapore National Eye Centre.
+
Includes research institutions, pharmaceutical companies, government organiza- shown in Figure 1. The calls were evenly distributed by month of
tions. the year with no significant seasonal variation except for a slight
@
includes self, relatives, friends, colleagues, witnesses
dip in the middle of the year and a more significant number in
the second half of the year (Figure 2). There was also no signifi-
Toxic Exposure Patient Demographics cant daily variation by day of the week except for a notable dip in
calls on Sundays. The daily distribution of calls showed a peak at
The age of patients ranged from 3 months to 99 years (mean age 1500-hours and 2200-hours with an equitable distribution between
21.1 years) with a bimodal distribution with peaks in the under 5 office (0800-1700 hours over 9-hours) and after office hours (1700
age group and the 20 to 40 year age group (Table 2). The racial hours till 0800-hours the following day) (Figure 3). A proportion-
distribution followed local demographics with almost equal gender ally larger distribution of toxic exposure calls occurred outside
representation with 50.3% of the cohort being males. working hours during the late evenings and nights as well as public
holidays.
Toxic Exposure Incident Information
Poison Center Intervention and Outcome
The most common site of incidence was home (69%) and the ma-
jority was of an accidental nature (67.4%) (Table 3). The number It is noted that for most calls from the public (69.2%), the poi-
of agents involved in each exposure ranged from one (84.5%) to son center advice was to reassure and observe the patient with no
a maximum of 6 (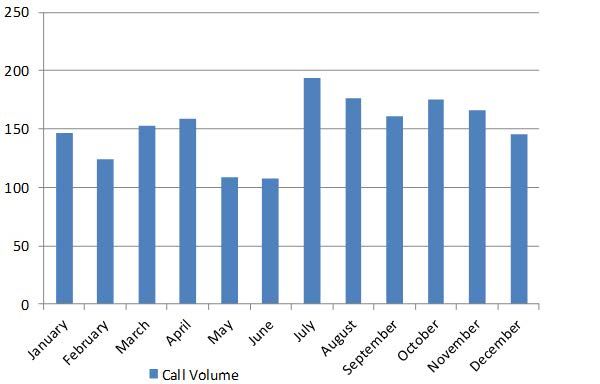
Toxicol Forensic Med Open J. 2019; 4(1): 8-12. doi: 10.17140/TFMOJ-4-127

  Table 4. Agents Used in Poisoning                                                        Figure 2: Distribution of Calls by Month
                 Agent                      Number of agents (% of total exposures)

       Acids/Alkaline/Corrosives                            65 (3%)

                Alcohol                                    33 (1.5%)

  Analgesics (excluding paracetamol)                       119 (5.5%)

        Analgesics- Paracetamol                            175 (8%)

            Antidepressants                                102 (4.7%)

             Antihistamines                                112 (5.1%)

             Antimicrobials                                 2 (0.1%)

             Antipsychotics                                46 (2.1%)

          Asthma medications                               26 (1.2%)

          Cardiac medications                              51 (2.3%)

              GI medicines                                 17 (0.8%)
                                                                                           Figure 3: Poison Call Volume by Time of Day
                Sedatives                                  129 (5.9%)

       Other Western medicines                            241 (11.1%)

          Traditional Medicine                             33 (1.5%)

            Bites and Stings                               183 (8.4%)

               Pesticides                                   87 (4%)

     Household Cleaning Products                           128 (5.9%)

               Cosmetics                                   29 (1.3%)

       Food products/substances                            24 (1.1%)

              Illicit Drugs                                13 (0.6%)

          Industrial Chemicals                             124 (5.7%)

           Smoke Inhalation                                20 (0.9%)

     Vitamins/mineral supplements/
                                                           41 (1.9%)
            OTC* products
                                                                                            Table 5. Poison Center Intervention - Advice to Caller
                Others+                                   361 (16.6%)
                                                                                                                                       Number of      Total Number of Calls
               Unknown                                     18 (0.8%)                             Poison Center Intervention
                                                                                                                                        Calls (%)    (% of All Calls to DPIC)
                  Total                                   2179 (100%)
                                                                                                        Public Calls
                  Note that some exposures may involve more than 1 agent.
                                   +i
                                      ncludes silica gel, etc.                                     Advice to go to hospital            70 (23.2%)
                                 *
                                  OTC (over the counter)                                                                                                  302 (16.6%)
                          281 (15.5%) incidents involved >1 agent                                    Advice to see a GP                23 (7.6%)

                                                                                               Advice to be observed at home          209 (69.2%)

                                                                                              Community Healthcare Calls
 Figure 1: Distribution of Poison Call Volume 2004-2008
                                                                                                   Advice to go to hospital            38 (22.9%)          166 (9.1%)

                                                                                               Advice to be observed at home          128 (77.1%)

                                                                                             Emergency Department (ED)
                                                                                                       Calls

                                                                                                       Advice to admit                321 (28.8%)         1115 (61.4%)

                                                                                              Advice to observe and discharge         794 (71.2%)

                                                                                                   Calls from the Ward                                    234 (12.9%)

                                                                                              All Calls to Drug and Poison
                                                                                                                                                          1817 (100%)
                                                                                              Information Center (DPIC)

Systematic Review | Volume 4 | Number 1|                                    Ponampalam R                                                                                        10
Toxicol Forensic Med Open J. 2019; 4(1): 8-12. doi: 10.17140/TFMOJ-4-127
sicians (77.1%) and emergency department physicians (71.2%). 21.1-years and 50.3% respectively from the DPIC perspective. The
This potentially demonstrates the triaging function of a poison proportion of non-accidental poisonings was also larger in the ED
center reducing unnecessary healthcare visits and saving time and cohort (60%) compared to the DPIC (32.6%). There is insufficient
healthcare cost by empowering the public and community physi- data in the study to determine the reason for the difference and
cians while improving the quality of care of poisoning cases with would be an area for future research.
appropriate management and referral advice. This advisory service
would serve as an even more critical resource in a chemical disaster In both studies the commonest site of exposure was the
involving exposure of a large population. home and the common agents were analgesics, sedatives, bites and
industrial chemicals but alcohol related exposures were more com-
The DPIC has been able to provide immediate definitive mon in the ED setting. A study by Wai et al determined the inci-
advice within 15 minutes of the call for most situations (96.5%) dence of attempted suicide amongst young people treated in a local
and 99.5% of all calls were resolved within one hour (Table 6). The teaching hospital between 1991 and 1995.3 Females were the pre-
remaining smaller proportion of cases took up to 8 hours to be re- dominant gender committing self-harm by poisoning and the most
solved due to complexities of the cases involved since the detailed common medication used was analgesics with paracetamol-based
search for information took up most of the time. products being the most common. Similar results were obtained
in another study performed in Northern Malaysia, a neighbouring
country which share close cultural and economic ties with Singa-
Table 6. Response Time for Poison Information pore.4 In Hong Kong, a regional Asian country with a poison in-
Time taken Number of calls (total) formation centre established in 2005, 8.4% of poisonings involved
Immediate 1353 (74.5%) the use of paracetamol, representing one of the most common
24 hrs 1 (0.1%) classes involved in human toxic exposures. The ready availability
Total 1817 of paracetamol as an over the counter drug may not completely
address the reason for this coincidence.
DISCUSSION The DPIC appears to have played a significant role in
toxic exposures management; advising and reassuring minor poi-
The number of toxic exposures presented in this study was small, soning cases while facilitating the appropriate referral of the more
most likely due to the limited publicity of this service. Based on severe cases to the hospital ED for further management. This
the official statistics, there was a total of 4990 cases of individu- potentially demonstrates the triaging function of a poison center
als being admitted to Singapore hospitals following an episode of reducing unnecessary healthcare visits and saving time and health-
poisoning between 2004 and 2006.1 Although the overall incidence care cost.
of poisoning fell slightly during this period, it remained (coupled
with accidents and violence) the most common cause of hospital In addition, it is noted that the proportion of patients
admissions. admitted as advised by the DPIC (28.8%) was smaller compared
to the previous study on toxic exposures presenting to the ED
Being in the frontline of emergency services, emergency from 2001 to 2003, when poisoning admissions were notably high-
department (ED) doctors routinely manage toxic exposures and er (36.1%) when patients were managed in the ED without access
have significant clinical experience in managing poisonings. Con- to a DPIC service. There appears to be more effective utilization
trary to expectation, these doctors working in the ED setting were of limited hospital bed resources with the use of the DPIC service.
noted to use the service more frequently (86%). The reason for
this may be multifactorial, including varying experience and com- CONCLUSION
fort level amongst ED physicians on managing toxic exposures to
a myriad of agents with limited information resources and staffing
This study provides a historical baseline for toxic exposure sta-
issues comprising a significant proportion of junior doctors rotat-
tistics of the past which will be useful for analyzing current and
ing through the ED. The latter is suggested as junior level doctors
future trends in poisoning.
were noted to use the service more frequently accounting for 70%
of all physician users.
It is notable that young people tend to be vulnerable to tox-
There are several notable differences comparing toxic ex- ic exposures and the majority are accidental and hence potentially
posures from the ED2 and DPIC perspectives. The toxic exposures preventable. The role of poison prevention education for parents
from the ED perspective showed that the mean age of poisoning with young children and poison proofing homes may be potentially
was 31.8-years with predominance of males 63.3% compared to beneficial in reducing the number of accidental poisonings in the
home.
11 Ponampalam R Systematic Review | Volume 4 | Number 1|Toxicol Forensic Med Open J. 2019; 4(1): 8-12. doi: 10.17140/TFMOJ-4-127
The cost effectiveness7 and user friendliness8 of the 2. Ponampalam R, HH Tan, KC Ng, WY Lee, SC Tan. Demo-
DPIC were noted in prior studies and with the current evidence of graphics of toxic exposures presenting to three public hospital
good clinical outcomes through DPIC services demonstrates the emergency departments in Singapore 2001-2003. Int J Emerg Med.
value of the DPIC as a community resource in managing poison- 2009; 2(1): 25-31. doi: 10.1007/s12245-008-0080-9
ings.
3. Wai BH, Hong C, Heok KE. Suicidal behavior among young
LIMITATIONS people in Singapore. Gen Hosp Psychiatry. 1999; 21(2): 128-133.
There was limited publicity on the services of the DPIC and this 4. Fathelrahman AI, Ab Rahman AF, Mohd Zain Z. MS 04-044:
may have contributed to the low numbers of calls that were han- Demographic features of drug and chemical poisoning in north-
dled. Data capture was incomplete in many variables and this lim- ern Malaysia. ClinToxicol (Phila). 2005; 43(2): 89-94.
ited the validity of conclusions drawn.
5. Chan YC, Tse ML, Lau FL. Hong Kong poison information
ACKNOWLEDGEMENTS center: Annual report 2011. Hong Kong J Emerg Med. 2012; 19(6):
394-404. doi: 10.1177/102490791201900604
The article was presented as a poster at Eurotox 2014, Edinburgh
7-10th September 2014. The abstract was published in Toxicology 6. Gummin DD, Mowry JB, Spyker DA, Brooks DE, Osterthal-
Letters: https://doi.org/10.1016/j.toxlet.2014.06.363 er KM, Banner W. 2017 Annual report of the American Asso-
ciation of Poison Control Centers' National Poison Data System
CONFLICTS OF INTEREST (NPDS): 35th annual report. ClinToxicol (Phila). 2018; 1-203. doi:
10.1080/15563650.2018.1533727
There is no conflict of interest.
7. Ponampalam R, Loh CS. Cost benefits of the drug and poison
REFERENCES information center (DPIC) in preventing unnecessary hospitaliza-
tion: The Singapore experience. Hong Kong Journal of Emerg Med.
1. Ministry of Health. Inpatient discharges from all hospitals by 2010; 17(1): 45-53. doi: 10.1177%2F102490791001700108
disease condition (2004-2006). Website: http://www.moh.gov.sg/
mohcorp/statistics.aspx?id=4464#17. Accessed August 27, 2017. 8. Ngo SYA, Tee Caroline, Ponampalam R. Singapore drug and
poison information service: User satisfaction after three years.
SGH Proceedings. 2009; 18(1): 12-16.
Submit your article to this journal | https://openventio.org/submit-manuscript/
Systematic Review | Volume 4 | Number 1| Ponampalam R 12You can also read