Post Pandemic Positioning - Managing liquidity in uncertain times
←
→
Page content transcription
If your browser does not render page correctly, please read the page content below

Post
Pandemic
Positioning
Managing liquidity
in uncertain times

1   Introduction

           2   Fiscal & Monetary Response
Contents
           3   Current State of the Market

               Forecasting, Optimizing
           4   Liquidity & Opportunity Cost

           5   Q&A
Monetary Response to COVID

                                   2.50

                                   2.00

              Precipitous target   1.50

150 bps
              rate reduction by
                                   1.00
              FED due to
              economic concerns    0.50

                                   0.00

                                   Source: Federal Reserve Economic Data

                                     Trillions   $8
                                                 $7
                                                 $7
                                                 $6
                                                 $6

 $3.0
                                                 $5
              Increase in Fed
                                                 $5
              balance sheet                      $4
              assets since
 Trillion     March 20
                                                 $4
                                                 $3

                                   Source: Federal Reserve Economic Data

                                                                           3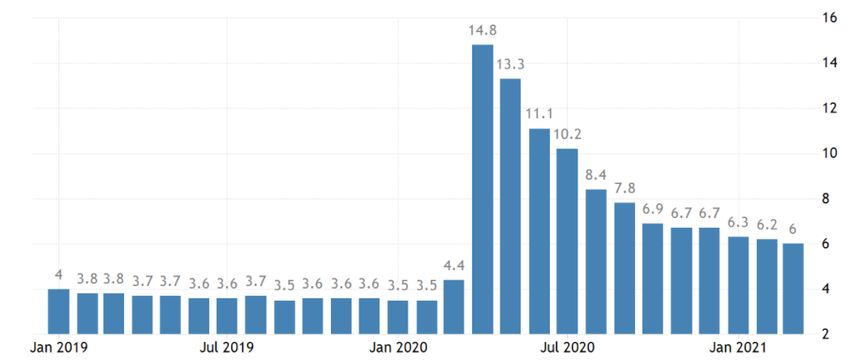
Monetary Alphabet Soup (for the economy)

Policy
   • ZIRP: Low rates
   • FG: “Cards on the table”

Financial Markets
   • QE: Securities Purchases
   • PDCF: Lending to securities firms
   • MMLF: Backstopping money market mutual funds

Regulatory
   • SLR: Temporarily relaxing regulatory requirements

Corporates & Businesses
   • PMCCF/SMCCF: Direct lending to major corporates
   • CPFF: Commercial Paper market support
   • PPP/MSLF: Supporting loans to small- and mid-sized businesses

Consumers
   • TALF: Liquidity to support credit to consumers

Governments
   • MLF: Direct lending to state and municipal governments

                                                                     4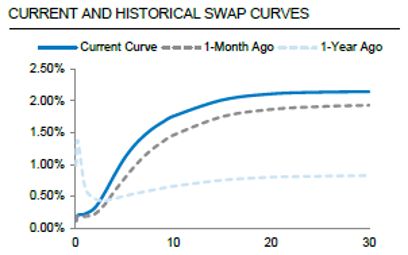
Fiscal Response to COVID

2020
                     Coronavirus Preparedness and Response
 March 6     $8.3B   Supplemental Appropriations Act

 March 18    $192B   Families First Coronavirus Response Act

 March 27    $2.3T   CARES ACT

                     Paycheck Protection Program and Health
  April 24   $484B   Care Enhancement Act

                     Coronavirus Response and Relief
   Dec 21    $866B   Supplemental Appropriations Act

2021
 March 11    $1.9T   American Recovery Plan Act

                                                               5
Fiscal Response to COVID vs other
Historical US Stimulus Bills ($B) Historical US Stimulus Bills ($B)
Nominal $ Inflation Adjusted $
$2,500 $6 45%
Billions
Trillions
$2,300
40% 40%
$4.95
$5
$2,000 35%
$4 30%
$1,500
$1,500 23%
25%
$1,300
$3
20%
$1,000 $868 $2 $1.79 15%
12%
10%
$483 $0.83
$500 $1
5%
$42 $0 0%
$- COVID Programs Recovery Act / TARP New Deal
CARES ACT American CA Act PPP/HCE Recovery New Deal (2020-21) (2009) (1929)
(2020) Recovery (2020) Act Act / TARP (1929)
(2021) (2020) (2009) Inflation Adjusted % of GPD
Months since
stock market 1 11 9 6 10 42
peak
61 Introduction
Contents
2 Fiscal & Monetary Response
3 Current State of the MarketCurrent Macro Conditions
GDP Unemployment Rate
Source: TradingEconomics.com / Bureau of Economic Analysis Source: TradingEconomics.com / Bureau of Economic Analysis
Inflation Rates
Source: TradingEconomics.com / Bureau of Economic Analysis Source: BMO
8Macro Forecasts
GDP Unemployment Rate
12.0% 6.00% 5.7%
10.0% 5.0%
10.0% 5.00% 4.6% 4.4%
8.3% 4.2% 4.0% 3.9%
8.0% 4.00%
6.0% 4.7% 3.00%
3.8%
4.0% 3.1% 2.6% 2.00%
2.3%
2.0% 1.00%
0.0% 0.00%
Q2 Q3 Q4 Q1 Q2 Q3 Q4 Q2 Q3 Q4 Q1 Q2 Q3 Q4
2022 2021 2022
Source: BMO Source: BMO
Inflation Rates
3.0% 2.50%
2.5% 2.00%
2.5% 2.2% 2.1% 2.00%
2.0% 2.0% 2.0%
2.0% 1.50%
1.4%
1.5%
1.00%
1.0%
0.50% 0.13% 0.25%
0.5% 0.10%
0.00%
0.0%
Fed Funds 90 Day T-Bill 3-Month LIBOR 10-yr Bond Yield
Q2 Q3 Q4 Q1 Q2 Q3 Q4
2021 2022 Q2 Q3 Q4 Q1 Q2 Q3 Q4
Source: BMO Source: BMO
9Where did the $ go?
$17
Trillions
$16
$16
$15
Increase in Fed
$3
$15
balance sheet $14
assets since $14
Trillion March 20
$13
$13
$12
Source: Federal Reserve Economic Data
$8
Trillions
$7
$7
$6
$6
$5
Increase in
$2.4
$5
commercial bank $4
deposits held at $4
the Federal
Trillion Reserve
$3
Source: Federal Reserve Economic Data
10Bank Deposits vs Fed Balance Sheet
%
$8
Trillions
1.20
$7
1.00
$6
0.80 $5
$4
0.60
$3
0.40
$2
0.20
$1
0.00 $0
2009 2010 2011 2012 2013 2014 2015 2016 2017 2018 2019 2020
Trillions
Money Market 1 month CD 3 month CD 6 month CD 12 month CD Fed Balance Sheet
Source: FDIC/FRED
111 Introduction
Contents 2 Fiscal & Monetary Response
3 Current State of the Market
Optimizing Liquidity,
4 Forecasting & Opportunity
CostKnowing what levers to pull in optimizing yield
Strategic Cash
⚫ SMAs
⚫ Commercial Paper
⚫ Direct Securities
Reserve Cash
⚫ MMDA
Yield
⚫ MMFs
⚫ CDS
Operating Cash
⚫ ECR
⚫ Hybrid Accounts
⚫ Sweeps
Time
13Cash Flow Forecasting Framework
Operating
Activities Investing Financing
(Payables + (Cap Ex) (Credit)
Receivables)
To optimize future cash resources
14Attributes of a best-in-class cash flow
forecasting solution
Future State
• Automation of future cash
flows from bank
transactions such as ACH,
Intermediate Wires, Bill pay etc.
• Bank file feeds
Baseline • Variance analysis of actual
versus plan
• Historical cash flow data
visualization
• Simulation and what-if
Current Practices • Ad-hoc cash flow
scenarios to dimension
• Excel spreadsheets potential impact and
adjustments (manually)
outcomes
• Manual data input • Trends analysis on
expected cash flows for
up to a year in advance
15Different cash types and importance of forecasting
for optimization
Strategic cash
can benefit from Reserve cash Operating
investments in may be balances could
short duration enhanced with be more
bond funds or MMDA or longer efficient and
separately dated bank optimized using
managed deposits (CDs) ECR, MMFs, etc.
accounts (SMA)
Ideal Target Strategic Reserve / Core Operating
Minimize WC buffer cash
Opportunity Cost
Where can maturities extend
Q1 Q2 Q3 Q4
16Case study – capitalizing on market dislocations
to increase return
March 15th 2020
Precipitous Build up of
150 rate reduction
by FED in
13% to Forecast of
world trade $1 cash on U.S.
bank balance
bps March due to
economic
32% reduction in
2020 - WTO Trillion sheets in
Q2’2020
concerns
2.50%
USD LIBOR Market dislocation leads to
2.00%
Fed opportunities for yield
Rate
Cuts
1.50%
1.00%
.50%
.00%
Jan-20 Feb-20 Mar-20 Apr-20 May-20 May-20
O/N 1 WK 3M 6M 12M
Source: Federal Reserve Economic Data
171 Introduction
2 Fiscal & Monetary Response
Contents
3 Current State of the Market
Optimizing Liquidity,
4 Forecasting & Opportunity
Cost
5 Q&AThank you!
Disclaimer

These materials are confidential and proprietary to, and may not be reproduced, disseminated or referred to, in whole or in part without
the prior consent of BMO Capital Markets (“BMO”). These materials have been prepared exclusively for the BMO client or potential client to
which such materials are delivered and may not be used for any purpose other than as authorized in writing by BMO. BMO assumes no
responsibility for verification of the information in these materials, and no representation or warranty is made as to the accuracy or
completeness of such information. BMO assumes no obligation to correct or update these materials. These materials do not contain all
information that may be required to evaluate, and do not constitute a recommendation with respect to, any transaction or matter. Any
recipient of these materials should conduct its own independent analysis of the matters referred to herein.
BMO Capital Markets is a trade name used by BMO Financial Group for the wholesale banking businesses of Bank of Montreal, BMO Harris
Bank N.A. (member FDIC), Bank of Montreal Europe p.l.c, and Bank of Montreal (China) Co. Ltd, the institutional broker dealer business of
BMO Capital Markets Corp. (Member FINRA and SIPC) and the agency broker dealer business of Clearpool Execution Services, LLC (Member
FINRA and SIPC) in the U.S., and the institutional broker broker dealer businesses of BMO Nesbitt Burns Inc. (Member Investment Industry
Regulatory Organization of Canada and Member Canadian Investor Protection Fund) in Canada and Asia, Bank of Montreal Europe p.l.c.
(authorized and regulated by the Central Bank of Ireland) in Europe and BMO Capital Markets Limited (authorized and regulated by the
Financial Conduct Authority) in the UK and Australia. “Nesbitt Burns” is a registered trademark of BMO Nesbitt Burns Inc., used under
license. “BMO Capital Markets” is a trademark of Bank of Montreal, used under license. "BMO (M-Bar roundel symbol)" is a registered
trademark of Bank of Montreal, used under license.
® Registered trademark of Bank of Montreal in the United States, Canada and elsewhere. TM Trademark of Bank of Montreal in the United
States and Canada.
© 2020 BMO Financial Group.
BMO does not provide tax, accounting or legal advice. Any discussion of tax matters in these materials (i) is not intended to
be used, and cannot be used or relied upon, for the purposes of avoiding any tax penalties and (ii) may have been written in connection
with the “promotion or marketing” of the transaction or matter described herein. Accordingly, the recipient should
seek advice based on its particular circumstances from an independent tax advisor.

All values in this document are in US$ unless otherwise specified.

                                                                                                                                          20
You can also read