"Power to the Players" - Bespoke Investment Group
←
→
Page content transcription
If your browser does not render page correctly, please read the page content below
“Power to the Players”
Just when you thought you saw it all, along comes the saga of GameStop (GME). The stock’s rally,
which actually has been going on for months but really went into orbit in the last few weeks, seems to
make no fundamental sense. GME is basically the Blockbuster of video games. It sells physical versions
of video games that most players are now buying digitally or streaming. None of this was news to any-
one paying attention, and the stock had been a favorite of the short-selling community for years. If you
were just coming to the eureka moment that the GME business model faced structural headwinds, you
probably shouldn’t be in the investment business.
With such a stiff secular headwind howling in its face, GME’s surge has been completely written off as
market manipulation and a concerted effort by the reddit community to take out the short-sellers. And
when you see charts like this, it’s not fundamentals driving the stock. The trading in GME was original-
ly written off as a bunch of ‘video-game playing yahoos’ on message boards blindly following each oth-
er, but in the story of GME that has emerged, there was a method to the madness. Fitting to
GameStop’s motto, it was a “Power to the Players” moment, where we were reminded of the quote,
“Within every lie, there is usually a hint of truth, and within every truth, there is always a hint of a lie.”

                                         GameStop (GME): Past Year
                500
                450
                400
                350
                300
                250
                200
                150
                               50-DMA
                100
                               200-DMA
                 50
                  0

GameStop (GME) had been written off for dead by just about everyone on the street, but there were a
number of catalysts that helped give the company a chance or at least the perception of one. First,
while the video-game market has undergone a major shift to digital from physical cartridges, the indus-
try is in the middle of a console upgrade cycle where both Microsoft and Sony have launched new ver-
sions of the Xbox and PlayStation. Historically, console upgrade cycles have been good for the video
game sector. The second catalyst working in GameStop’s favor was the re-opening trade where inves-
tors were playing a lifting of COVID restrictions and buying up the stocks of traditional brick and mortar
retailers.

BespokePremium.com                                                 The Bespoke Report 1/29/21    Page 1 of 36

                      For Personal Use Only—Do Not Forward or Redistribute
Adding to the console upgrade cycle and the reopening trade, last November, Chewy co-founder Ryan
Cohen, who built a multi-billion $ business out of transforming the way consumers purchase pet food
and products, disclosed a 10% stake in the company. That move didn’t get a whole lot of attention, but
back on January 11th, GME announced that it was making Cohen a director in the company and gave
him and two of his former Chewy colleagues board seats. While the first two points created a funda-
mental argument for owning the stock, the addition of Cohen to the board acted as a catalyst that per-
haps GME could successfully transition itself to a digital retailer.
While GameStop (GME) was far from out of the woods and still faces long odds, when it comes to the
stock market, sometimes a good story is just as good in the short-term as actual results. Traders took
these events and weaved them together, and using the options market they exploited the high level of
short interest (>100% of float) to create one of the greatest short squeezes of all time.
The most puzzling aspect of the squeeze in GME is how anyone who had a significant short position in
the stock allowed themselves to get caught with their pants down. The chart below shows the price of
GME and its short interest as a percentage of float from July 2018 through the end of September 2020.
In the summer of 2019, GME’s short interest was already high at more than 70% of the stock’s float.
Late in the year, short interest in the stock surged above 100% when the stock was trading over $6.
Almost immediately after that surge in short interest, GME sank and was more than cut in half. At that
point, with more than 100% of the float sold short and the stock down 50%, the question of whether to
cover should have at least been asked. GME was the only stock listed in the United States with more
than 100% of its float sold short, but as the stock languished under $4, short interest remained above
100% as nobody short the stock took profits. Maybe we’re missing something, but it seems inexcusable
that short interest was so high for so long and no one ever thought about how crowded a trade they
were in. Then, when the stock started to rally as Ryan Cohen built up his position, not only did the
shorts not cover, but they pressed their bets, taking short interest to over 140% of the stock’s float.
As GME surged this week, traders searched for and circulated lists of new targets. While there are defi-
nitely some similarities in these other names that rallied, GME was in a league of its own as the stock
had more than 100% of its float and shares outstanding sold short. As just mentioned, there’s no other
stock in the US market where short interest was this extreme, nor should there ever be.
GameStop (GME): July 2019 - September 2020
12.00 160
Price (Left Axis)
150
Short Interest % of Float (Rght Axis)
10.00 140
130
8.00 120
110
6.00 100
90
4.00 80
70
2.00 60
7/19 8/19 9/19 10/19 11/19 12/19 1/20 2/20 3/20 4/20 5/20 6/20 7/20 8/20 9/20
BespokePremium.com The Bespoke Report 1/29/21 Page 2 of 36
For Personal Use Only—Do Not Forward or Redistribute• The surge in GameStop (GME) and other short squeeze stocks was temporarily stopped dead in its
tracks on Thursday morning as Robinhood and other free-to-trade app-based brokerages and even
traditional brokers like Interactive Brokers halted trading activity in a number of these stocks.
• The effect of the halt in trading for the GameStop (GME): Past 15 Days
stocks was predictably an immediate 500
downdraft. Shares of GME actually 450 Trading Ban
Put in Place
peaked within minutes of the an- 400
nouncement. 350
300
• Other heavily shorted stocks in the 250
space also collapsed. Heading into 200
2021, there were 16 stocks in the Rus- 150
100
sell 3000 that had more than 40% of
50
their free-floating shares sold short, 0
and the table below illustrates how the 1/14 1/15 1/19 1/20 1/21 1/22 1/25 1/26 1/27 1/28
reversal played out.
• On Monday, Tuesday, and Wednesday, the 16 most heavily shorted stocks were up an average of
more than 12% each day and by an average of 57.5% for the week– in just three days!
• Following the news of the trade restrictions, though, 13 of those 16 stocks on the list were down,
and on an overall basis, they dropped by an average of more than 10%.
• Friday, some of the trading restrictions were once again relaxed, and sure enough, the heavily
shorted stocks mostly rallied in an otherwise negative tape.
Russell 3000 Stocks With Highest Short Interest a/o 12/31
Short Interest Performance
Ticker Name (% of Float) 1/25/2021 1/26/2021 1/27/2021 1/28/2021 1/29/2021 YTD
GME GameStop 144.34 18.12 92.71 134.84 -44.29 66.56 1608.51
DDS Dillard's 91.03 9.25 19.82 -8.96 -11.50 7.89 44.01
BIGC BigCommerce 74.17 12.29 7.89 4.26 -10.31 -1.21 24.28
LGND Ligand Pharma 64.61 9.39 0.54 3.88 17.58 -3.08 86.87
BBBY Bed Bath & Beyond 64.44 1.56 20.18 43.45 -36.40 2.26 93.64
FIZZ National Beverage 62.49 13.18 16.23 40.17 -13.41 1.04 87.46
AMCX AMC Networks 59.01 10.19 9.96 -19.32 -1.10 2.63 37.10
MAC Macerich 58.61 20.98 12.88 15.01 -15.06 -13.73 53.61
ASO Academy Sports & Outdoors 55.26 5.48 2.53 -9.10 -4.57 6.45 8.30
SPWR SunPower 53.77 0.25 13.92 -2.93 1.05 2.04 110.14
SKT Tanger Factory Outlet 49.43 2.62 17.23 11.21 -9.35 -0.62 61.55
AXDX Accelerate Diagnostics 48.38 47.61 -7.41 24.96 -31.11 -3.58 31.40
SUMO Sumo Logic 47.81 5.91 4.30 0.80 -7.63 -0.25 22.09
TR Tootsie Roll Industries 45.29 15.66 10.30 11.44 -9.50 3.09 34.61
GOGO Gogo 44.64 18.17 1.93 -5.89 -5.61 1.52 38.42
SRG Seritage Growth 40.62 5.19 11.04 11.78 11.18 -17.48 25.75
12.24 14.63 15.97 -10.63 3.35 147.98
9.79 10.67 7.74 -9.42 1.28 41.22
BespokePremium.com The Bespoke Report 1/29/21 Page 3 of 36
For Personal Use Only—Do Not Forward or Redistribute• With GME and other stocks immediately plummeting after the trading restrictions were put in,
conspiracy theories popped up all over the place, and some of them were understandable. While
companies like Robinhood said they weren’t restricting clients from selling existing positions, what
good does that do when no one else can buy it? It’s like telling a butcher that they can sell all the
steak they want, but that consumers aren't allowed to buy it.
• To outside observers, it looked like the restrictions were nothing more than a ploy to allow short-
sellers to cover their positions at lower prices, sticking it to the little guy in the process.
• The conspiracy theories seemed logical, and a lot of individual investors ended up getting screwed
by the decision to restrict trading. However, while Robinhood’s restrictions may not have been in
the interest of the more than half of its clients holding GME, it most likely wasn’t doing a ‘favor’ for
the market makers or hedge funds who are short the stock. Robinhood was looking out for itself.
• The reason comes down to normally boring details of back office activities that most equity market
participants aren’t aware of, let alone forced to consider regularly.
• After an equity trade, there’s a two day settlement period; when you buy a stock on Monday, it
doesn’t actually settle versus the seller until Wednesday (T+2).
• Because the free-to-trade model typically signs users up for a margin account, regulatory require-
ments force them to put up cash via their clearing firm (or directly in the case of larger brokerages
that self-clear) on the trade date to insure that the settlement actually takes place two days later,
reducing counterparty risk across the market.
• Normally, that’s not a big deal; firms understand they might have to come up with cash and don’t
have a problem doing so because it’s part of normal operations.
• But the recent explosion of volume in names popular on these services means that funding re-
quirements for a few stocks have suddenly soared.
• Looking at just five of the “meme” stocks, we are talking figures into the mid-single digit billions
assuming relatively conservatively that only 5% of daily turnover is new exposure for free-to-trade
brokerage customers.
• Imagine seeing this type of Clearing Risks Torpedo Free-To-Trade Brokers
surge in activity and prices 7
and having to go out and
6
find a few billion dollars to
borrow on short no- 5 GME, AMC, KOSS, NOK, BB
Funding Requirement
tice...and knowing you’ll (Estimated; 5% of Total
4
have to find even more if Turnover for current + prior 2
sessions)
you let your customers 3
continue to take positions 2
they seem desperate to
take! 1
0
BespokePremium.com The Bespoke Report 1/29/21 Page 4 of 36
For Personal Use Only—Do Not Forward or Redistribute• Given the increased risks, it wasn’t surprising to see Thursday night that Robinhood drew down its
credit lines and raised $1 billion in new capital.
• Adding fuel to the fire: the Depository Trust & Clearing Corporation, which is the central settlement
warehouse for the US market, raised the collateral requirements for some of these most popular
stocks, further ramping up the cost of funding the settlement procedure.
• Leaving aside the motivation for brokerages to “protect” customers, the difficulty and gap risk in
executing orders in extremely volatile markets that have frequent stops, and much more specula-
tive theories about an insider cabal bailing out hedge funds, the cost of funding settlement alone
was ample reason for brokerages to restrict trading in these names.
• It’s also worth pointing out that any short squeeze, retail buying fervor, or parabolic price move is
bound to end some time, and that volatility works both ways.
• While it’s psychologically easier to blame shadowy forces, most of the time—and in this case—the
better explanation is just plain, old fashioned mechanics of how systems operate.
• By all accounts, the squeeze we have seen in GameStop (GME) and other stocks this week is ex-
treme, but what isn’t these days?
• The fact is that these types of squeezes have been around as long as the stock market. While there
may have never been such a well orchestrated short squeeze on the part of retail investors, Edwin
Lefevre wrote in Reminiscences of a Stock Operator, "There is nothing new in Wall Street. There
can't be because speculation is as old as the hills. Whatever happens in the stock market to-day
has happened before and will happen again."
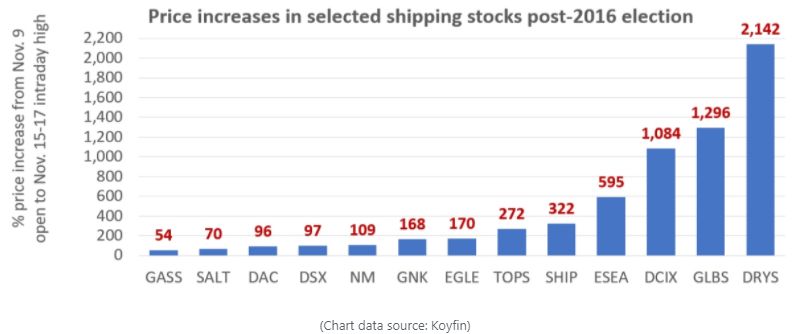
• It was only four years ago that we saw a massive short squeeze in the shipping stocks after the
2016 election. As the chart below from a story on freightwaves.com shows, in the week after the
2016 election, three shipping stocks saw their prices rise by more than 1,000%.
• In 2008, Porsche looked to cor-
ner the shorts in Volkswagen
briefly making it one of the
most valuable companies in the
world.
• In 1980, the Hunt brothers tried
to corner the silver market.
BespokePremium.com The Bespoke Report 1/29/21 Page 5 of 36
For Personal Use Only—Do Not Forward or RedistributeThe craziness regarding individual stock moves came to a head mid-week, but the week started out on
a manic note as well, specifically with the Nasdaq.
• After gapping up over 1%, the Nasdaq quickly
Nasdaq Intraday (% Change vs Prior Day): 1/29/21
sold off and was down over 1% by lunch time. 1.5
From those lows, though, the Nasdaq quickly 1.0
1.02
recovered, finishing the day in positive territory 0.69
0.5
and near record highs.
0.0
• These types of roller coaster rides for the -0.5
Nasdaq are uncommon. Since 1990, it was only
-1.0
the 19th time that the Nasdaq gapped up over -1.29
-1.5
1%, reversed lower trading down more than 9:30 11:00 12:30 14:00 15:30
1% from the prior day’s close, and then rallied Nasdaq (Log Chart): 1990 - 2020
16000
back to finish in positive territory.
8000
• The last occurrence was in March 2020, but the
4000
majority of occurrences came during the period
from 1999 through 2002. Returns following 2000
those occurrences were mostly negative, but 1000
more recent occurrences have been more be- 500
nign in terms of forward market returns.
250
90 92 94 96 98 00 02 04 06 08 10 12 14 16 18 20
Nasdaq Gaps Up 1%+, Down 1%, Finishes Higher: 1990 - 2020
Change vs Prior Close (%) Percent Change (%)
Date Gap Intraday Low Close One Week One Month Three Months Six Month One Year
4/15/99 1.11 -2.56 0.58 1.6 0.2 12.6 8.3 31.7
4/30/99 1.48 -1.58 0.57 -1.5 -2.8 3.8 16.7 51.8
5/26/99 1.13 -1.75 1.94 0.2 5.2 14.3 42.1 32.1
12/9/99 1.60 -1.98 0.23 3.4 8.0 40.4 7.8 -18.8
1/3/00 2.87 -1.96 1.52 -2.0 1.9 2.2 -3.4 -36.7
3/8/00 1.51 -2.59 1.02 -6.4 -9.2 -21.9 -18.8 -55.7
3/16/00 1.65 -2.78 2.94 4.7 -29.6 -18.2 -18.7 -59.9
3/31/00 2.07 -1.72 2.58 -2.8 -13.4 -13.3 -19.7 -59.8
10/27/00 1.48 -1.24 0.19 5.3 -12.1 -15.2 -36.7 -46.0
2/26/01 1.12 -1.06 2.03 -7.2 -16.9 -2.5 -17.0 -23.5
6/27/02 1.19 -1.15 2.09 -5.4 -13.5 -17.8 -7.6 11.4
8/7/02 2.44 -1.28 1.70 4.2 1.1 7.5 0.1 29.0
9/18/08 1.84 -1.36 4.78 -0.6 -22.2 -29.4 -32.2 -3.0
11/21/08 2.33 -1.57 5.18 10.9 13.0 4.1 22.5 55.0
1/16/09 1.36 -1.42 1.16 -3.4 0.3 9.2 23.3 49.6
8/9/11 1.88 -1.10 5.29 1.6 -0.6 5.6 17.9 21.6
2/9/18 1.27 -2.16 1.44 5.3 10.0 6.8 14.8 6.2
3/17/20 2.42 -1.10 6.23 1.1 17.9 35.1 48.7 85.9
1/25/21 1.02 -1.29 0.69
Average 0.5 -3.5 1.3 2.7 3.9
Median 0.7 -0.2 3.9 4.0 8.8
% Positive 56 50 61 56 56
BespokePremium.com The Bespoke Report 1/29/21 Page 6 of 36
For Personal Use Only—Do Not Forward or RedistributeAfter Monday’s roller coaster ride in US equities, every single one of the index ETFs we track in our
Trend Analyzer was trading at overbought levels.
• The image below is a snapshot from our Trend Analyzer reflecting levels as of 1/25. Not only was
every one of the ETFs shown at overbought levels, but the mega-cap Nasdaq 100 (QQQ) and S&P
100 (OEF) both finished the session at ‘Extreme Overbought’ levels giving them ‘Poor’ timing
scores. When indices become this overbought, the risk/reward equation starts to skew towards
the risk side of the scale.
• After the pullback we’ve seen this week, though, the balance has shifted more towards the bullish
side. The only ETF that was overbought to close out the week was the Micro Cap ETF, while every
other major index ETF has worked off its overbought levels and have ‘Good’ timing scores.
BespokePremium.com The Bespoke Report 1/29/21 Page 7 of 36
For Personal Use Only—Do Not Forward or RedistributeRegarding market internals, two indicators we wanted to provide an update of this week are the S&P
500’s cumulative A/D line and the relative strength of the Philadelphia Semiconductor Index (SOX) ver-
sus the broader market.
• Regarding breadth, while we would stress that’s its small, we have seen a slight divergence be-
tween the S&P 500’s cumulative A/D line and its price.
• While the S&P 500 made a new high on both a closing and intraday basis this past Monday,
breadth did not confirm as the cumulative A/D line finished slightly off its high from prior week.
• Again, the divergence at this point is miniscule, but divergences have to start from somewhere, so
we’ll be following this closely in the days and weeks ahead.
S&P 500 vs Cumulative A/D Line: Last 12 Months
4000 6000
5000
3700
4000
3400 3000
2000
3100
1000
2800 0
-1000
2500
-2000
2200 -3000
1/27 4/27 7/27 10/27 1/27
S&P 500 (Left Axis) Cumulative A/D Line (Right Axis)
• Similar to the S&P 500’s cumulative A/D line, the relative strength of semiconductors versus the
S&P 500 peaked a week before the most recent high in the S&P 500 and has seen a pretty mean-
ingful pullback since that high.
• One silver lining to Friday’s trading was that the SOX actually outperformed the S&P 500 in a down
tape.
Relative Strength: Semis vs S&P 500 (Last 12 Months)
190
3800
170
3400
150
3000
130
110 2600
Semis vs S&P 500
S&P 500 (Right Axis)
90 2200
1/20 3/20 5/20 7/20 9/20 11/20 1/21
BespokePremium.com The Bespoke Report 1/29/21 Page 8 of 36
For Personal Use Only—Do Not Forward or RedistributeAs the market pulled back this week and breadth deteriorated, we saw the end to what was a pretty
impressive streak.
• Up until Monday, the percentage of S&P 500 S&P 500 Percent of Stocks Above Their 50-DMA
100
stocks above their 50-DMAs had been above
90
70% every day since November 9th; with the 80
average reading in that time being a hair above 70
60
80%. 50
40
• By the end of the week, though, the percentage 30
of stocks above their 50-DMA had dropped be- 20
10
low 50%, a level not seen since the election.
0
1/20 4/20 7/20 10/20 1/21
• Tuesday’s reading brought to an end a streak of
Consecutive Days with 70%+ of S&P 500 Above 50-DMAs
52 trading days in which over 70% of S&P 500 75
stocks traded above their 50-DMAs - the longest
60
such streak since September 2009.
• That was the longest streak since September 45
2009 and the fourth longest streak since at least 30
1990.
15
• Given these streaks come to an end as a result
0
of a number of stocks falling below their 50- '90 '93 '96 '99 '02 '05 '08 '11 '14 '17 '20
DMAs, short term performance for the S&P 500
following the conclusion of these past streaks has been a bit weak (table below)
• Despite the short term weakness, however, performance three, six, and twelve months later has
been much more positive. In fact, all of these periods have averaged stronger than normal returns,
with gains all five times in the three and twelve-month timeframes.
S&P 500 After Long Streaks With 70%+ of Stocks Above 50-DMAs*
Consecutive S&P 500 Performance (%)
Date Days Week Month 3 Month 6 Month Year
8/12/1997 70 -0.06 -0.81 1.75 9.98 17.02
4/22/1998 56 -3.18 -1.02 4.97 -6.03 20.19
7/9/2003 60 -0.82 -3.51 1.80 12.12 11.04
6/15/2009 51 -3.32 -1.94 11.87 19.34 20.73
9/30/2009 52 0.05 -1.37 6.57 10.63 7.96
1/25/2021 52 ? ? ? ? ?
Average -1.46 -1.73 5.39 9.21 15.39
Median -0.82 -1.37 4.97 10.63 17.02
All Other Periods
Average 0.18 0.72 2.13 4.43 9.09
Median 0.31 1.14 2.81 5.19 10.76
* When streaks of 50+ days with 70% or more of S&P 500 stocks above their 50-DMAs
comes to an end
BespokePremium.com The Bespoke Report 1/29/21 Page 9 of 36
For Personal Use Only—Do Not Forward or RedistributeWe not only saw the end to a notable streak of stocks above their 50-DMA, but we also saw a modest
breakdown in the percentage of stocks above their 200-DMA.
• On Wednesday, 88.82% of stocks closed S&P 500 Percent of Stocks Above Their 200-DMA
above their 200-DMAs snapping a streak of 20 100
90
straight trading days of readings above 90%.
80
• Even more impressive, right before this most 70
60
recent streak began, there was another 20- 50
day long streak running from November 23rd 40
30
through December 22nd.
20
• In other words, outside of Wednesday and 10
0
Thursday, since November 23rd there was 1/20 4/20 7/20 10/20 1/21
only one day that less than 90% of S&P 500 Consecutive Days With 90%+ of S&P 500 Stocks Above 200-DMA
60 3/5/2004, 57
stocks were above their 200-DMAs.
10/29/2009, 51
50
• As shown in the second chart at right, there 3/9/2011, 26
40
have only been a handful of past instances 6/3/2013, 21
going back to 1990 that 90% or more of the 30 1/26/2021, 22
12/21/2020, 20
S&P 500 traded above their 200-DMAs for 20 20
days straight or more.
10
0
'90 '92 '94 '96 '98 '00 '02 '04 '06 '08 '10 '12 '14 '16 '18 '20
• As for the performance of the S&P 500 following these instances, returns are more mixed, but the
same pattern is generally still present. In the short term going out six months, the S&P 500 tends
towards underperformance with declines more often than not
• One year out, however, the S&P 500 After Long Streaks With 90%+ of Stocks Above 200-DMAs*
S&P 500 has been higher eve- Consecutive S&P 500 Performance (%)
Date Days Week Month 3 Month 6 Month Year
ry time with gains right inline 3/5/2004 57 -3.14 -1.30 -3.08 -3.33 5.92
with the historical one-year 10/29/2009 51 0.05 2.38 2.94 11.31 10.99
1/21/2010 21 -2.86 -0.65 7.26 -4.20 14.67
return for all periods since
3/9/2011 26 -4.78 1.17 -1.51 -11.73 3.48
1990. 6/3/2013 21 0.15 -1.55 -0.61 10.17 17.30
12/21/2020 20 ? ? ? ? ?
1/22/2021 22 ? ? ? ? ?
Average -2.12 0.01 1.00 0.44 10.47
Median -2.86 -0.65 -0.61 -3.33 10.99
All Other Periods
Average 0.18 0.72 2.13 4.43 9.09
Median 0.31 1.14 2.81 5.19 10.76
* When streaks of 20+ days with 90% or more of S&P 500 stocks above their 200-DMAs
comes to an end
BespokePremium.com The Bespoke Report 1/29/21 Page 10 of 36
For Personal Use Only—Do Not Forward or RedistributeAs shown in our ETF Asset Class Performance Matrix, it was a bad week across the board for equities.
• Every major US index ETF finished the week down at least 3% with mid and small caps faring the
worst. While most indices are still up on the year, both the S&P 500 and DJIA finished the month
down over 1%. Since the election, though, only the DJIA is up less than 10%.
• Every S&P 500 sector dropped at least 1% this week—even Utilities, but the biggest losers were
Energy (some things never change), Materials, Consumer Discretionary, and Financials.
• International ETFs also saw broad-based declines on the week with Mexico and India experiencing
the steepest declines.
• With all the declines in equities, we were surprised to see such modest gains in fixed income.
While they were all higher on the week, the only fixed income ETF in our Matrix that was up more
than 0.10% this week was TIPS.
Asset Class Performance This Week, YTD, and Election Day - Total Return (%)
US Related Election Global Election
ETF Description This Week YTD Day ETF Description This Week YTD Day
SPY S&P 500 -3.35 -1.02 10.60 EWA Australia -4.50 -0.84 16.72
DIA Dow 30 -3.28 -1.92 9.66 EWZ Brazil -2.43 -7.77 25.18
QQQ Nasdaq 100 -3.34 0.26 14.74 EWC Canada -3.29 -0.78 13.04
IJH S&P Midcap 400 -4.99 1.49 18.46 ASHR China -3.43 3.20 14.50
IJR S&P Smallcap 600 -3.55 6.17 29.78 EWQ France -3.26 -2.62 16.21
IWB Russell 1000 -3.42 -0.79 12.11 EWG Germany -3.35 -0.98 15.80
IWM Russell 2000 -4.39 4.85 28.68 EWH Hong Kong -3.80 1.70 14.07
IWV Russell 3000 -3.53 -0.47 13.06 PIN India -5.85 -2.24 15.24
EWI Italy -3.21 -3.70 17.97
IVW S&P 500 Growth -3.23 -0.49 10.77 EWJ Japan -3.25 -0.84 11.92
IJK Midcap 400 Growth -5.51 1.91 17.45 EWW Mexico -6.45 -6.51 17.51
IJT Smallcap 600 Growth -3.55 6.22 29.86 EWP Spain -4.02 -3.77 19.54
IVE S&P 500 Value -3.30 -1.59 10.69 RSX Russia -4.13 -2.07 20.54
IJJ Midcap 400 Value -4.46 1.14 20.01 EWU UK -4.57 -0.24 16.77
IJS Smallcap 600 Value -3.36 6.25 29.79
DVY DJ Dividend -3.30 0.56 12.73 EFA EAFE -3.67 -0.78 14.53
RSP S&P 500 Equalweight -3.76 -0.82 13.14 EEM Emerging Mkts -4.51 3.17 18.43
IOO Global 100 -2.89 0.02 13.03
FXB British Pound 0.12 0.14 5.03 BKF BRIC -3.84 4.57 14.49
FXE Euro -0.29 -0.76 3.44
FXY Yen -0.89 -1.51 -0.31 DBC Commodities 0.66 3.33 17.21
USO Oil -0.14 6.57 31.66
XLY Cons Disc -4.76 0.77 10.30 UNG Nat. Gas 4.44 2.28 -18.95
XLP Cons Stap -1.51 -4.98 0.53 GLD Gold -0.74 -3.22 -3.53
XLE Energy -6.54 3.75 34.97 SLV Silver 5.62 1.71 11.36
XLF Financials -4.58 -1.80 17.12
XLV Health Care -2.18 1.40 10.01 SHY 1-3 Yr Treasuries 0.02 0.02 0.11
XLI Industrials -4.23 -4.27 6.11 IEF 7-10 Yr Treasuries 0.05 -1.09 -0.94
XLB Materials -5.03 -2.42 7.08 TLT 20+ Yr Treasuries 0.08 -3.63 -3.39
XLK Technology -2.94 -0.84 14.26 AGG Aggregate Bond 0.05 -0.74 0.40
XLC Comm Services -2.85 -0.89 11.55 BND Total Bond Market 0.06 -0.86 0.38
XLU Utilities -1.10 -0.88 -3.07 TIP T.I.P.S. 0.17 0.27 2.30
BespokePremium.com The Bespoke Report 1/29/21 Page 11 of 36
For Personal Use Only—Do Not Forward or RedistributeThe last week of the month is typically a busy one for economic data, and this week was no exception.
While it got lost in the shuffle of the Robinhood rally, the advance read on Q4 GDP came in weaker
than expected.
• Q4 GDP had been tracked at almost 8% per GDP: Q4 2020 Annualized Growth Component Contribution (%)
Q3 Q4
the Atlanta Fed’s GDPNow tracker, but the Category Final Adv Change Commentary
Consumption 25.44 1.70 -23.74
actual results missed both that and the Goods 9.55 -0.10 -9.65
4.2% forecasted by Wall Street econo- Durable
Non-Durable
5.20
4.35
0.00
-0.10
-5.20
-4.45
Disappointing goods spend.
mists. Services 15.89 1.80 -14.09 Services the only source of new consumer spend.
Investment 11.96 4.06 -7.90
Fixed 5.39 3.02 -2.37
• Consumer spending rose much less than Residential 2.19 1.29 -0.90 Housing activity remains very strong.
Non-Resi. 3.20 1.73 -1.47 Business investment is doing pretty well.
expected, with spending on durables add- Inventory 6.57 1.04 -5.53 Inventory recovery, but a slow one.
Trade -3.21 -1.52 1.69
ing 0.0% on net to total GDP growth; non- Exports 4.89 2.01 -2.88
durables added 0.1 percentage points Goods
Services
4.87
0.03
1.88
0.14
-2.99
0.11
Rising exports as crop sales roar.
while the recovery in services spend con- Imports -8.10 -3.53 4.57
Goods -7.67 -3.11 4.56 Inventories are low and that's driving imports higher.
tinued, adding 1.8 percentage points. Services -0.43 -0.42 0.01
Government -0.75 -0.22 0.53
•
Federal -0.38 -0.04 0.34 Despite fiscal stimulus, federal spending declining.
The housing market continued to be a ma- State/Local -0.37 -0.19 0.18 State and local governments keep cutting spending.
jor tailwind for overall growth, adding 1.3 Total 33.44 4.02 -29.42
Final Demand 26.87 2.98 -23.89
percentage points to total GDP, while busi- DFPD* 30.83 4.72 -26.11
ness fixed investment added 1.7 percent- *Note: Domestic Final Private Demand: GDP less Gov't, Trade, and Inventory.
age points, a pretty solid clip all things con- Real GDP Is Still Well Below Trend
10.2
sidered.
GDP Natural Log
• Trade was a headwind despite booming 10.0 Post-WW2 to 2000 Trend
crop exports, while government spending 2000 - 2007 Trend
also continued to weigh on growth. 9.8 2009 - 2019 Trend
• 2021’s outlook is bright given progress on
9.6
vaccines and the massive pile of cash on
consumer balance sheets, but keep in
9.4
mind that total output is still well below
Q4 2019’s high water mark and even fur-
9.2
ther below trends in output that predomi-
nated previously.
9.0
• For instance, if GDP had continued on its
post-WW2 trend from 2000 to now, total
% Real GDP Distance From Trend
output would be 30% higher today than it
0
is, while the 2000-2007 trend is more than -5 -2.63 -2.46
-10
half that far away. -15
-20
• Recessions are unavoidable, and any reces- -25
-16.52
sion will knock the path of the economy off -30
-29.13
-35
a previous trend that doesn’t include the Post-WW2 to 2000 to 2007 2009 to 2019 Versus Q4 '19
decline, but these exercises show the im- 2000 Trend Trend Trend
pact of recessions on long-term growth.
BespokePremium.com The Bespoke Report 1/29/21 Page 12 of 36
For Personal Use Only—Do Not Forward or RedistributeNext week, we’ll get some of the first reads on January economic data with the ISM Manufacturing re-
port, but for a preview of what to expect, the various Fed Manufacturing indices give us an idea of
what to expect.
• This month’s regional Fed surveys improved Five Fed Manufacturing Composite: Summary Table
versus the end of the year and generally re- Current Jan-21 %ile Dec-20 Change Oct-20 Change Jan-20 Change
Composite 16.0 93.9 13.4 2.6 15.7 0.3 5.2 10.8
mains in good shape. Shipments 16.3 77.8 15.3 1.0 26.1 -9.8 10.3 6.0
New Orders 16.0 80.9 14.6 1.4 25.2 -9.2 10.4 5.6
• As shown at right, all major indicators of cur- Unfilled Orders
Inventory
9.2
-1.3
94.9
23.6
7.4
-2.3
1.8
1.1
3.9
-5.2
5.3
4.0
-4.8
2.8
14.0
-4.0
rent activity rose across the five districts on an Employment 17.3 95.9 13.5 3.7 11.8 5.5 9.2 8.1
Workweek 11.9 93.4 11.4 0.5 13.9 -2.0 1.1 10.8
average basis, with the biggest spikes coming Delivery Time 21.1 100.0 16.2 5.0 11.5 9.7 0.9 20.2
Prices Paid 42.8 90.9 33.6 9.2 24.5 18.3 17.5 25.3
from delivery time and prices. Prices Received 17.4 88.4 11.2 6.2 6.4 11.0 4.9 12.5
Outlook
• While the best indications of current economic Composite 24.4 81.4 23.2 1.2 22.2 2.2 20.8 3.6
Shipments 38.5 73.8 34.5 4.1 36.0 2.6 35.8 2.7
activity (Shipments and New Orders) are only New Orders 35.9 65.3 32.4 3.5 35.4 0.5 32.0 3.9
Unfilled Orders 7.2 41.7 12.0 -4.8 7.8 -0.6 10.5 -3.3
around the top of the second quintile of their Inventory 3.8 73.3 9.8 -6.0 6.0 -2.2 6.6 -2.8
Employment 30.6 94.9 29.6 1.0 27.5 3.1 20.0 10.6
historical range, the fact that they continue to Workweek 10.3 67.3 14.5 -4.2 10.3 0.1 11.8 -1.5
rise from already solid levels is good; these in- Delivery Time
Prices Paid
9.8
41.7
94.9
77.8
7.8
38.3
2.0
3.4
4.5
34.3
5.3
7.3
5.7
28.1
4.2
13.6
dicators are all sharply improved versus a year Prices Received 27.7 85.4 24.7 3.1 21.4 6.3 18.7 9.0
Capex 20.1 54.2 21.2 -1.1 20.6 -0.5 19.9 0.2
ago before COVID ever hit the US economy.
Five Fed Less Optimistic Than ISM But Still Positive
• Leading indicators like the Unfilled Order book 62
and Inventories both delivered solid results as 60
58
well. 56
54
• Future expectations are much more mixed, but 52
New Orders and Shipments improved. 50
48
• Overall, our index points to a sequential im- 46
44 ISM Manufacturing PMI, 60.7
provement to the best activity levels since the
42 ISM Manufacturing PMI - Modelled on 5 Fed, 57.9
last cycle peak at ISM weights, but ISM is al- 40
ready outperforming pretty impressively. 38 R-Squared = 0.747
36
• It’s also worth noting that supply chain disrup-
tions of various kinds are artificially flattering Exploding Delivery Times Point To Supply Chain Constraints
the ISM-weighted index.
25
• As shown at right, the Delivery Times index is 20
at a record level, indicating a sharp increase in 15
the time it takes for inbound orders to arrive 10
and feeds into higher ISM readings even if the
5
more consistent indicators of activity haven’t
0
surged.
-5
-10 Current, 21.1
-15 Outlook, 9.8
-20
BespokePremium.com The Bespoke Report 1/29/21 Page 13 of 36
For Personal Use Only—Do Not Forward or RedistributeWhile a number of economic indicators have seen tremendous rebounds off their COVID lows, one that
sticks out as a major outlier has been Consumer Confidence; that remained the case in January as well.
• In this month's report, overall Consumer Confidence: 2000 - 2021
confidence rose from 87.1 up 145
to 89.3 compared to expecta- 125
tions for an increase to
105
89.0. As illustrated in the 89.3
85
chart, after the initial plunge
last Spring, Consumer Confi- 65
dence has been bouncing up 45
and down for the last ten-
25
months at levels well below '00 '02 '04 '06 '08 '10 '12 '14 '16 '18 '20
the pre-Covid peak.
• Whether you look at consumer Consumer Confidence (Present vs Future): 2000 - 2021
sentiment towards the present 200
180
or the future, it's a similar pic-
160
ture. Expectations were al- 140
Present Situation
ready much lower heading into 120
COVID, so they didn't fall nearly 100 Expectations
92.5
80 84.4
as much, but after the plunge
60
in the Present Situation Index, 40
consumers feel about equally 20
'00 '02 '04 '06 '08 '10 '12 '14 '16 '18 '20
confident about the present
than they do about the future.
• With all the positive news about the vaccine rollout and the market at record highs, why aren't
consumers more confident? Chalk it up as a case of "It's a recession when your neighbor loses his
job; it's a depression when you lose yours."
• As shown in the chart below, the gauge of "Jobs Plentiful" embedded in the Consumer Confidence
report remains extremely weak, and if you look closely, is also showing some signs of rolling
over. When consumers are worried about hanging on to their jobs, it's going to be hard for them
to be confident.
Consumer Confidence (Jobs Plentiful): 1967 - 2020
60
50
40
30
20 20.6
10
0
'67 '77 '87 '97 '07 '17
BespokePremium.com The Bespoke Report 1/29/21 Page 14 of 36
For Personal Use Only—Do Not Forward or RedistributeThere have been some crazy moves in the stock market, so we were surprised to see that consumer
optimism towards the stock market actually fell this month.
• In this month's survey, just 34.8% of Consumer Confidence: Higher vs Lower Stock Prices: 1987 - 2021
consumers said they expect stock 60 Higher Stock Prices
Lower Stock Prices
prices to increase, while nearly an 50
equal number expect stock prices to
40
decline. In this survey, at least, id 34.8
34.6
doesn't appear as though consum- 30
ers are anywhere close to irrational- 20
ly exuberant.
10
• We also wanted to highlight which '87 '92 '97 '02 '07 '12 '17
direction consumers expect interest Consumer Confidence: Spread Between Stock Prices "Higher" and "Lower"
rates to go. 40
30
• Back in April at the height of the 20
pandemic, the percentage of con- 10
sumers expecting interest rates to 0 0.2
rise was nearly equal to the per- -10
-20
centage that expected rates to
-30
rise. Since then, though, we've seen -40
a steady increase in the percentage '87 '92 '97 '02 '07 '12 '17
of those expecting rates to rise.
Consumer Confidence: Higher vs Lower Interest Rates Expectations: 1987 - 2021
• Granted, when rates are at or near 90
zero, it's hard to expect rates to go 80 Higher
70
any lower, but with little improve- 60
ment in both overall confidence 50 49.9
and the percentage of consumers 40
30
viewing the job market as getting Lower
20
better, you wouldn't expect to see 10
14.8
half of all consumers anticipating a 0
'87 '92 '97 '02 '07 '12 '17
higher rate environment.
Consumer Confidence: Higher vs Lower Interest Rates Expectations: 1987 - 2021
80
60
40 35.1
20
0
-20
-40
'87 '92 '97 '02 '07 '12 '17
BespokePremium.com The Bespoke Report 1/29/21 Page 15 of 36
For Personal Use Only—Do Not Forward or RedistributeLike confidence in the US, we’re also seeing the impact of shutdowns and restrictions on activity show
up in confidence data in Europe.
• Specifically, Germany’s latest IFO survey of businesses missed expectations at all three levels
(business climate, expectations, and current assessment) and fell sequentially versus December.
• The trend in IFO confirms the
German Q1 At Risk Per IFO Deceleration
intuition that COVID’s winter
8 Germany GDP YoY 110
surge has wrecked havoc on IFO Germany Expectations: Q Avg, Adv 1Q
6
European service businesses 4 105
and is dragging the overall 2 100
economy down. 0
-2 95
• The Expectations index is con-
-4
sistent with a mid-single digit 90
-6
YoY growth rate in Q4, which
-8 85
means a small sequential de- -10
cline in Q1 is likely owing to -12 80
both the drop in services ac-
tivity and the manufacturing
economy.
• Similarly, GfK consumer confidence numbers released mid-week also showed a large, unexpected
drop in German consumer confidence.
• Like it’s US counterpart, that number is almost back to where it was at the lows last spring.
• That’s not a great backdrop for activity in the Eurozone, although Germany has ample capacity for
stimulus, and this weakness could be just the catalyst needed to get the ball moving in that direc-
tion.
German Consumer Confidence Collapse: 2005 - 2021
15
10
5
0
-5
-10
Germany GfK Consumer Confidence
-15
-20
-25
BespokePremium.com The Bespoke Report 1/29/21 Page 16 of 36
For Personal Use Only—Do Not Forward or RedistributeWith Friday’s slug of economic data, we also received the final December readings for our Matrix of
Economic Indicators. The Matrix (and an explanation) is shown on the following page.
• We have to say that the resiliency of the US economy in the face of the winter COVID wave has
been impressive.
• After a six-month streak of positive readings and an incredible four-months where the net bottom
line number was +20 or above, momentum briefly stalled in November, but bounced right back in
December with a reading of positive four.
• We’ve said it several times in the past, we’ll say it here, and then again in a few pages, the original
recession from the initial COVID outbreak is over.
Net Number of Economic Indicators Accelerating Y/Y: 2000 - 2020
30 27 27
23 24
20
10
4
0
-10
-20
-30
10/08, -28
3/20, -34
-40
'98 '00 '02 '04 '06 '08 '10 '12 '14 '16 '18 '20
Below are a few of the key takeaways from the current update:
• November saw a slowdown in momentum for the Manufacturing/Output category, but things
bounced right back in December as every indicator besides Durable Goods saw positive momen-
tum. The ISM reports were especially strong with Manufacturing above 60 and Services near 58.
• Employment, on the other hand, was not as robust. Of the seven indicators in the category, Aver-
age Hourly Earnings was the only indicator with positive momentum. The last time breadth in the
category was as weak as it was in December was in April.
• Housing also saw some weaker momentum to close out 2020 as the only indicators to show posi-
tive momentum were Building Permits and Pending Home Sales. The last time breadth in the sec-
tor was as weak was in April. The key difference between now and then, though, was that while y/
y rates were all declining by double-digit percentages in April, they are all mostly rising at double-
digit percentages to close out the year.
• After two months where the majority of Inflation indicators showed negative momentum, the
trend reversed course in December as all but one indicator showed positive momentum. Looking
ahead, momentum in inflation indicators is likely to be positive with weak y/y comp readings.
• Indicators tracking the Consumer have been weak now for the last three months.
BespokePremium.com The Bespoke Report 1/29/21 Page 17 of 36
For Personal Use Only—Do Not Forward or RedistributeThe Matrix of Economic Indicators below summarizes the y/y change by month (unless otherwise not-
ed) in economic indicators over the last year by category. The numbers in the left-most columns show
the most recent y/y readings as of the end of November (or December where available). We also high-
light each release to show if it got better (green) or worse (red) versus its prior reading. Charts of each
indicator are provided on pages four through eight, and we strongly suggest you take a look at them in
order to grasp just how abrupt the fall-off in economic activity and subsequent rebound has been.
As we have been pointing out for several months now, a visual glance at the Matrix and the rebound in
December suggests that the recession that began at the end of February came to an end in April.
Matrix of Economic Indicators: 12/31/20
Category
Indicator Year/Year Change (Unless Otherwise Noted)
Manufacturing/Output 12/31/20 11/30/20 10/31/20 9/30/20 8/31/20 7/31/20 6/30/20 5/31/20 4/30/20 3/31/20 2/29/20 1/31/20
Chicago PMI (actual) 58.70 57.80 60.10 61.50 51.00 53.00 37.30 32.90 35.30 47.80 48.80 43.20
ISM Manufacturing (actual) 60.50 57.70 58.80 55.70 55.60 53.70 52.20 43.10 41.70 49.70 50.30 51.10
ISM Services (actual) 57.70 56.80 56.20 57.20 57.20 56.60 56.50 45.40 41.60 53.60 56.70 55.90
Industrial Production -3.58 -5.41 -4.97 -6.28 -6.55 -6.58 -10.50 -15.72 -16.26 -4.70 -0.24 -0.85
Capacity Utilization -3.40 -5.40 -5.14 -6.62 -7.07 -7.28 -11.36 -16.69 -17.40 -6.17 -1.95 -2.70
Durable Goods 1.44 4.12 0.22 -1.62 -4.54 -4.50 -12.42 -18.64 -30.29 -18.64 1.62 -3.62
Durable Goods ex Tran 6.46 5.28 4.67 2.51 0.77 -0.09 -4.03 -6.92 -10.28 -2.22 -0.29 -0.39
Employment
Jobless Claims (4 Wk Avg) 835.5 740.5 788.5 870.3 992.5 1339.0 1499.0 2288.3 5040.3 2666.8 214.0 210.0
ADP Employment -7.35 -7.14 -7.26 -7.52 -7.99 -8.25 -8.31 -11.69 -14.24 1.08 1.45 1.45
Non Farm Payrolls -6.17 -5.96 -6.02 -6.34 -6.68 -7.54 -8.59 -11.65 -13.42 0.54 1.55 1.38
Average Hourly Earnings 5.24 4.54 4.46 4.47 4.82 4.67 5.37 6.62 7.67 3.52 3.32 3.33
Average Workweek (actual) 34.20 34.20 34.20 34.10 34.10 34.00 34.00 34.10 33.50 33.40 33.70 33.60
Unemployment Rate (actual) 3.10 3.10 3.30 4.30 4.70 6.60 7.50 9.60 11.10 0.60 -0.30 -0.50
Challenger Job Cuts 134.54 45.39 60.45 185.88 116.46 576.15 305.51 577.77 1576.86 266.89 -26.26 27.83
Housing
Building Permits 16.95 8.28 2.73 7.52 0.34 8.57 -1.18 -9.12 -19.85 2.19 10.19 16.72
Housing Starts 5.17 15.10 14.18 12.79 -0.29 22.69 2.43 -18.14 -26.28 5.49 37.82 27.12
New Home Sales 15.18 19.11 34.42 32.92 38.39 48.11 15.70 16.33 -14.16 -12.57 7.67 21.51
Existing Home Sales 22.24 26.13 26.80 21.44 10.13 8.72 -11.65 -26.64 -17.21 0.76 7.06 8.84
Pending Home Sales 21.37 16.57 20.43 20.76 24.32 15.52 5.59 -5.14 -33.78 -16.32 9.32 5.83
Monthly Supply -18.87 -25.00 -34.55 -32.08 -36.36 -40.00 -21.82 -20.90 11.48 12.07 -9.84 -23.08
NAHB Homebuilder Index 13.16 26.76 19.72 22.06 16.42 10.77 -9.38 -43.94 -52.38 16.13 19.35 29.31
Inflation
CPI 1.29 1.16 1.20 1.41 1.32 1.03 0.71 0.24 0.38 1.52 2.32 2.48
Core CPI 1.61 1.65 1.63 1.73 1.73 1.57 1.19 1.24 1.44 2.10 2.37 2.27
PPI -0.63 -1.30 -1.11 -1.07 -1.46 -1.89 -2.14 -3.00 -5.03 -1.60 1.28 2.57
Core PPI 1.44 1.20 1.25 1.30 1.25 1.11 1.01 1.06 1.21 1.06 1.21 1.02
PCE 1.28 1.12 1.19 1.35 1.24 1.01 0.92 0.54 0.48 1.34 1.84 1.88
Core PCE 1.45 1.37 1.41 1.53 1.43 1.26 1.14 1.01 0.93 1.65 1.87 1.75
Import Prices -0.32 -0.96 -0.96 -1.28 -1.36 -2.79 -3.98 -6.30 -6.78 -4.19 -1.27 0.48
Import Prices ex Petrol. 1.79 1.61 1.70 1.70 1.07 0.18 -0.09 -0.71 -1.06 -0.97 -0.80 -0.80
Consumer
Consumer Confidence -32.06 -26.74 -19.59 -19.79 -35.69 -32.47 -20.92 -34.58 -33.67 -4.35 0.91 7.15
Michigan Confidence -18.73 -20.56 -14.35 -13.73 -17.48 -26.32 -20.47 -27.70 -26.13 -9.45 7.68 9.43
Personal Income 4.09 3.53 5.43 6.42 5.77 9.08 8.23 9.59 14.27 1.83 4.06 3.66
Personal Spending -2.05 -1.57 -0.73 -0.62 -1.73 -2.65 -3.72 -9.16 -16.14 -3.42 4.50 4.62
Retail Sales 2.90 3.68 5.44 6.09 3.61 2.70 2.23 -5.55 -19.86 -5.59 4.48 4.87
Retail Sales ex Autos 1.11 3.12 4.18 4.84 3.19 1.71 0.78 -6.71 -16.64 -0.97 4.12 4.43
Auto Sales -2.57 -9.01 -2.05 -4.94 -10.49 -13.67 -24.57 -29.42 -47.68 -35.03 1.63 1.45
Total 4 -7 2 24 20 27 24 18 -26 -34 -2 5
Stronger than prior month. Weaker than prior month.
BespokePremium.com The Bespoke Report 1/29/21 Page 18 of 36
For Personal Use Only—Do Not Forward or RedistributeLike our Matrix of Economic Indicators, Thursday’s release of Leading Economic Indicators looks more
like an economy firing on all cylinders than one in a recession.
• The ratio of the Leading Indicators relative to Coincident Indicators has historically done a great job
of anticipating turns in the business cycle. Ahead of every recession since 1960, the ratio peaked
well in advance of the recession.
• Even leading up to the current recession, while the ratio wasn’t down nearly as much as it has been
down leading up to prior recessions, it was drifting lower. In other words, leading up to COVID the
economy was already vulnerable.
• The real interesting aspect of the ratio is that Thursday’s release which included revisions, showed
that as of November the ratio made a new multi-year high, taking out its prior high from 26
months ago.
• While there was a 27-month span (lower chart) where the ratio went without hitting a new inter-
mediate term high and the economy never went into a recession, in the current period, which ac-
tually included a recession, it only took 26 months for the ratio to take out its prior high.
Ratio of Leading to Coincident Indicators: 1959 - 2020
1.3
Recessions
Ratio (LEI/COI)
1.2
1.1
1.058 1.060
1.0
0.9
0.8
'59 '63 '67 '71 '75 '79 '83 '87 '91 '95 '99 '03 '07 '11 '15 '19
Ratio of Leading to Coincident indicators: 2009 - 2020
1.08 Recessions 26 Months
Ratio (LEI/COI)
1.04 18 Months
1.00
27 Months
0.96
0.92
0.88
0.84
0.80
'09 '10 '11 '12 '13 '14 '15 '16 '17 '18 '19 '20
BespokePremium.com The Bespoke Report 1/29/21 Page 19 of 36
For Personal Use Only—Do Not Forward or RedistributeThis week was the busiest one of the current reporting period, but before getting into the overall
trends, we wanted to highlight results from Caterpillar (CAT) and more specifically their update on ma-
chinery sales through year end.
• CAT reported Q4 EPS 46% above forecasts Caterpillar (CAT): Last 12 Months
220
thanks to a 7% revenue beat that had
200
management targeting “stronger” Q1 sales
180
thanks to construction activity, as well as
160
“sequential improvement” for operating
140
margins.
120
• CAT’s machinery sales for the month of 100
December also saw broad-based strength. 80
1/20 3/20 5/20 7/20 9/20 10/20 12/20
On a three-month average basis, machin-
ery sales improved from a decline of 11% Caterpillar Worldwide Machinery Sales: June 2009 - December 2020
80 Three Month Rolling Y/Y Sales (%)
to a drop of just 2%. While still down, De-
60
cember’s sales reading was the least nega-
Y/Y Change in Machinery Sales
40
tive reading since November 2019.
20
• Sales trends also saw broad-based im- 0
-2
provement in each of the regions CAT -20
breaks sales out by. -40
-60
• Sales declines in North America more than 06/09 06/10 06/11 06/12 06/13 06/14 06/15 06/16 06/17 06/18 06/19 06/20
halved improving from –20% to –9%, which Caterpillar Y/Y Machinery Sales Growth (3m-Avg): December vs November
was the smallest decline of 2020. 40
31
30
• If only every region could be like Latin
20
Percent Change (%)
America. December’s 31% increase in 10
8 7
sales was the best since May 2018. 0
2
-2
• While sales in the EAME region were still -10
-11
-9 -10
-5
down, they improved from a decline of -20
-20
-30
10% to a drop of just 5%. Worldwide North America Latin America EAME Asia
• Finally, sales in Asia continued to lead the
Caterpillar Sales (m/m % Change): Global vs Asia
global trend. With y/y growth of 7%, the 80
last time sales were higher was in Novem- 60 Worldwide Asia
ber 2018. As shown on the last chart to 40
the right, sales trends in Asia have tended 20
to track and, more recently, lead global 0
trends. -20
-40
• While it’s just one company, given its -60
broad reach, sales trends from CAT point ''09 ''10 ''11 ''12 ''13 ''14 ''15 ''16 ''17 ''18 ''19 ''20
to continued improvement in the econo-
my.
BespokePremium.com The Bespoke Report 1/29/21 Page 20 of 36
For Personal Use Only—Do Not Forward or RedistributeOnce again this quarter, results this earnings season have been very strong relative to expectations.
• Since the start of 2021, 321 companies have reported earnings. 83% of companies reporting have
topped EPS forecasts, 77% have topped sales estimates, and a net of 14% of companies have raised
guidance.
• While aggregate results have been impressive, stock price reactions have been uninspiring. On an
average basis, stocks are gapping up 0.21% in reaction to earnings, but investors are selling into the
strength. From the open to close, the average stock has declined 1.19% bringing the total day’s
decline to 1.0%.
• Ironically, companies that have topped EPS forecasts have actually performed worse than stocks
that have missed EPS forecasts. Of the 267 companies that have topped forecasts since the start of
the year, the average one day performance of their share prices has been a decline of 1.17%.
• Meanwhile, the 45 companies that have missed EPS forecasts have risen an average of 0.15%.
• Triple Plays are the cream of the crop when it comes to earnings reports, and you would expect
investors to bid up these stocks in reaction to their reports. Even here, though, while the 46 triple
plays we have seen so far this year have gapped up an average of 1.74%, they have declined by an
average of 1.31% from the open to close. They’re still finishing up on the day, but with an average
gain of 0.38%, there hasn’t been a whole lot of excitement for what are typically the best of the
best.
BespokePremium.com The Bespoke Report 1/29/21 Page 21 of 36
For Personal Use Only—Do Not Forward or RedistributeThe charts below from our Earnings Explorer tool show the disconnect between earnings results and
share price reactions.
• The earnings beat rate remains near historic highs. Through Friday, the EPS beat rate was nearly
81% versus a historical average of 59.37%.
• While the sales beat rate hasn’t been as extreme, at a current rate of just under 75%, companies
are topping analyst revenue forecasts at a rate of 18 percentage points more than the historical
average.
• Guidance continues to climb to more historic highs. On a net basis, 36% of companies reporting
earnings have raised guidance which is double the record high from before the current period.
• Despite the continued strength in re-
sults relative to expectations, stock
price reactions have been weak relative
to history. While the average one-day
stock reaction of companies reporting
has been a modest decline (-0.01%),
companies that have reported earnings
over the last three months have
dropped an average of 0.29%.
• Heading into this earnings season, ex-
pectations were very high, and because
of that it looks like the bar was just set
impossibly high.
BespokePremium.com The Bespoke Report 1/29/21 Page 22 of 36
For Personal Use Only—Do Not Forward or RedistributeFocusing specifically on triple plays, the past two earnings seasons have seen triple plays come in at a
historic pace.
• In our data going back to 2001, last Percentage of Stocks Reporting Triple Plays by Quarter
16 Q4 '20, 13.57
quarter set a record with 14.6% of Q3 '20, 14.60
companies reporting a triple play. 14
• While there are still a few weeks left in 12
the current earnings season, of the 457 10
companies that reported so far
8
through Thursday morning, 13.57%
reported a triple play. 6
• Although that is lower than last quar- 4
ter, it is still on pace to be the second 2
most for any quarter. 0
• As for how these stocks are performing
in response to earnings, repeating last Average Full Day Performance (%) of Stocks Reporting Triple Plays by Quarter
quarter’s pattern, it hasn’t been great. 10
Triple Plays
All
• On average, stocks reporting triple 8
plays are only rising 0.83% the day
after earnings. That compares to a 6
0.7% loss for all reporting companies
4
so far this quarter.
• At this pace, it would surpass last quar- 2
Q3 '20, 2.41
Q4 '20, 0.83
ter for the worst average reaction to
0
earnings of any quarter of the past two
-0.70
decades
-2
• Additionally, a record low share of
companies reporting triple plays are Percentage of Triple Plays With Positive Stock Price Reactions on Earnings Days
seeing their stocks rise on earnings. 100
Triple Plays
• Less than half of the stocks that have 90
All
reported triple plays so far this earn-
80
ings season have made a move higher
the session after reporting. 70
•
Q3 '20, 62.77
Similarly, the average percentage of 60 Q4 '20, 45.16
stocks rising on earnings this earnings
50
season is on pace for a record low at
only 38.95%. 40
Q4 '20, 38.95
• It’s still early, but investors haven’t 30
been impressed with strong earnings
results.
BespokePremium.com The Bespoke Report 1/29/21 Page 23 of 36
For Personal Use Only—Do Not Forward or RedistributeEven though triple plays in aggregate are not having the best quarter in reaction to earnings, there
have been some notable winners. In the table below, we show the stocks that have reported a triple
play in their fourth quarter results recently that have experienced the best and worst full day stock
price reactions.
• So far this earnings season, there have been just five that have risen double digits on earnings.
• Topping that list is Sumo Logic (SUMO), which has also been one of the most heavily shorted stocks
recently.
• The vast majority of both the best and worst performing triple plays are from the Tech sector, but
there is also representation from Consumer Discretionary, Consumer Staples and Industrials.
• Those from the Consumer Staples and Industrials sectors can be found in the best performing
while the opposite is true for Consumer Discretionary.
• Whereas there are five stocks that rose double digits, there are two that fell by double digits on
earnings.
• Additionally, we would note that multiple large cap semiconductor names like Texas Instruments
(TXN), Advanced Micro Devices (AMD), and Intel (INTC) all found themselves in the list of the worst
performers.
Top 10 Best and Worst Performing Q4 2020 Triple Plays
EPS ($/share) Revenues (mm $) Performance (%)
Ticker Name Sector Date Time Actual vs. Est. Actual vs. Est. Gap Open to Close Full Day
SUMO Sumo Logic Technology 12/7/20 PM 0.06 0.30 51.90 2.80 10.50 6.83 18.05
PTC PTC Technology 1/27/21 PM 0.97 0.31 429.10 46.90 10.82 3.31 14.48
CRWD CrowdStrike Technology 12/2/20 PM 0.08 0.08 232.50 18.10 12.46 1.05 13.64
ESTC Elastic Technology 12/2/20 PM -0.03 0.17 144.90 14.40 8.88 3.41 12.59
WDFC WD-40 Cons. Staples 1/7/21 PM 1.72 0.69 124.60 17.80 14.88 -2.79 11.68
URI United Rentals Industrials 1/27/21 PM 5.04 0.78 2279.00 109.40 3.99 3.20 7.32
MTSI MACOM Technology Technology 1/28/21 AM 0.46 0.04 148.50 0.60 2.38 4.61 7.09
AOS AO Smith Industrials 1/28/21 AM 0.74 0.16 834.50 65.40 4.31 2.58 6.99
FLEX Flex Ltd Technology 1/28/21 AM 0.49 0.12 6700.00 467.90 15.09 -7.23 6.76
BC Brunswick/DE Cons. Discret. 1/28/21 AM 1.32 0.30 1161.10 181.80 -0.24 -4.09 -4.32
CHWY Chewy Cons. Discret. 12/8/20 PM -0.08 0.05 1782.00 56.80 -1.45 -3.12 -4.52
AVT Avnet Technology 1/27/21 PM 0.48 0.09 4668.20 403.30 1.09 -5.77 -4.75
TXN Texas Instruments Technology 1/26/21 PM 1.64 0.31 4076.00 468.60 -2.93 -2.11 -4.98
GLW Corning Technology 1/27/21 AM 0.52 0.04 3350.00 172.10 -2.74 -2.54 -5.22
CALX Calix Technology 1/27/21 PM 0.37 0.04 170.00 10.50 5.52 -10.36 -5.41
SPWH Sportsman's Warehouse Cons. Discret. 12/2/20 PM 0.71 0.24 385.70 62.00 0.07 -6.14 -6.08
AMD Advanced Micro Devices Technology 1/26/21 PM 0.52 0.22 3244.00 218.60 -3.81 -2.48 -6.20
INTC Intel Technology 1/21/21 PM 1.52 0.41 20000.00 2521.90 -5.78 -3.72 -9.29
HZO MarineMax Cons. Discret. 1/28/21 AM 1.04 0.48 411.50 38.70 -1.05 -10.40 -11.34
MDLA Medallia Technology 12/3/20 PM 0.01 0.02 121.00 4.10 -3.22 -10.35 -13.24
BespokePremium.com The Bespoke Report 1/29/21 Page 24 of 36
For Personal Use Only—Do Not Forward or RedistributeYou can also read