PPF Telecom Group 1H2021 results - 8 September 2021

Page created by Duane George
 
CONTINUE READING
PPF Telecom Group 1H2021 results - 8 September 2021
8 September 2021

PPF Telecom Group
1H2021 results
                    1
PPF Telecom Group 1H2021 results - 8 September 2021
Disclaimer
IMPORTANT: You must read the following before continuing. The following applies to this document, the oral presentation of the information in this document by PPF Telecom Group B.V. (the Company) or any person on
behalf of the Company, and any question-and-answer session that follows the oral presentation (collectively, the Information). In accessing the Information, you agree to be bound by the following terms and conditions.
THIS PRESENTATION IS NOT AN OFFER OR SOLICITATION OF AN OFFER TO BUY OR SELL SECURITIES. IT IS SOLELY FOR USE AT AN INVESTOR PRESENTATION AND IS PROVIDED FOR INFORMATION
PURPOSES ONLY. THIS PRESENTATION DOES NOT CONTAIN ALL OF THE INFORMATION THAT IS MATERIAL TO AN INVESTOR.

The Information may not be reproduced, redistributed, published or passed on to any other person, directly or indirectly, in whole or in part, for any purpose. The distribution of this presentation and other information in
connection with the issue of any securities by the Company in certain jurisdictions may be restricted by law and persons into whose possession this presentation or any document or other information referred to herein
comes should inform themselves about and observe any such restrictions. Any failure to comply with these restrictions may constitute a violation of the securities laws of any such jurisdiction. This presentation and any
materials distributed in connection with this presentation are not directed to, or intended for distribution to or use by, any person or entity that is a citizen or resident or located in any locality, state, country or other jurisdiction
where such distribution, publication, availability or use would be contrary to law or regulation or which would require any registration or licensing within such jurisdiction. The Company does not accept any liability to any
person in relation to the distribution or possession of this presentation in or from any jurisdiction.
The Information is not an offer of securities for sale in the United States and is not for publication or distribution to US persons (within the meaning of Regulation S under the United States Securities Act of 1933, as amended
(the Securities Act)). The securities issued by the Company have not been and will not be registered under the Securities Act or with any securities regulatory authority of any state or other jurisdiction of the United States
and may not be offered, sold or delivered within the United States or to U.S. persons except pursuant to an exemption from, or in a transaction not subject to, the registration requirements of the Securities Act and applicable
state securities laws. Accordingly, any securities of the Company will be offered, sold or delivered outside the United States to persons who are not US persons (as defined in Regulation S under the Securities Act
(Regulation S)) in offshore transactions in reliance on Regulation S and in accordance with applicable laws. Any failure to comply with the foregoing restrictions may constitute a violation of US securities laws.
The Information is being distributed to, and is directed only at (i) persons who are outside the United Kingdom; or (ii) persons who are investment professionals within the meaning of Article 19(5) of the Financial Services and
Markets Act 2000 (Financial Promotion) Order 2005 (the Order); (iii) high net worth entities, and other persons to whom it may lawfully be communicated, falling within Article 49(2)(a) to (d) of the Order; or (iv) any other
persons to whom it may otherwise lawfully be communicated or caused to be communicated (all such persons in (i) to (iv) together being referred to as Relevant Persons). Any security, investment or investment activity to
which this presentation relates will only be available to and will only be engaged with, Relevant Persons. Any person who is not a Relevant Person should not act or rely on this presentation or any of its contents.
This Information does not constitute a recommendation or investment advice regarding any securities of the Company. The Information does not constitute an offer or an agreement, or a solicitation of an offer or an
agreement, to enter into any transaction (including for the provision of any services). No assurance is given that any such transaction can or will be arranged or agreed. Any decision to purchase any securities of the
Company should be made solely on the basis of the final terms and conditions of the securities and the information to be contained in the base listing particulars or equivalent disclosure document produced in connection
with the offering of such securities. The base listing particulars may contain information different from the Information. Before entering into any transaction, you should consider the suitability of the transaction to your
particular circumstances and independently review (with your professional advisers as necessary) the specific financial risks as well as the legal, regulatory, credit, tax and accounting consequences. This document does not
disclose all the risks and other significant issues related to an investment in any securities/transaction. Prior to transacting, potential investors should ensure that they fully understand the terms of any securities/transaction
and any applicable risks.
No representation, warranty or undertaking, express or implied, is made as to, and no reliance should be placed on, the fairness, accuracy, completeness or correctness of the Information or the opinions contained therein
(and whether any information has been omitted from the presentation). The Information has not been independently verified and will not be updated. The Information, including but not limited to forward-looking statements,
applies only as of the date of this document and is not intended to give any assurances as to future results. To the extent permitted by law, the Company and each of its respective directors, officers, employees, affiliates,
advisers and representatives disclaim all liability whatsoever (in negligence or otherwise) for any loss, however arising, directly or indirectly, from any use of this presentation or its contents or otherwise arising in connection
with this presentation. The Company expressly disclaims any obligation or undertaking to disseminate any updates or revisions to the Information, including any financial data or forward-looking statements, and will not
publicly release any revisions it may make to the Information that may result from any change in the Company’s expectations, any change in events, conditions or circumstances on which these forward-looking statements
are based, or other events or circumstances arising after the date of this document. Market data used in the Information not attributed to a specific source are estimates of the Company and have not been independently
verified.
The Information may contain various forward-looking statements that relate to, among other things, events and trends that are subject to risks and uncertainties that could cause the actual business activities, results and
financial position of the of the Company and its subsidiaries (collectively, the “Group”) to differ materially from the information presented herein. These statements may include, without limitation, any statements preceded by,
followed by or including words such as “estimate”, “project”, “intend”, “anticipate”, “believe”, “expect”, “should” and similar expressions, as they relate to the Group and its management, are intended to identify such forward-
looking statements. Investors are cautioned not to place undue reliance on these forward-looking statements, which speak only as of the date of this presentation. The Issuer does not undertake any obligations publicly to
release the result of any revisions to these forward-looking statements to reflect the events or circumstances after the date of this presentation or to reflect the occurrence of unanticipated events.
When relying on forward-looking statements, investors should carefully consider the foregoing risks and uncertainties and other events, especially in light of the political, economic, social and legal environment in which the
Group operates. Factors that might affect such forward-looking statements include, among other things, overall business and government regulatory conditions, changes in tariff and tax requirements (including tax rate
changes, new tax laws and revised tax law interpretations), interest rate fluctuations and other capital market conditions, including foreign currency exchange rate fluctuations, economic and political conditions in the Czech
Republic, Slovakia, Hungary, Bulgaria, Serbia, Montenegro and other markets, and the timing, impact and other uncertainties of future actions. The Company does not make any representation, warranty or prediction that
the factors anticipated by such forward-looking statements will be present, and such forward-looking statements represent, in each case, only one of many possible scenarios and should not be viewed as the most likely or
standard scenario.

                                                                                                                                                                                                                                           2
PPF Telecom Group 1H2021 results - 8 September 2021
Meet the presenters

       Jan Tomaník                                                            Lukáš Kubesa
       Investment manager of PPF Group                                        Financial Manager of PPF Telecom Group
       10 years experience in telco M&A                                       5 years experience in telco, CETIN and PPF
                                                                              12 years in finance
       •   Acquisition of Telenor CEE and subsequent structural separation    •   Financial Manager of PPF Telecom Group (since 2018)
       •   Structural separation of O2 and CETIN and subsequent refinancing   •   Head of Financial reporting of CETIN (2016-2018)
       •   Acquisition of Telefónica O2 CR                                    •   Senior financial reporting specialist at Raiffeisenbank CZ (2012-2016)
       •   Czech 4th mobile operator project                                  •   Senior Audit Associate at PwC (2009-2012)

                                                                                                                                                           3
PPF Telecom Group 1H2021 results - 8 September 2021
Strong retail and infrastructure position in six markets
                                                                                                                                                                                                               1
Market leader in CEE region (excl. Poland) with 33% retail market share
                                                2

                                  Group                                                           Group                                                               Telenor CEE
Czechia                                                                Czechia                                                                          Hungary
 Fixed network
                                                                        ▪   5,987k mobile subscribers3                                                  ▪   3,487k mobile subscribers3
 ▪    1.2m active lines                                                                                                                                                                                       9%
                                                                        ▪   35% market share1                                                           ▪   29% market share1
 ▪    1.0m FBB6 connections                   22%                                                                                26%
                                                                        ▪   €11.0 ARPU4                        mobile                                   ▪   €12.7 ARPU4                     mobile
 Mobile network                                                                                                + fixed2
                                       EBITDA share                     ▪   869k FBB6 subs                                   EBITDA share                                                             EBITDA share
 Population coverage
 ▪    97% 4G                                                           Slovakia                                                                         Bulgaria
 ▪    100% total
                                                                        ▪   2,236k mobile subscribers3                                                  ▪   3,463k mobile subscribers3
                                                                                                                                  9%                                                                          8%
Hungary                                                                 ▪   28% market share1                                                           ▪   35% market share1
 Population coverage                                                    ▪   €10.7 ARPU4                         mobile                                  ▪   €9.4 ARPU4                       mobile

 ▪    100% 4G                                                                                                                EBITDA share                                                             EBITDA share
 ▪    100% total                             6%
                                                                                                                                                        Serbia
                                       EBITDA share
Bulgaria                                                                                                                                                ▪   2,888k mobile subscribers3
                                                                                                                                                                                                              9%
                                                                                                                                                        ▪   40% market share1
 Population coverage
                                                                                                                                                        ▪   €9.7 ARPU4                      mobile
 ▪    97% 4G
                                             5%                                                                                                                                                       EBITDA share5
 ▪    99% total
                                       EBITDA share
                                                                                                                                                        Montenegro
Serbia
                                                                                                                                                        ▪   327k mobile subscribers3
 Population coverage                                                                                                                                                                                          9%
                                                                                                                                                        ▪   30% market share1
 ▪    97% 4G
                                             5%                                                                                                         ▪   €9.4 ARPU4
 ▪    99% total                                                                                                                                                                                       EBITDA share5
                                       EBITDA share
Source: Company data, Analysys Mason
[1] Market share for the CEE region is calculated as weighted average of mobile revenue market share for countries where PPF Telecom Group is active;         [5] EBITDA share for Serbia and Montenegro is
the source for market shares is Analysys Mason, August 2021; market shares are for 1Q2021                                                                     reported on a consolidated basis
[2] #1 position in mobile and fixed markets combined; #1 position in fixed market, #2 position in mobile market                                               [6] Fixed broadband
[3] Including M2M subscribers; O2 CR pre-paid subscribers reported using 13 months active criterion, O2 SR and Telenor 3 months active                                                                             4
[4] ARPU is calculated according to IAS 18; O2 CZ ARPU is calculated by PPF Telecom Group using publicly available data according to IFRS15
PPF Telecom Group 1H2021 results - 8 September 2021
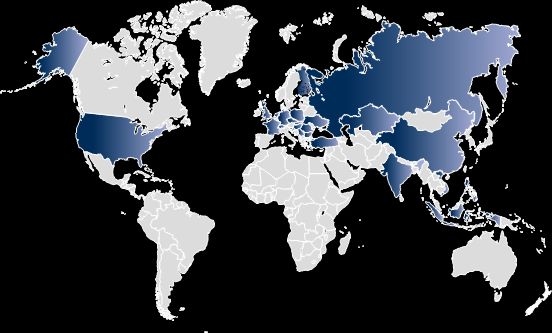
PPF track record in telecom and 2021 achievements
                                                                                                                                            Telenor CEE

        2012                    2013              2014                 2015                    2016                   2017                  2018                           2019

        PPF aiming to                       PPF completes the               Structural separation of O2      CETIN receives two ratings:       PPF Arena 1 signs        PPF Arena 1 receives
        establish 4th mobile                acquisition of 66%              infrastructure and               Baa2 by Moody’s                   Telenor CEE              BB+/Ba1/BBB- ratings
        operator in Czech                   in Telefonica O2 CR             establishment of CETIN           BBB by Fitch                      acquisition and          by S&P, Moody’s, Fitch
        Republic                            (incl. subsidiary in SK)                                                                           establishes
                                                                                                                                                                        EUR 550m 7yr + 500m 5yr
                                            from Spanish Telefonica                                          CETIN issues debut                a permanent
                                                                                                                                                                        Eurobonds
                                            (later raised to 84.06%)                                         dual-currency Eurobond            financing platform

                                                      lockdown #1 in Czechia                                                                                lockdown #2 in Czechia

 2020                                  Q1                                         Q2                                            Q3                                          Q4

                                       Name changed to        5G spectrum                                    Structural separation                         5G spectrum           5G spectrum
                                       PPF Telecom Group      acquired in Hungary                            of Telenor in Hungary,   CETIN’s                  acquired          acquired
                                                                                                             Bulgaria and Serbia      EUR 625m               in Czechia          in Slovakia
                                                              EUR 100m loan                                                           committed
                         EUR 100m 5yr tap
                                                              for HU spectrum              EUR 500m+100m                              credit facility,   EUR 500m
                                                                                           4yr Eurobond                               undrawn            7yr Eurobond

                                   lockdown #3 in Czechia

 2021                     Jan               Feb               Mar                   Apr                   May                Jun                   Jul              Aug                Sep

        CETIN                                         2100+2600 MHz              3700 MHz spectrum                             O2 Czechia        Telenor Montenegro               CETIN Czechia
        Group                                         spectrum                   auction in Bulgaria            stake increased to 90.5%,        sale LOI signed                  100% integrated
        formed                                        auction in Bulgaria                                 squeeze-out intention announced

900+1800 MHz spectrum            900+1800 MHz spectrum                                                                                               CETIN Group financing;
     renewal in Hungary          renewal in Bulgaria                                                                                        PPF Telecom Group loans repaid,
                                                                                                                                                 and bonds security released

  Source: Company data                                                                                                                                                                           5
PPF Telecom Group 1H2021 results - 8 September 2021
Key highlights of 1H2021 results
Catch-up in financial growth
   1         Stable markets and 5G rollout                                              2      Good financial performance
  •    New 5G spectrum acquired in Bulgaria                                             •   OpCos delivered EBITDA and cash flows despite lockdowns
                                                                                            from January to April
  •    5G frequencies now available in four countries and
       5G network rollout has started                                                   •   All countries positively contributed to EBITDA growth

 •     Stable markets and competitive                                                   •   Catch-up in EBITDA momentum in 1H
       landscape preserved                                                                  after growth deceleration in 2020
 •     Aftermath of Czech 5G auction still
                                                                  18.4m                 •   FX tailwind in Czech Republic and        +8.4%
       possible as three challengers                             mobile subscribers1
                                                                                            headwind in Hungary                          EBITDA
       became entitled to national roaming                          +2.2% yoy                                                             y-o-y
                                                                 contract subscribers

   3         Debt structure changes                                                     4      Corporate structure simplification
  •    PPF Telecom Group bank loans refinanced by new                                   •   Sustainable operating model with consolidated
       term and RCF facilities at CETIN Group level                                         infrastructure since CETIN Group established in Dec 2020

  •    Security removed from PPF Telecom Group bonds                                    •   100% ownership of Czech CETIN and O2 targeted

  •    Maturity of debt profile extended                                                •   Minority investor(s) for
                                                                                            CETIN Group
  •    Committed to the declared                                                            under consideration
       financial policy below 3.2x                                 Rating
                                                                 unchanged

Source: Company data                                                                                                                                6
[1] Including M2M subscribers; 16.0m excluding M2M subscribers
PPF Telecom Group 1H2021 results - 8 September 2021
Corporate structure changes
Ownership in CETIN Czechia consolidated and in O2 increased to 90.5%
                                      DECEMBER 2020                                                                                        SEPTEMBER 2021

                                                    PPF Group                 Free                                                                                          Free
         PPF Telecom Group                                                                                                     PPF Telecom Group
                                                     affiliates               float                                                                                         float

      CETIN Czechia                                                                                             CETIN Czechia
      Telco infrastructure
                                   89.73%               10.27%                                                      Telco infrastructure
                                                                                                                                                            100%

     •   10.27% acquired from other PPF Group entities                                                          •     Shares were contributed in kind
                                                                                                                      without consideration

      O2 CR                                                                                                     O2 CR
      Retail services
                                   67.83%               15.75%              16.42%                                  Retail services
                                                                                                                                                        90.52%          9.48%

     •   15.75% acquired from other PPF Group entities                                                          •     EUR 0.3bn incremental facility drawn in July
     •   6.94% acquired from the market in June-July                                                            •     EUR 0.4bn own cash
                                                                                                                •     Intention announced to initiate squeeze-out of the
                                                                                                                      residual free float as per the Czech corporate code
                                                                                                                      and to delist O2 from Prague Stock Exchange

                                                Although already fully consolidated in PPF Telecom Group accounts,
                                        pro-forma proportional 2020 EBITDA attributable to the acquired stakes corresponds to
                                                           c. EUR 150m (c. EUR 200m after squeeze-out)
Amounts in CZK converted to EUR with EUR/CZK 25.5 exchange rate
Source: PPF Telecom Group internal data, PPF Telecom Group 1H2021 unaudited consolidated financial statements                                                                   7
PPF Telecom Group 1H2021 results - 8 September 2021
Financing structure changes
New financing at CETIN Group level, within the existing financial policy
                     DECEMBER 2020                                                          SEPTEMBER 2021                                               COMMENTARY

in EURm                                                                    in EURm
PPF Telecom Group B.V.                4,200 +279m                          PPF Telecom Group B.V.                            4,479     As of 1 Sep 2021, PPF Telecom Group has
           Bond 2026                    550                                           Bond 2026                                550     repaid c. EUR 852m of bank loan, o/w c. eq.
           Bond 2025                    600                                           Bond 2025                                600     EUR 546m was the original loan balance and
           Bond 2024                    600                                           Bond 2024                                600     eq. EUR 306m was incremental facility drawn in
           Bond 2027                    500                                           Bond 2027                                500     Jul 2021 to finance O2 shares purchases.
           Term loan 2024               546                                                                                            PPF Telecom Group bonds became unsecured.
           Committed RCF 200m, undrawn
           Total                      2,796 -546m                                           Total                            2,250
       CETIN Group N.V.                                 816 +825m                  CETIN Group N.V.                   1,641            New financing has been drawn at CETIN Group
                                                                                         Corporate bridge loan 2023     750            N.V. level on 3 September 2021.
                                                                                         Term loan 2026                  75            Corporate bridge loan 2023 EUR 750m is to be
                                                                                         Committed RCF 200m, undrawn                   refinanced by debt capital market issuances.
                                                                                         Committed loan 625m, undrawn
                                                                                         Total                          825            CETIN CZ liquidity back-up facility cancelled
                CETIN CZ                     816                                            CETIN CZ                           816     and replaced with an undrawn term loan at
                Bond 2021                    625                                            Bond 2021                          625     CETIN Group level.
                Bond 2023                    191                                            Bond 2023                          191
                Committed loan 625m, undrawn
       O2 CZ                                            508                        O2 CZ                                       508
                Schuldscheins 2022-26                   297                                 Schuldscheins 2022-26              297
                Term loan 2025                          211                                 Term loan 2025                     211
       Telenor HU                                         80                       Telenor HU                                   80
             Amortising loan 2025                         80                             Amortising loan 2025                   80

                                                                                                           Companies below PPF Telecom Group subject to covenants, as
              Unchanged financial policy of PPF Telecom Group:                                             amended to capture also CETIN Group N.V. and PPF Telco B.V.
                                                                                                           interim holding entities in successful consent solicitation in July 2021:
                          Net leverage excl. IFRS 16 below 3.2x                                            • O2 CR Group + CETIN Group 2.2x,
                                                                                                           • Other parts of PPF Telecom Group 1.0x
Debt denominated in CZK converted to EUR with EUR/CZK 25.5 exchange rate
Source: PPF Telecom Group internal data, PPF Telecom Group 1H2021 unaudited consolidated financial statements                                                                          8
PPF Telecom Group 1H2021 results - 8 September 2021
Pending potential transactions

                          SALE OF TELENOR MONTENEGRO                                                                  CETIN GROUP STRATEGIC REVIEW

•    PPF Telecom Group has entered negotiations on possible sale                          •    Three possible scenarios:
     of Telenor Montenegro to 4IG, Hungarian company listed on                                 (i) status quo maintained
     Budapest Stock Exchange
                                                                                               (ii) equity offering and listing, or
•    A non-binding term sheet was signed on 9 July
                                                                                               (iii) direct sale of minority stake to financial investor
•    The divestment will be conducted subject to due diligence and
                                                                                          •    Selection will be based purely on overall favourability of the
     negotiation of the transaction documentation
                                                                                               conditions for PPF Telecom Group
                                          KEY FACTS                                                                                   KEY FACTS

•    Telenor Montenegro is the smallest business unit
                                                                                                                                   PPF Telecom Group
•    While reported in PPF Telecom Group sub-consolidated with
     Telenor Serbia, Montenegro contributed c. EUR 44m revenues                                          100%
     and EUR 16m EBITDA in 2020 respectively, c. 1.4% and                                                                                          100%
                                                                                                                                                                   PPF Telco
     1.1% group contribution respectively                                                              CETIN Group
•    Mobile network (including 200+ own sites and 400+
                                                                                                                                                     90%           O2 CZ + SK
     2G/3G/LTE BTSs) remained vertically integrated with retail                                                                                    (100% target)
     operations in Montenegro and is within the perimeter of                              100%           CETIN CZ
     potential transaction                                                                                                                         100%
                                                                                                                                                             PPF TMT Bidco 1
                Headquarters
                                                                                              75%        CETIN HU
                                                          LTE coverage
                  in Podgorica                 Outdoor: 98.2% population, 90% territory
                                                                                          100%           CETIN BG
                                                                                                                                                       75%         Telenor HU

                                                                                          100%           CETIN RS                                     100%         Telenor BG

                                                                                                strategic review target perimeter                     100%         Telenor RS
                                                                                                    Holding or financing company
                                                                                                    Operating company - wholesale infrastructure      100%         Telenor ME
                                                                                                    Operating company - services to end users

Source: PPF Telecom Group internal data                                                                                                                                         9
Corporate structure and debt as of September 2021
                                                                                                                                                                                                          1
A cluster of market-leading CEE telecom infrastructure and retail assets
                                                                             PPF Telecom Group B.V.
                                                                                                BB+/Ba1/BBB-
                                                                          • Bond EUR 600m, due 2024, 3.500% p.a.
                                                                          • Bond EUR 600m, due 2025, 2.125% p.a.                             of
                                                                          • Bond EUR 550m, due 2026, 3.125% p.a.                 50%         Group
                                                                                                                                             debt
                                                                          • Bond EUR 500m, due 2027, 3.250% p.a.
                                                                                                                                             net leverage                  pro-forma net leverage6
                                                                            Consolidated debt EUR 4.5bn                         2.55x        30 June 2021        2.87x     July 2021, post O2 shares + dividend

                                                                 of                                                                      of                                                                       of
         CETIN Group                                             Group
                                                                 EBITDA                                                        34%
                                                                                                                                         Group
                                                                                                                                         EBITDA
                                                                                                                                                               Telenor CEE                            27%         Group
                                                                                                                                                                                                                  EBITDA
                                                         39%
   • Bond EUR 625m, due 2021, 1.423% p.a.                       of          • Term loan EUR 211m, due 2025                               of
                                                                                                                                                     • 5Y Amortising term loan EUR 80m,                           of
     + undrawn EUR 625m loan, due 2026                          Group
                                                                debt
                                                                            • Schuldschein EUR 297m, due 2022/24/26            11%       Group
                                                                                                                                         debt         due 2025                                        2%          Group
                                                                                                                                                                                                                  debt
   • Bond EUR 191m, due 2023, 1.25% p.a.              36%
   • Bridge loan EUR 750m, due 2023
   • Term loan EUR 75m, due 2026                                             O2 Czech Republic             90.52%2                                    Telenor Hungary             75%4
                                                                             Mobile + Fixed services       squeeze-out underway                       Mobile services
    CETIN Czechia                  100%3
     Telco infrastructure                                                                                                                             Telenor Bulgaria            100%
     -/Baa2/BBB                                                                 O2 Slovakia                100%
                                                                                Mobile services            by O2 Czech Republic                       Mobile services
    CETIN Hungary                  75%4                                         and infrastructure
    Mobile infrastructure                                                                                                                             Telenor Serbia              100%
                                                                                                                                                      Mobile services
    CETIN Bulgaria                 100%
    Mobile infrastructure                                                                                                                             Telenor Montenegro          100%
                                                                                                                                                      Mobile services and infrastructure
    CETIN Serbia                   100%
    Mobile infrastructure

Source: Company data
[1] The chart represents the simplified group structure to illustrate main segments within PPF Telecom Group B.V. and financing as of 8 September 2021
[2] Squeeze-out of the remaining minority investors (9.48% free float at Prague Stock Exchange) expected in 4Q 2021
[3] Merger with PPF A3 B.V. resulted in 100% ownership as of 1 September 2021.
[4] 25% stake owned by Antenna Hungária Zrt., the country’s leading state-owned telecommunications service provider, via TMT Hungary B.V. holding company
[5] Consolidated net leverage ratio = consolidated Gross Debt less Cash / EBITDA for the last twelve months preceding 30 June 2021, excluding IFRS 16 impact
[6] Pro-forma net leverage is calculated using 30 June 2021 figures less cash disbursements for O2 shares acquisition EUR 349m and dividend payment EUR 90m in July 2021
                                                                                                                                                                                                              10
Diversification of PPF Telecom Group earnings
Regionally balanced portfolio with half of the business in Czechia
                     GEOGRAPHICAL DISTRIBUTION OF EBITDA                                                            DISTRIBUTION OF EBITDA BY COUNTRY AND BUSINESS

 in EURm                                  1H2021 Actual                          Sovereign ratings                                          1H2021 Actual
                                                                                 Moody’s / S&P / Fitch
                                                                                                                       Serbia + Montenegro Serbia infra
                                                                                 Czech Republic                              end users
                                                                                 Aa3/AA-/AA-                                                5%                     Czechia
                                          110
                                                                                                                        Bulgaria        9%                        end users
                                          14%                                    Slovakia                                                               26%
                                                                                 A2/A+/A+
                                                                                                                          infra
           Total                                          365                                                                        5%
                                103                       48%
        consolidated            14%                                              Hungary                               Bulgaria
                                                                                                                                   8%
          EBITDA                                                                 Baa3/BBB/BBB                         end users
         EUR 759m
                                                                                 Bulgaria                              Hungary      6%
                                    116                                          Baa2/BBB-/BBB
                                    15%                                                                                 infra                               22%
                                                67                                                                                        9%                      Czechia
                                                9%                               Serbia +
                                                                                                                               Hungary          9%                 infra
                                                                                 Montenegro
                                                                                 RS:Ba3/BB/BB+                                end users
                                                                                                                                             Slovakia
                                                                                 ME:B1/B+/-
                                                                                                                                            integrated
                             EBITDA BY TYPE OF BUSINESS                                                                      MOBILE SUBSCRIBERS1 BY SEGMENT

 in EURm                                  1H2021 Actual                                                  in 000’s                           1H2021 Actual
                                                                                                                                                                              Czech Republic

       Telenor CEE                                                      CETIN Group                                                         3,216
                                                                                                                                             17%         5,987                Slovakia
        mobile services              202                                  mobile + fixed
         to end users                                       297           infrastructure                                                                  33%
                                     27%                                                                       Total mobile
                                                            39%                                                                                                               Hungary
                                                                            wholesale                           subscribers         3,463
                                                                                                                  18.4m1             19%
                                                                                                                                                                              Bulgaria
                                        262                                   CETIN Group                                                                2,236
               O2                       34%                                   O2 Group                                                         3,487      12%
   mobile + fixed services                                                                                                                      19%                           Serbia +
       to end users                                                           Telenor CEE                                                                                     Montenegro

Source: PPF Telecom Group B.V. unaudited consolidated financial statements for 1H2021
[1] Including M2M subscribers; 16.0m excluding M2M subscribers
                                                                                                                                                                                           11
Spectrum auctions update
Successful spectrum acquisitions in 2020-21, further auctions anticipated
                                     2020                           2021                       2022                2023          2024
                          700 / 3,500 MHz auction              2,100 MHz renewal                                          900 / 1,800 MHz renewal
Czechia
                          EUR 53m cost          100% paid

                      700 / 900 / 1,800 MHz auction
Slovakia
                          EUR 33m cost          50% paid      25% paid                      25% to be paid

                     700 / 2,100 / 3,600 MHz auction         900 / 1,800 MHz renewal
Hungary
                          EUR 100m cost         100% paid        EUR 162m cost             100% to be paid

                                                             900 / 1,800 MHz renewal
                                                            EUR 23m cost 100% paid
                                                                                        700 / 800 MHz allocation
Bulgaria
                                                             2,100 and 2,600 auctions
                                                            EUR 3.3m cost 100% paid

                                                                3,700 MHz auction

                                                            EUR 2.1m cost 100% paid

Serbia                                                                                  700 / 2,600 / 3,600 MHz
                                                                                               allocation

Montenegro                                                      2,600 MHz auction           700 / 3,600 MHz
                                                                                              allocation

                                                                                                                                               12
Source: publicly available disclosures and company data
Current spectrum allocations
 new auctions      band size up to:    2 x 30 MHz     2 x 30 MHz   2 x 35 MHz     2 x 115 MHz    2 x 60 MHz     2 x 80 MHz      70 MHz    2 x 100 MHz         200 MHz    200 MHz
and extensions
                                                                                                                 FDD            TDD           FDD              TDD       TDD
                   410         450       700            800           900           1 800          2 100         2 600          2 600         3 500            3 500     3 700

                                                                                                                                         Vodafone              20 MHz    40 MHz     Vodafone
                                       2 x 10 MHz     2 x 10 MHz   2 x 10 MHz     2 x 27 MHz     2 x 19.8 MHz   2 x 20 MHz
                                                                                                                                               CentroNet       80 MHz
Czechia           3 MHz     Nordic                                                                                                                                       80 MHz     Nordic
                                       2 x 10 MHz     2 x 10 MHz   2 x 12.7 MHz   2 x 20 MHz     2 x 19.8 MHz   2 x 30 MHz      25 MHz   T-Mobile              20 MHz
                                                                                                                                                                         40 MHz     PODA
                                                                                                                                                               60 MHz
                     O2        4 MHz   2 x 10 MHz     2 x 10 MHz   2 x 12.4 MHz   2 x 27.8 MHz   2 x 19.8 MHz   2 x 20 MHz      25 MHz   O2                              40 MHz     O2
                                                                                                                                                               20 MHz

                          Orange       2 x 10 MHz     2 x 10 MHz   2 x 10 MHz     2 x 20 MHz     2 x 20 MHz     2 x 30 MHz                 2 x 35 MHz      Slovanet      80 MHz     regional
                                                                                  2 x 18 MHz
Slovakia                  T-Mobile                                 2 x 10.2 MHz
                                                                                                                                                               20 MHz    40 MHz     4ka
                                       2 x 10 MHz     2 x 10 MHz                                 2 x 20 MHz     2 x 40 MHz      50 MHz
                                                                                  2 x 18.2 MHz                                                                           40 MHz     Benestra
                          O2           2 x 10 MHz     2 x 10 MHz   2 x 14.8 MHz                  2 x 20 MHz
                                                                                  2 x 18.8 MHz                                             2 x 45 MHz          20 MHz    40 MHz     O2

                                                                    Jan-2021       Jan-2021

                                       2 x 10 MHz     2 x 10 MHz   2 x 10 MHz     2 x 20 MHz     2 x 20 MHz     2 x 20 MHz      25 MHz                         120 MHz   50 MHz
                          Vodafone
                                                                                  2 x 4.9 MHz
Hungary                                                            2 x 10 MHz
                                                                                                                                25 MHz                         60 MHz
                          T-Mobile     2 x 10 MHz     2 x 10 MHz                                 2 x 25 MHz     2 x 30 MHz                                               120 MHz
                                                                                  2 x 30 MHz                                                     DIGI          20 MHz
                          Telenor                     2 x 10 MHz   2 x 15 MHz                                   2 x 20 MHz                                               140 MHz
                                       2 x 5 MHz                                  2 x 20 MHz     2 x 15 MHz

                                                                    Jan-2021       Jan-2021       Jan-2021      Mar-2021                                                 Apr-2021
                                                                                  2 x 10 MHz
                                                                                   2 x 5 MHz                                 Bulsatcom                                   100 MHz
                                                        A1         2 x 11.2 MHz
Bulgaria                                                                          2 x 15 MHz
                                                                                                 2 x 20 MHz     2 x 20 MHz
                                                        Vivacom    2 x 11.2 MHz   2 x 15 MHz                                 T.com                                       100 MHz
                                                                                  2 x 15 MHz     2 x 20 MHz     2 x 20 MHz
                                                        Telenor    2 x 11.2 MHz                  2 x 20 MHz     2 x 20 MHz                                               100 MHz
                                                                                  2 x 15 MHz

                                                      2 x 10 MHz   2 x 11.2 MHz    2 x 5 MHz     2 x 15 MHz
                                         mt:s

Serbia                                   Vip mobile
                                                                   2 x 9.6 MHz    2 x 20 MHz     2 x 15 MHz
                                                      2 x 10 MHz
                                                                   2 x 4.2 MHz    2 x 30 MHz     2 x 15 MHz
                                         Telenor      2 x 10 MHz   2 x 9.6 MHz    2 x 20 MHz     2 x 15 MHz

                                                      2 x 10 MHz   2 x 10 MHz     2 x 25 MHz      2 x 5 MHz     2 x 40 MHz      45 MHz     2 x 75 MHz
                                         m:tel

Montenegro                               T-Mobile                  2 x 10 MHz     2 x 25 MHz
                                                                                                 2 x 15 MHz     2 x 20 MHz                 2 x 25 MHz

                                                      2 x 20 MHz                                 2 x 20 MHz     2 x 10 MHz       5 MHz
                                         Telenor                   2 x 15 MHz     2 x 25 MHz     2 x 20 MHz

                   410         450       700            800           900           1 800          2 100         2 600          2 600         3 500            3 500     3 700               13
                                                                                                                 FDD            TDD           FDD              TDD       TDD
Source: spectrummonitoring.com
COVID-19 dynamics

                      CUMULATIVE CASES PER MILLION PEOPLE                             FULLY VACCINATED POPULATION

•     A pronounced wave in 1Q has been arrested in 2Q             •     Most countries made a decisive progress in vaccination in 2Q
•     Bulgaria, Serbia and Montenegro are a concern again in 3Q   •     The curve is flattening in 3Q
                                                                  •     Another wave in the autumn cannot be excluded
                                                                  •     Bulgaria is a particular concern

                                                                  60%

Source: https://ourworldindata.org/covid-vaccinations
                                                                                                                                   14
Regional market overview
Market structure with three main MNOs preserved after the first wave of 5G auctions

                                                                         Czechia

                                                                         Slovakia

                             Telenor Hungary
                                                                         Hungary

                                                                         Bulgaria

                                    Telenor Serbia

                                                     Telenor Bulgaria     Serbia
                       Telenor Montenegro

                                                                        Montenegro

                                                                                      15
Commercial initiatives 1H2021
O2 Czech Republic and O2 Slovakia                                 Telenor Hungary, Bulgaria, Serbia and Montenegro
                         MOBILE AND FIXED                                                        MOBILE

•   Continuous growth in mobile in line with the                   •   Continuous focus on customer base
    market, growing data consumptions and roaming                      value growth driven by pre2post
                                                                       migration and data consumption driven
•   Successful bundling strategy in B2C reaching
                                                                       upsell
    over 40% penetration in Czechia
•   Digital only proposition Radost (Joy) of O2
                                                                   •   Harvesting successful launch of high ARPU unlimited plans in
                                                                       CEE
    Slovakia and best rated app on the market
                                                                   •   Bounce back of roaming revenues

                      TV AND OTHER SERVICES                                    COMPLEMENTARY EQUIPMENT AND SERVICES

•   Continuous IPTV growth crossing                                •   Focus on device insurance and bundling wearables on
    590k O2 TV users                                                   instalments

•   Fixed HW profitability growth     via
    smart pricing

•   New O2 Smart Box launched

                             NETWORK                                                             NETWORK

•   Continued 5G rollout in Czechia                                •   Maintaining strong network perception confirmed by reputable
                                                                       benchmarks across CEE
•   Network security service growing 30% in B2C and 100% in B2B
                                                                   •   5G launched in Bulgaria
                                                                       and Hungary

                                                                                                                                 16
Mobile revenue market shares
Telenor CEE and O2 maintain mobile revenue market shares
                               CZECHIA                                                                           SLOVAKIA                                                                         HUNGARY

  26%         27%       28%        28%          28%       28%                                                                                                           24%        24%         23%       23%           24%            24%
                                                                                       45%       41%      39%           39%          38%         37%

  37%         37%       36%        36%          36%       36%                                                                                                           49%        49%         49%       49%           47%            47%
                                                                                       32%       31%      32%           32%          31%         30%

  37%         36%       35%        35%          35%       35%                                    25%      26%           26%          27%         28%                                           28%       28%           28%            29% Telenor CEE
                                                                                       22%                                                                              27%        27%

 2016        2017       2018       2019         2020       1Q                          2016      2017     2018         2019          2020        1Q                     2016      2017         2018      2019         2020             1Q
                                                          2021                                                                                  2021                                                                                  2021
    O2 Czech Republic           T-Mobile               Vodafone                          O2 Slovakia      Telekom - T-Mobile         Orange           SWAN (4ka)          Telenor Hungary        Magyar Telekom - T-Mobile                 Vodafone

                           BULGARIA                                                                                SERBIA                                                                       MONTENEGRO

                                                                                       21%       22%      25%           27%          28%         29%                    22%        24%         27%       31%
  34%          35%       34%             33%      32%             31%                                                                                                                                                  33%            34%

                                                                                       39%       39%      37%           33%          31%                                32%        33%         33%
  25%          26%       27%             30%                      32%                                                                            30%                                                     32%           34%
                                                  31%                                                                                                                                                                                 36%

  38%          38%       38%                                                           40%       39%      39%           40%          41%         40%      Telenor CEE   46%        43%         40%       37%
                                         36%      34%             35%    Telenor CEE                                                                                                                                   33%            30%      Telenor CEE

  2016         2017      2018            2019     2020             1Q                  2016      2017     2018         2019          2020        1Q                     2016      2017         2018      2019         2020             1Q
                                                                  2021                                                                          2021                                                                                  2021
    Telenor Bulgaria           Vivacom                 A1 – Telekom Austria              Telenor Serbia       mts – Telekom Srbija            vip – Telekom Austria       Telenor Montenegro          T-Mobile               m:tel – Telekom Srbija

Source: Analysys Mason, August 2021
                                                                                                                                                                                                                                                      17
Mobile customer base
Continued growth in postpaid subscriber base
                          O2 CZECHIA                                                             O2 SLOVAKIA                                                     TELENOR HUNGARY

in millions            +1.3%                +2.5%                     in millions            +3.7%                +1.9%                      in millions            +2.4%               +2.2%
               YoY total incl. M2M        YoY contract                                YoY total incl. M2M       YoY contract                                 YoY total incl. M2M      YoY contract
       5.91       5.94       5.97         5.95      5.99 incl. M2M            2.16       2.19       2.23        2.22      2.24 incl. M2M            3.41       3.43       3.45        3.46      3.49 incl. M2M
       5.19       5.21       5.22         5.20      5.21 excl. M2M            1.77       1.77       1.78        1.76      1.77 excl. M2M            3.00       3.00       3.00        2.97      2.97 excl. M2M
       0.72       0.73       0.75         0.75      0.77                      0.39       0.42       0.46        0.46      0.47                       0.41       0.43        0.45      0.49      0.52

       1.93       1.93       1.91         1.87      1.87   M2M                                                                   M2M                1.00       0.98       0.97        0.95      0.93   M2M
                                                                              0.72       0.72       0.72        0.70      0.70                        67%                                        69%
        63%                                         64%
                                                           prepaid             59%                                        60%    prepaid                                                               prepaid

       3.26       3.28       3.32         3.33      3.34   contract                                                       1.07   contract           2.00       2.01       2.03        2.02      2.04   contract
                                                                              1.05       1.05       1.06        1.06

        2Q         3Q         4Q           1Q        2Q                        2Q         3Q         4Q          1Q        2Q                         2Q         3Q          4Q        1Q        2Q
       2020       2020       2020         2021      2021                      2020       2020       2020        2021      2021                       2020       2020        2020      2021      2021
13 months active criterion for pre-paid                                3 months active criterion for pre-paid                                3 months active criterion for pre-paid

                    TELENOR BULGARIA                                                         TELENOR SERBIA                                                   TELENOR MONTENEGRO

in millions            +0.0%                +0.7%                     in millions               +4.5%             +3.9%                      in millions            +2.2%               +3.4%
               YoY total incl. M2M        YoY contract                                YoY total incl. M2M       YoY contract                                YoY total incl. M2M       YoY contract
       3.46       3.50       3.47         3.45      3.46 incl. M2M                       2.87        2.88                 2.89
                                                                              2.76                              2.84                                0.32       0.34       0.33                  0.33
       2.94       2.97       2.94         2.92      2.93 excl. M2M                       2.77        2.78       2.74      2.78 incl. M2M                       0.34       0.33        0.32
                                                                              2.67                                                                  0.32                              0.32      0.32 incl. M2M
       0.53       0.53        0.53        0.53      0.54                       0.09       0.10          0.10    0.10      0.10 excl. M2M
                                                                                                                                                                                                     excl. M2M
       0.55       0.57       0.54         0.52      0.52                                                                  1.05
        81%                                         82%    M2M                1.00       1.07        1.06       1.02              M2M               0.15       0.17       0.16        0.15      0.16   M2M
                                                                               63%                                         62%
                                                           prepaid                                                                prepaid            51%                                        52%    prepaid
       2.39       2.40       2.40         2.40      2.41                                                                  1.73
                                                           contract           1.67       1.70        1.72       1.71              contract          0.16       0.16       0.16        0.16      0.17   contract

        2Q         3Q          4Q          1Q        2Q                        2Q         3Q          4Q         1Q        2Q                        2Q          3Q         4Q         1Q        2Q
       2020       2020        2020        2021      2021                      2020       2020        2020       2021      2021                      2020        2020       2020       2021      2021
3 months active criterion for pre-paid                                 3 months active criterion for pre-paid                                3 months active criterion for pre-paid

Source: Company data
                                                                                 %       share of post-paid customers, excluding M2M                                                                      18
Mobile ARPU in PPF Telecom Group business units
Generally stable blended ARPU across our footprint
                       O2 CZECH REPUBLIC1                                                          O2 SLOVAKIA                                                       TELENOR HUNGARY

                                 +8.2%       YoY estimate1 EUR                                          +6.9%           YoY blended EUR                                         +8.2%        YoY blended EUR
in EUR                                                                  in EUR                                                                   in EUR
                                 +2.7%       YoY    estimate1   CZK                                                                                                             +9.2%        YoY blended HUF

                                                                                            10.8        10.8           10.5      10.7                     22.5      22.8        22.4         22.4        23.3
                10.1      10.5     10.5       10.6          11.0                 10.0

                                                                                                                                                          11.7      12.2        12.1         12.1        12.7

                                                                                                                                                          3.3        3.8         3.7         3.4          3.7

                2Q        3Q        4Q         1Q           2Q                  2Q          3Q          4Q           1Q           2Q                     2Q          3Q          4Q          1Q           2Q
               2020      2020      2020       2021         2021                2020        2020        2020         2021         2021                   2020        2020        2020        2021         2021

                              revenue/subscribers                                                         blended                                          B2C voice contract            prepaid          blended
O2 Czech Republic is not reporting ARPU                                   O2 Slovakia is reporting only blended ARPU

                       TELENOR BULGARIA                                                       TELENOR SERBIA                                                      TELENOR MONTENEGRO
                                 +7.4%        YoY blended EUR                                           +6.7%            YoY blended EUR                                         +9.0%         YoY blended EUR
in EUR                                                                  in EUR                                                                   in EUR
                                 +7.4%        YoY blended BGN                                           +6.7%            YoY blended RSD                  13.8      13.7         13.6        13.6        14.2
                                 12.2        12.2          12.3               13.7        14.3         14.3         14.1         14.7
         11.6          11.9
                                                                                                                                                          8.6        9.1                                  9.4
                                                                                           9.4                                   9.7                                             8.6          8.7
         8.7           8.9        9.1         9.2           9.4               9.0                      9.3          9.2

                                                                                                                                                          4.2        4.6                                  4.6
                       3.4                                  3.4               3.0          3.2         3.0          2.9          3.2                                             3.8          3.8
         2.9                      3.2         3.1

       2Q               3Q        4Q          1Q            2Q                2Q           3Q           4Q          1Q           2Q                     2Q           3Q          4Q           1Q          2Q
      2020             2020      2020        2021          2021              2020         2020         2020        2021         2021                   2020         2020        2020         2021        2021

           B2C voice contract             prepaid           blended               B2C voice contract           prepaid           blended                   B2C voice contract            prepaid           blended

Source: O2 quarterly results, Telenor internal sources                           %     YoY growth in EUR                          %      YoY growth in local currency
[1] O2 Czech Republic stopped reporting ARPU from 2Q2019. To approximate this metric, revenue/user is calculated as mobile service revenue (excluding inbound roaming and M2M revenues) divided by the average   19
number of active mobile subscribers (excluding M2M). O2 Slovakia calculation of ARPU excludes inbound roaming and M2M revenues (undisclosed). Telenor calculation excludes inbound roaming and M2M revenues.
Fixed services in the Czech Republic
FTTc investments help CETIN’s active lines and O2’s FBB subscriber base
                      CETIN WHOLESALE FBB SUBSCRIPTIONS                                            O2 CR TECHNOLOGY-AGNOSTIC BROADBAND1 SUBSCRIBERS

in '000s                                  4.4%
                                                                                           in '000s                                   2.8%
                                           YoY                                                                                         YoY

             958              965          977           991      1,000                                 845             849             855            862               869

              2Q               3Q          4Q             1Q        2Q                                   2Q             3Q              4Q              1Q                2Q
             2020             2020        2020           2021      2021                                 2020           2020            2020            2021              2021

                                                                                           [1] O2 CR definition: Cable (ADSL, VDSL, fibre) and wireless (4G LTE, WTTx)
Source: CETIN internal data                                                                Source: O2 quarterly results

                      CETIN FIXED NETWORK MODERNISATION                                                                  O2 CR PAY TV SUBSCRIBERS2

•   Upgrading xDSL via FFTc/FTTb/FTTh, rolling out fibre, 2% of the lines 1Gbps
                                                                                           in '000s                                  20.2%
                                       +54 p.p.
                                                                                                                                      YoY

             30%                65%               84%           84%       50+ Mbps lines

            30%                 36%
                                                  64%           66%       100+ Mbps                                                                   563            572
                                                                                                        476            503            529
            38%                 29%

                                20%               20%           18%       50 Mbps
            32%                                    8%            8%       20 Mbps                       2Q              3Q             4Q             1Q              2Q
                                15%                8%            8%       ADSL                         2020            2020           2020           2021            2021
            2015                2018              2020           1H
                                                                2021                       [2] O2 CR definitions: IPTV and OTT, incl. prepaid O2 TV Sport Pack online and O2 TV HBO and
                                                                                           Sport Pack packages
Source: CETIN internal data                                                                                                                                                               20
                                                                                           Source: O2 quarterly results
1H2021 consolidated results at a glance
Sound results, all businesses contributed to earnings, solid cash flows
                  REVENUES OVERVIEW                                                                  REVENUES                                                                     EBITDA

EURm                          1H2020 1H2021 1H2021 FY2020
                                               yoy    yoy
Consolidated                                                              EURm                          Consolidated                                    EURm
                                1,545     1,613      4.4%      -0.4%
revenues1
                                                                                           1,545            +4.4%            1,613
O2 Group                          742        779     5.0%      -1.1%                                                                                                                  +8.4%              759
                                                                                                                                        International
                                                                                                                              101                                      700
CETIN CZ excl. transit            227        233     2.6%      -3.5%                        128                                         transit
                                                                                                                                                                                                         54        IFRS 16
                                                                                                                                                                        52                                         impact
Telenor + CETIN CEE2              666        697     3.9%       0.7%                                         YoY                                                                       YoY
  o/w Hungary                     250        262      4.8%     -3.3%
                                                                                          1,417                             1,512       Domestic
                                                                                                                                                                                                        705
  o/w Bulgaria                    190        206      8.4%      4.3%                                       +6.7%                        revenues                      648             +8.8%
  o/w Serbia + Montenegro         212        229      8.0%      2.5%
Eliminations                       -229      -206
Consolid. revenues                                                                        1H2020                            1H2021                                  1H2020                            1H2021
                                1,417     1,512      6.7%       0.4%
excl. transit

                     EBITDA OVERVIEW                                                                    CAPEX3                                                 FREE CASH FLOWS AFTER LEASES4

EURm                          1H2020 1H2021 1H2021 FY2020                 EURm                                                                          EURm
                                               yoy    yoy
                                                                                                                                                                    Free Cash Flows before spectrum CAPEX
EBITDA                            700        759     8.4%       2.0%                        252            -24%
                                                                                                                             192                                       384              -6%
                                                                                                                                                                                                         361
O2 Group                          242        262     8.3%       2.6%
CETIN CZ                          160        170     6.3%      -0.6%                        100                                                                        100                                37       Spectrum
                                                                                                             YoY              28        Spectrum                                        YoY                        impact
Telenor + CETIN CEE2              303        328     8.3%       1.4%

  o/w Hungary                     110        116      5.5%      3.4%                                                         164                                      284              +14%             324
                                                                                           152              +8%
  o/w Bulgaria                      96       103      7.3%     -1.7%

  o/w Serbia + Montenegro           97       109    12.4%       7.6%
                                                                                         1H2020                            1H2021                                   1H2020                            1H2021
EBITDA after leases               648        705     8.8%       2.1%

 Source: PPF Telecom Group consolidated financial statements for the period ended 31 December 2020 and 30 June 2021; Telenor CEE internal data
[1] Revenues + other income
[2] To facilitate sensible year-over-year comparison, 1H2021 figures of CETIN Hungary, CETIN Bulgaria and CETIN Serbia are pro forma combined with Telenor figures
[3] CAPEX represents additions to property, plant and equipment and intangible assets
                                                                                                                                                                                                                     21
[4] Free cash flows represent Net cash from operating activities less Cash used for Purchase of PPE and intangible assets and including Proceeds from disposals of PPE and intangible assets and including Lease payments
Key credit metrics
Maturity further extended through CETIN Group; net leverage preserved
               NOMINAL FINANCIAL DEBT1 PROFILE AS OF 8-SEP-2021                                                              CONSOLIDATED NET LEVERAGE RATIO5 AS OF 30-JUN-2021

    in EURm                                                                                                         in EURm
O2                  508m                                                                        297
                                                                                                7%
                                                                                                                              3.06x Gross leverage5                          2.87x pro-forma O2 + dividend
CETIN CZ            191m                           CETIN Group         O2 CR
CETIN Group       1,450m                                                                                                                              705                    2.55x Net leverage5
                                                                                        2,441     1,741
Telenor Hungary      80m                                                       36         54%     39%
PPF Telecom Group 2.250m
                                                                            PPF TG
FINANCIAL DEBT        4,479m                                                 550
                                    191                                      bond                                             4,227
          CETIN CZ                               228          PPF TG                                                                                  3,522                  3,522
                                                PPF TG         600
                                    750                        bond          625         PPF TG
        625          O2 CR                       600                                       500                                                                                                       1,382
       bond           33                         bond          211                         bond
                      20            20            20            20            75
        2021         2022          2023          2024          2025          2026          2027                         Financial debt2               Cash                 Net debt 3               EBITDA4
         Loan TNR HU         Loans O2       Loans CETIN Group          Bonds        Schuldscheins                                            Financial debt             Cash             EBITDA
•    EUR 625m CETIN Group N.V. liquidity back-up facility, obtained 24 Aug 2021, is undrawn and                 •     Pro-forma net leverage is calculated using 30 June 2021 figures less cash disbursements for O2
     committed for refinancing of CETIN CZ 1.423% EUR 625m Dec 2021 bond                                              shares acquisition EUR 349m and dividend payment EUR 90m in July 2021

                                               BONDS                                                                                             2021 LEVERAGE5 DYNAMICS

CETIN CZ - investment grade Baa2 / BBB (Moody’s / FitchRatings)                                                       3.2x                     financial policy threshold for net leverage excl. IFRS 16 impact
• Eurobond EUR 625m, 5 years, due Dec 2021, 1.423% p.a.                                                                          3.18x
                                                                                                                                                                               3.06x
  + undrawn EUR 625m facility, due 2026, committed for refinancing
                                                                                                                                                                                            2.87x     pro-forma
• Eurobond CZK 4,866m (EUR 191m), 7 years, due Dec 2023, 1.235% p.a.                                                                          2.59x                                                   O2 + dividend
                                                                                                                                                                                            2.55x
PPF Telecom Group - crossover rating BB+ / Ba1 / BBB- (S&P / M / F)
• Eurobond EUR 600m, 4 years, due May 2024, 3.500% p.a.
• Eurobond EUR 600m, 5 years, due Jan 2025, 2.125% p.a.
• Eurobond EUR 550m, 7 years, due Mar 2026, 3.125% p.a.
• Eurobond EUR 500m, 7 years, due Sep 2027, 3.250% p.a.                                                                               31 Dec 2020                                30 Jun 2021
                                                                                                                                          Gross leverage                 Net leverage
Source: O2 published results, PPF Telecom Group internal data, PPF Telecom Group consolidated financial statements for 2020 and 1H2021
[1] Outstanding principal amounts, excluding RCF and overdraft facilities; CZK-denominated debt converted with EUR/CZK rate of 25.49
[2] Financial debt = amount due to banks and debt securities issued, including amortised legal fees/bank fees and accrued interest, excluding IFRS 16 impact
[3] Net debt = Gross debt (excluding IFRS 16 impact) less Cash and cash equivalents and other highly liquid assets
[4] EBITDA for the last twelve months preceding 30 June 2021, excluding IFRS 16 impact
[5] Consolidated gross leverage ratio = consolidated Gross debt / EBITDA for the last twelve months preceding 30 June 2021, excluding IFRS 16 impact                                                               22
    Consolidated net leverage ratio = consolidated Gross debt less Cash and cash equivalents / EBITDA for the last twelve months preceding 30 June 2021, excluding IFRS 16 impact
Appendix

           23
Appendix - Key financial metrics
Sound 1H2021 results, all businesses contributed to group earnings
                                                               2020          1H         1H      1H2021                                                2020       1H     1H   1H2021
EURm                                    2019       2020                                                     EURm                        2019   2020
                                                                 yoy       2020       2021          yoy                                                yoy     2020   2021       yoy
Consolidated revenues                  3,170       3,159      -0.4%       1,545      1,613        4.4%      CAPEX (incl. spectrum)       392    612   56%       252    192     -24%
O2 Group                               1,534       1,517      -1.1%         742        779        5.0%      O2 Group                      95    228   141%      39     29        0%
CETIN Group excl. transit                471         615        31%         227        394         74%      CETIN Group                  161    197    22%      63    102       62%
 Czechia                                  471         455      -3.5%        227        233          2.6%         Czechia                 161    147   -8.8%      63     67     6.3%
 Hungary                                  n/a          64         n/a       n/a         63            n/a        Hungary                 n/a     23      n/a    n/a     14       n/a
 Bulgaria                                 n/a          48         n/a       n/a         49            n/a
                                                                                                                 Bulgaria                n/a     16      n/a    n/a     14       n/a
 Serbia                                   n/a          48         n/a       n/a         49            n/a
                                                                                                                 Serbia                  n/a     11      n/a    n/a      7       n/a
Telenor CEE                            1,341       1,351       0.7%         666        692         3.9%
                                                                                                            Telenor CEE                  136    188   39%      152     51      -66%
   Hungary                                527         510      -3.3%         250        262         4.8%
                                                                                                                 Hungary                  62    140   124%      122      8     -93%
   Bulgaria                               384         400       4.3%         190        205         7.9%
   Serbia + Montenegro                    430         441       2.5%         212        225         6.1%         Bulgaria                 28     19   -32%       13     33     154%
Eliminations                             -458        -428                   -218       -353                      Serbia + Montenegro      46     30   -35%       17     10     -41%
International transit revenues            282         259      -7.9%         128        101         -21%
Cons. revenues                                                                                              FCF after lease payments1    727    582   -20%     284    324      14%
                                       2,889       2,900       0.4%       1,417      1,512         6.7%
(excl. transit)

EBITDA                                 1,397       1,425       2.0%         700        759         8.4%
O2 Group                                 492         505       2.6%         242        262         8.3%
CETIN Group                              333         455        37%         160        297          86%
 Czechia                                  333         331      -0.6%        160        170          6.3%
 Hungary                                  n/a          48         n/a       n/a         49            n/a
 Bulgaria                                 n/a          38         n/a       n/a         39            n/a
 Serbia                                   n/a          38         n/a       n/a         39            n/a
Telenor CEE                              572         466       -19%         303        202         -33%
  Hungary                                 208         166       -20%        110          67         -39%
  Bulgaria                                180         140       -22%         96          64         -33%
  Serbia + Montenegro                     184         160       -13%         97          71         -27%
EBITDA after leases                    1,298       1,325       2.1%         648        705         8.8%

Source: PPF Telecom Group consolidated financial statements for 2020 and for the six months ended 30 June 2021
Figures are including the effects of IFRS 16 adoption, using the modified retrospective method
[1] Net cash flows from operating activities less CAPEX paid and proceeds from sale of assets                                                                                  24
Appendix - Group balance sheet highlights
No material changes in 1H2021; refinanced loans in Aug 2021
 in EURm                                                           31 Dec 2020 30 Jun 2021                      diff.

 Non-current assets                                                            6,413                  6,325    -1.4%

 •     o/w property, plant & equip. + intangible                               4,244                  4,152    -2.2%

 Current assets                                                                1,486                  1,559    +4.9%

 •     o/w cash & other highly liquid assets                                      790                    705   -11% cash held for O2 shares and 2020 dividend

 TOTAL ASSETS                                                                  7,899                  7,883    -0.2%

 EQUITY                                                                        1,836                  1,756    -4.4% +251m net profit 1H2021, -358m O2 shares

 Liabilities                                                                   6,063                  6,128    +1.1%

 •     o/w bonds                                                               3,085                  3,080    -0.2%

       o/w debt to banks                                                       1,132                  1,144    +1.3%

                                                                                                                                                                25
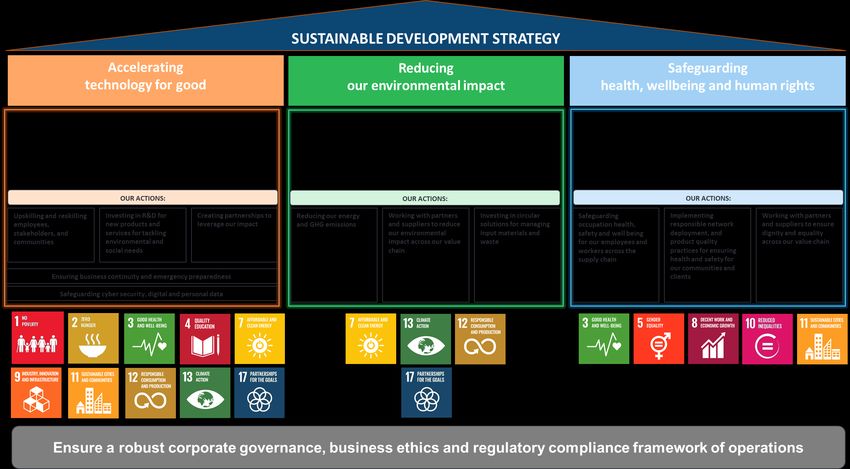
Source: PPF Telecom Group unaudited consolidated financial statements for the six months ended 30 June 2021
Group ESG strategy formulated
Implementation underway

Source: PPF Telecom Group internal data   26
PPF Group is an international investment group
founded in 1991 in the Czech Republic
        37,9 billion
        39.7  billionEUR
                      EUR                                  7,37.9
                                                                billion  EUREUR
                                                                      billion   0,6 billion
                                                                                    -291    EUR
                                                                                              million EUR                                                                                      22
                                                                                                                                                                                               94 ths.
         totalassets
        total  assets*
                     1                                     equity*
                                                                equity1                                 net income*
                                                                                                                 net income, in 2H EUR 93m positive                                            countries
                                                                                                                                                                                                employees1

   PPF GROUP OPERATES IN 25 COUNTRIES                                                                                                                EQUITY BY SEGMENT2

                                                                                                                                            Other
                                                                                                                                            18%
                                                                                                                                                                                          Financial
                                                                                                                           Engineering                                                    Services
                                                                                                                               3%                                                           36%

                                                                                                                            Real Estate
                                                                                                                               10%

                                                                                                                                        Media
                                                                                                                                        10%
Diverse business activities encompassing banking and financial services,                                                                                   Telecommunications
telecommunications, media, biotechnology, real estate and engineering                                                                                             23%

                                                                                                SHAREHOLDERS

                       Family of Petr Kellner                                                    Ladislav Bartoníček                                                    Jean-Pascal Duvieusart
                       Inheritance proceedings underway                                          CEO of PPF Telecom Group                                               CEO of Home Credit, Member of Board of
                                                                                                                                                                        Directors of PPF Real Estate
                       98.93 %                                                                   0.535 %                                                                0.535 %

[1] Assets as of 31 December 2020, equity attributable to owners of the parent as of 31 December 2020, net income attributable to owners of the parent for the period of 12 months up to 31 December 2020,
number of employees as of 31 December 2020
[2] Total equity as of 31 December 2020, excluding Unallocated segment and Eliminations
Source: PPF Group financial accounts for FY2020
                                                                                                                                                                                                             27
PPF Group key portfolio pillars
A long-term investor operating in 25 countries and ~11 sectors
                                                                                PPF GROUP (established 1991)

    TELECOMMUNICATIONS                                    FINANCIAL SERVICES                                    REAL ESTATE                                            MEDIA
                (since 2013)                                         (since 1997)                                    (since 1996)                                    (since 2020)

    PPF Telecom Group B.V.                              PPF Financial Holdings B.V.                         PPF Real Estate B.V.                                  TV Bidco B.V.

                Telenor CEE

•   Strategic pillar in PPF’s portfolio             •    Subject to European banking                 Platform for real estate projects               Central European Media Enterprises
•   Gradually built its position in the                  regulation (CRR/CRD IV)                     owned by PPF or in partnerships                 •   Market leading TV broadcasting
    CEE to become a relevant                        •    A treasury bank for PPF Group.              •   Cash flow generating projects,                  businesses in Czechia, Slovakia,
    regional player                                      Corporate and municipal clients,                mainly in office and industrial                 Romania, Slovenia and Bulgaria
•   Diversified across regions and                       with stable, profitable results.                sectors, limited exposure to                •   32 television channels
    products                                        •    Home Credit (est. 1997) growing                 residential sector                              broadcasting to approximately
•   Long-term PPF investment                             organically to 10 countries                 •   Efficient acquisitions, development             45 million people
    valuable for its low risk profile and           •    Diversified on multiple levels                  and operations                              •   Focused on exclusive own content
    stable cash flows                                    (geographies, product mix,                  •   Increased diversification across                production
                                                         development stage)                              regions and sectors

    EUR              EUR                EUR                    EUR                     EUR                     EUR                      EUR               EUR             EUR                 EUR
    7.9bn          1.4bn             1.8bn                  24.8bn                    2.9bn                  2.3bn                    0.9bn              2.1bn           0.2bn            0.8bn
    assets         EBITDA               equity                assets                   equity                 assets                   equity            assets          OIBDA                equity
          Data as of 31 December 2020                          Data as of 31 December 2020                     Data as of 31 December 2020                      Data as of 31 December 2020
Source: PPF Telecom Group 2020 financial accounts        Source: PPF Group 2020 financial accounts       Source: PPF Group 2020 financial accounts   Source: PPF Group and CME 2020 financial accounts

                                                                                                                                                                                                  28
PPF Telecom Group: Key credit highlights
            Market leading businesses with strong brand recognition, high quality assets and
   1        superior network coverage
                                                                                                                                                           Crossover rating from three agencies

  •     Stable market leading positions across six European markets
                                                                                                                                                       •     BB+, stable          Standard&Poor’s
  •     #1 to #2 positions in all major retail markets by both revenue and customer share
  •     Quality brand positioning in all markets
                                                                                                                                                       •     Ba1, stable          Moody’s
  •     High quality mobile networks with full coverage
  •     National fixed network infrastructure in the Czech Republic                                                                                    •     BBB-, stable FitchRatings

    2       Stable markets with positive long-term trends supporting growth

   •    Predictable regulatory environment in all markets
   •    Moderate intensity of the competition with stable market shares and ARPUs
   •    Growing demand for data across our footprint, further accelerated during COVID lockdows
   •    Track record of moderate growth in all markets

    3       Diversified, strong and stable cash flow generation                                                                                            Four Eurobond issues since 2019

   •    EBITDA generation well diversified across six countries and between infrastructure and retail
                                                                                                                                                       •     EUR 600m, 4Y due 2024, 3.500% p.a.
   •    Group cash conversion rate historically around 50%1
   •    Strong interest coverage ratios at consolidated and at PPF Telecom Group (stand-alone) level
                                                                                                                                                       •     EUR 600m, 5Y due 2025, 2.125% p.a.

    4       Efficient and innovative corporate structure                                                                                               •     EUR 550m, 7Y due 2026, 3.125% p.a.

   •    Sustainable model for the infrastructure separated from the commercial companies                                                               •     EUR 500m, 7Y due 2027, 3.250% p.a.
   •    Managerial specialisation, focus and priorities NetCo vs. ComCo
   •    Potential for infrastructure services wholesaling and network sharing
   •    Synergies in purchasing, research, infrastructure development and deployment

[1] Cash conversion = Free cash flow / EBITDA; based on unaudited pro forma condensed consolidated financial information for 2017-2018, Annual Reports 2019 and 2020, and financial accounts for 1H2021
                                                                                                                                                                                                          29
www.ppftelecom.eu

        THANK YOU FOR YOUR ATTENTION

                    Q&A
                                       30
You can also read