PRESCRIPTION DRUGS U.S. Prices for Selected Brand Drugs Were Higher on Average than Prices in Australia, Canada, and France - GAO
←
→
Page content transcription
If your browser does not render page correctly, please read the page content below
United States Government Accountability Office
             Report to the Chairman, Committee on
             the Budget, U.S. Senate

March 2021
             PRESCRIPTION
             DRUGS

             U.S. Prices for
             Selected Brand Drugs
             Were Higher on
             Average than Prices
             in Australia, Canada,
             and France
             Accessible Version

GAO-21-282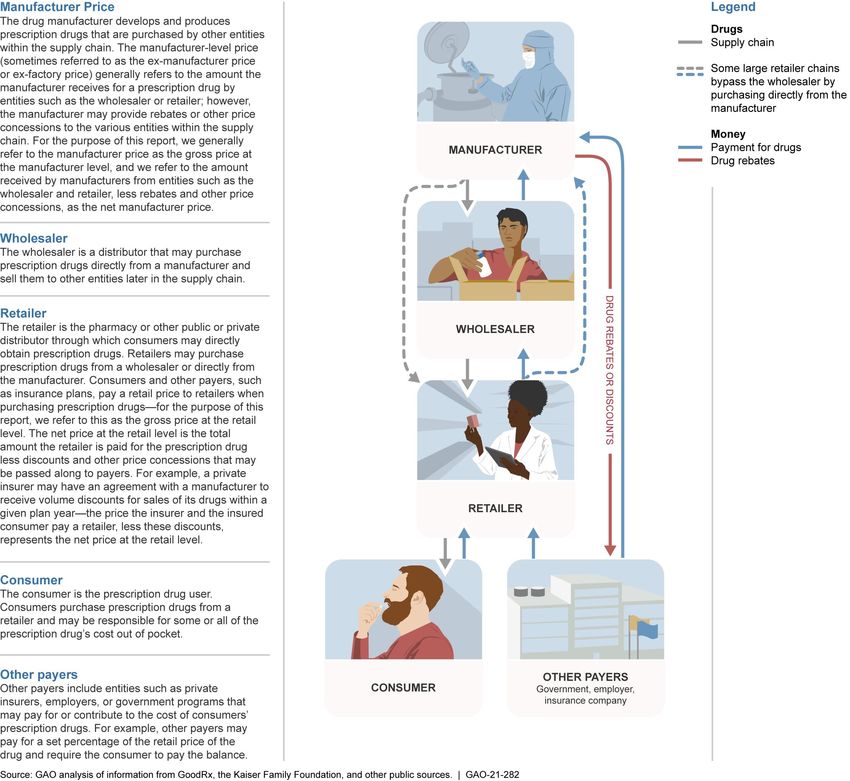
Contents
Letter                                                                                                                     1
                                   Background                                                                              7
                                   U.S. Net Prices for Selected Drugs Were, on Average, More than
                                     Two to Four Times Higher than Publicly Available Prices in
                                     Australia, Canada (Ontario), and France                                             18
                                   Consumers’ Out-of-Pocket Prescription Drug Costs Vary within
                                     and across Countries, but Likely Vary More within the United
                                     States and Canada                                                                   26
                                                 Variation in Consumer Costs ............................................ 29
                                                 Variation in Consumer Costs ............................................ 29
                                                 Variation in Consumer Costs ............................................ 30
                                                 Variation in Consumer Costs ............................................ 30
                                   Agency Comments and Our Evaluation                                                    38
Appendix I: Methods Used to Select Drug Sample, Conduct International Price Comparisons, and Estimate
U.S. Prices                                                                                                              40
Appendix II: Additional Details on Wholesale Acquisition Cost (WAC)                                                       48
Appendix III: Prescription Drug Pricing Strategies in Selected Countries                                                  50
                                    Prescription Drug Pricing Strategies in The United States                             52
                                    Prescription Drug Pricing Strategies in Australia                                     57
                                    Prescription Drug Pricing Strategies in Canada                                        63
                                    Prescription Drug Pricing Strategies in France                                        69
Appendix IV: Data on Prescription Drug Prices in the United States and Selected Comparison Countries                      74
Appendix V: Data on Consumer Out-of-Pocket Costs in the United States and Selected Comparison Countries
                                                                                                     79
Appendix VI: GAO Contacts and Staff Acknowledgments                                                                       82

Tables
                                         Data table for Figure 1: Selected Countries and Relevant
                                                 Economic Data, 2018 or Most Recent Year                                  10
                                         Data table for Figure 2: Pharmaceutical Industry Research and
                                                 Development Expenditure as a Share of Gross Domestic
                                                 Product (GDP), 2017 or Most Recent Year Available                        11

                                         Page i                                 GAO-21-282 International Drug Price Comparison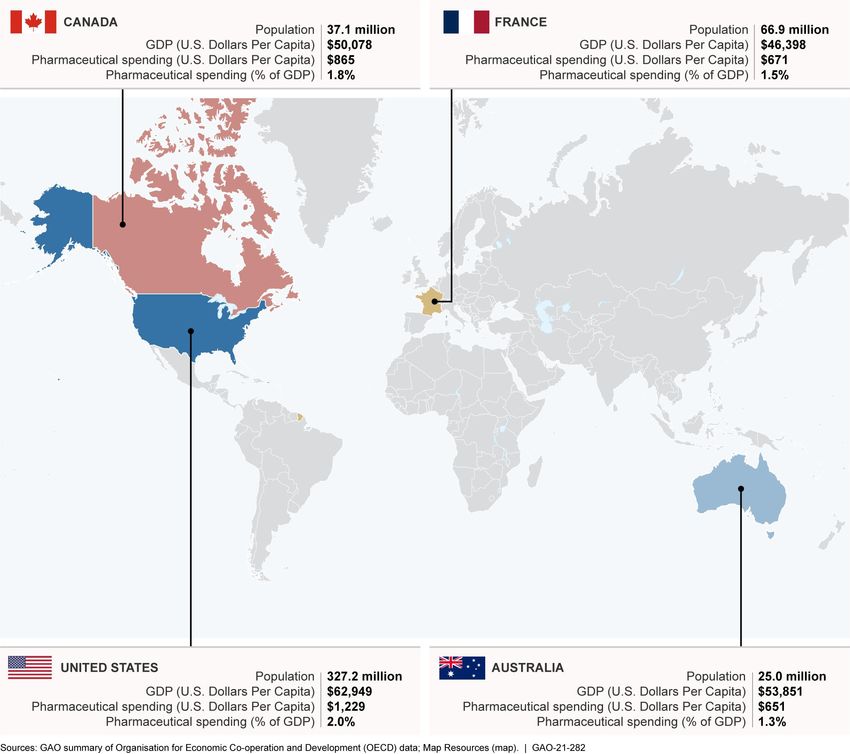
Table 1: Summary of Prescription Drug Coverage in the United
         States, Australia, Canada, and France                                        13
Table 2: Summary of Prescription Drug Pricing Strategies in the
         United States, Australia, Canada, and France                                 14
Text of Figure 3: Summary of Prescription Drug Supply Chain and
         Relevant Price Points                                                        17
3: Ratios of Estimated U.S. Net Prices to Selected Comparison
         Countries’ Gross Prices at the Retail Level, for Selected
         Drugs, in 2020                                                               20
Data table for Figure 4: Estimated U.S. Prices Compared to
         Selected Comparison Countries’ Prices at the Retail Level
         for Two Selected Drugs and Package Sizes, 2020                               23
Table 4: Ratios of Estimated U.S. Net Prices to Selected
         Comparison Countries’ Gross Prices at the Manufacturer
         Level, in 2020                                                               24
Data table for Figure 5: Estimated U.S. Prices Compared to
         Selected Comparison Countries’ Prices at the
         Manufacturer Level for Two Selected Drugs and Package
         Sizes, 2020                                                                  26
Text of Figure 6. Information on Consumer Out-of-Pocket Drug
         Costs in the United States and Selected Comparison
         Countries                                                                    29
              Variation in Consumer Costs ............................................ 29
              Variation in Consumer Costs ............................................ 29
              Variation in Consumer Costs ............................................ 30
              Variation in Consumer Costs ............................................ 30
Data table for Figure 7: Illustrative Example of Consumers Out-of-
         Pocket Costs in the United States for Anoro Ellipta (30
         inhalations), 2020                                                           33
Data table for Figure 8: Illustrative Examples of Consumers Out-
         of-Pocket Costs for Two Selected Drugs and Package
         Sizes in the United States and Selected Comparison
         Countries, 2020                                                              37
Table 5. Availability of Prescription Drugs Included in Selected
         Comparison Countries, in January 2020                                        41
Table 6: Summary of Key Points about Prescription Drug
         Coverage and Pricing Strategies in the United States,
         Australia, Canada, and France                                                51
Table 7. Estimated U.S. Net and Selected Comparison Countries’
         Gross Prices Paid at the Retail Level for Selected Drugs
         and Package Sizes, 2020                                                      74

Page ii                                   GAO-21-282 International Drug Price Comparison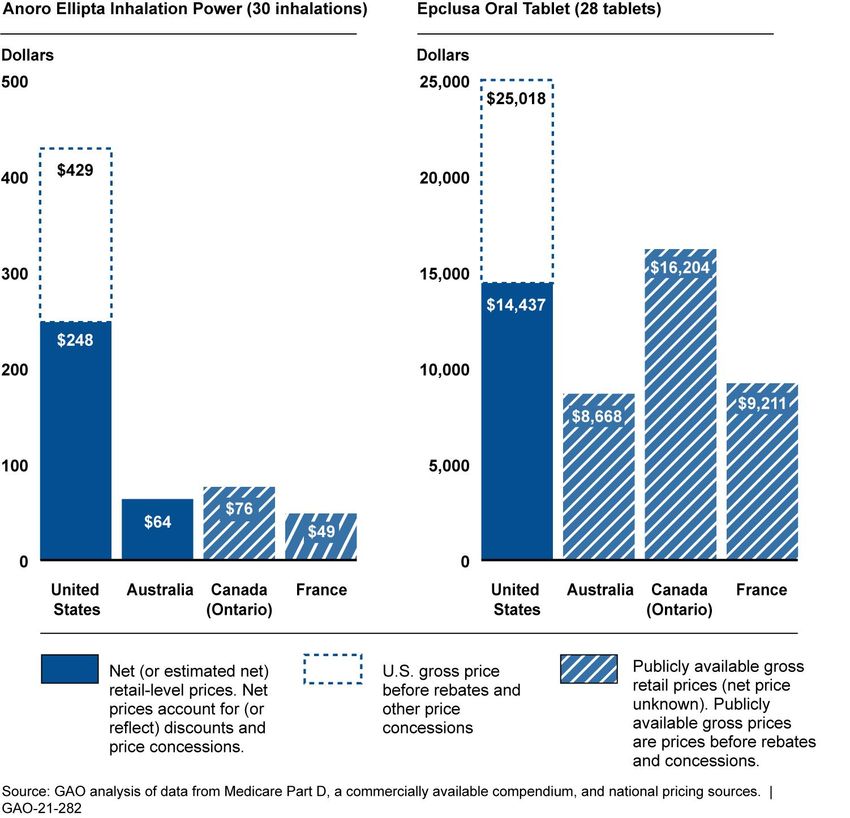
Table 8. Estimated U.S. Net and Selected Comparison Countries’
                  Gross Prices Paid at the Manufacturer Level for Selected
                  Drugs and Package Sizes, 2020                                                 76
          Table 9: Estimates of Consumers’ Varying Out-of-Pocket Costs in
                  the United States for Selected Brand-Name, Single-
                  Source Prescription Drugs and Package Sizes, 2020                             79
          Table 10: Estimates of Consumers’ Out-of-Pocket Costs in the
                  United States and Selected Comparison Countries for
                  Selected Brand-Name, Single-Source Prescription Drugs
                  and Package Sizes, 2020                                                       81
Figures
          Figure 1: Selected Countries and Relevant Economic Data, 2018
                   or Most Recent Year                                                             9
          Figure 2: Pharmaceutical Industry Research and Development
                   Expenditure as a Share of Gross Domestic Product
                   (GDP), 2017 or Most Recent Year Available                                     11
          Figure 3: Summary of Prescription Drug Supply Chain and
                   Relevant Price Points                                                         16
          Figure 4: Estimated U.S. Prices Compared to Selected
                   Comparison Countries’ Prices at the Retail Level for Two
                   Selected Drugs and Package Sizes, 2020                                        22
          Figure 5: Estimated U.S. Prices Compared to Selected
                   Comparison Countries’ Prices at the Manufacturer Level
                   for Two Selected Drugs and Package Sizes, 2020                                25
          Figure 6. Information on Consumer Out-of-Pocket Drug Costs in
                   the United States and Selected Comparison Countries                           28
                         Variation in Consumer Costs ............................................ 29
                         Variation in Consumer Costs ............................................ 29
                         Variation in Consumer Costs ............................................ 30
                         Variation in Consumer Costs ............................................ 30
          Figure 7: Illustrative Example of Consumers Out-of-Pocket Costs
                   in the United States for Anoro Ellipta (30 inhalations),
                   2020                                                                          33
          Figure 8: Illustrative Examples of Consumers Out-of-Pocket Costs
                   for Two Selected Drugs and Package Sizes in the United
                   States and Selected Comparison Countries, 2020                                36

          Abbreviations
          AUD          Australian Dollar
          CAD          Canadian Dollar
          DOD          Department of Defense

          Page iii                                  GAO-21-282 International Drug Price Comparison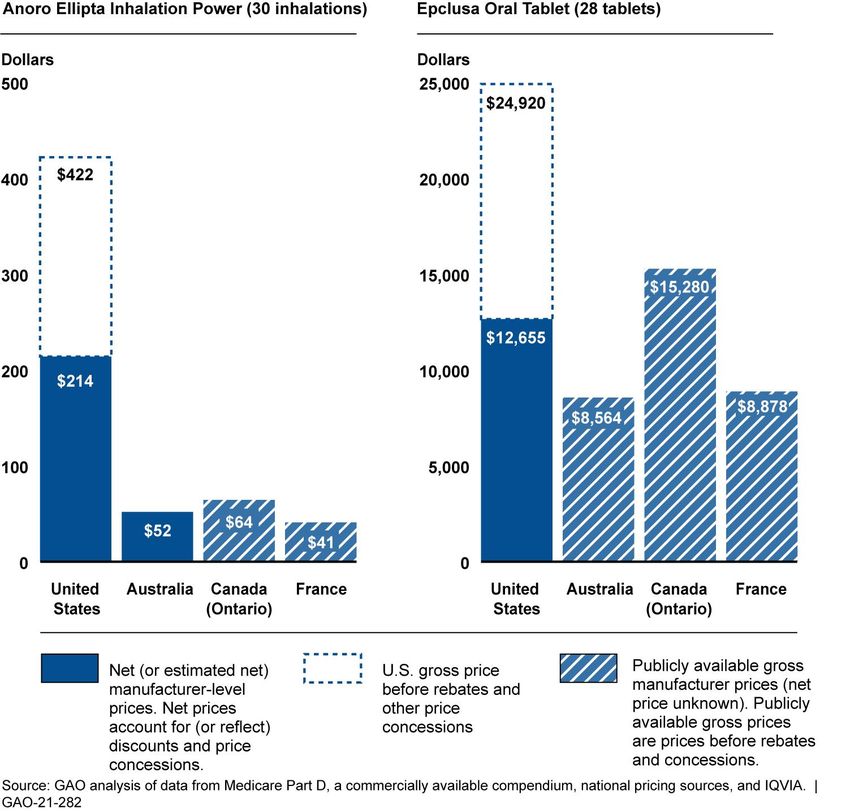
EUR               Euro
GDP               gross domestic product
IQVIA             IQVIA Institute for Human Data Science
OECD              Organisation for Economic Co-operation and Development
OPM               Office of Personnel Management
PBAC              Pharmaceutical Benefits Advisory Committee
PBS               Pharmaceutical Benefits Scheme
USD               U.S. Dollar
VA                Department of Veterans Affairs
VHA               Veterans Health Administration
WAC               wholesale acquisition cost

This is a work of the U.S. government and is not subject to copyright protection in the
United States. The published product may be reproduced and distributed in its entirety
without further permission from GAO. However, because this work may contain
copyrighted images or other material, permission from the copyright holder may be
necessary if you wish to reproduce this material separately.

Page iv                                    GAO-21-282 International Drug Price Comparison
441 G St. N.W.
Washington, DC 20548

                       Letter
                       March 29, 2021

                       The Honorable Bernard Sanders
                       Chairman
                       Committee on the Budget
                       United States Senate

                       Dear Mr. Sanders:

                       Spending on prescription drugs continues to grow in the United States
                       and throughout the world. One research study found that global net
                       spending on prescription drugs grew from 628 billion U.S. Dollars (USD)
                       in 2009 to USD 955 billion in 2019 (a 4.3 percent average annual
                       increase) and is projected to exceed USD 1.1 trillion by 2024.1 New and
                       expensive specialty drugs, an aging population, and increased drug use
                       due to improved management of chronic conditions all contribute to the
                       increased spending on prescription drugs. Although spending is
                       increasing worldwide, the United States spends more on prescription
                       drugs both as a share of its economy and per person than most of the
                       other Organisation for Economic Co-operation and Development (OECD)
                       countries.2

                       1Data    are reported in constant USD.

                       See IQVIA Institute for Human Data Science, Global Medicine Spending and Usage
                       Trends: Outlook to 2024 (Parsippany, New Jersey: 2020). The IQVIA Institute for Human
                       Data Science (IQVIA) conducts research and analysis and provides scientific expertise in
                       human health. IQVIA collects and maintains a variety of data assets (including information
                       on prescription drugs), often referenced by researchers.
                       2Among    the 34 OECD countries reporting drug expenditures, the United States ranks third
                       overall in pharmaceutical spending as a percentage of gross domestic product (GDP) and
                       first overall with respect to USD per capita. Pharmaceutical spending as a percent of GDP
                       was highest in Greece and Japan at 2.02 percent (2018) and 1.97 percent (2017),
                       respectively. The median among the 34 OECD countries with data was 1.35 percent for
                       the most recent available year. United States pharmaceutical spending was 1.95 percent
                       of GDP and approximately USD 1,229 per capita in 2018. The second highest spending
                       per capita was Switzerland at about USD 894, and the 34 OECD countries with data had a
                       median of about USD 542 for the most recent available year.

                       The 37 OECD member countries are Australia, Austria, Belgium, Canada, Chile,
                       Colombia, Czech Republic, Denmark, Estonia, Finland, France, Germany, Greece,
                       Hungary, Iceland, Ireland, Israel, Italy, Japan, Korea, Latvia, Lithuania, Luxembourg,
                       Mexico, Netherlands, New Zealand, Norway, Poland, Portugal, Slovak Republic, Slovenia,
                       Spain, Sweden, Switzerland, Turkey, the United Kingdom, and the United States.

                       Page 1                                    GAO-21-282 International Drug Price Comparison
Comparing prescription drug prices across different countries presents a
number of challenges. Some countries have universal prescription drug
coverage that relies on varying centralized price negotiation strategies
with manufacturers resulting in clearly defined prices for each drug.
Conversely, the United States primarily has a decentralized system
resulting in multiple prices among different payers for each drug.
Negotiations over prices may occur at various points within the drug
supply chain as drugs move from the manufacturer, through wholesalers,
to pharmacies, and ultimately to consumers and the prices paid at each of
these levels can vary from country to country.3 Further, it is difficult to
know the actual prices paid within each country’s supply chain because of
a lack of transparency in some aspects of pricing. For example, the prices
paid to manufacturers are often subject to confidential rebates and other
price concessions, which obscure the final net cost paid by various
payers for each drug. Although many countries make publicly available
the prices the government pays manufacturers for prescription drugs on
their national formularies, information on rebates and other price
concessions affecting these prices are generally not publicly available.

You asked us to review how U.S. prices for drugs compared to prices for
the same drugs in other countries. This report

(1) examines how prices at the retail and manufacturer levels for selected
brand-name prescription drugs in the United States compare to prices in
other countries, and

(2) provides information on consumers’ out-of-pocket costs for
prescription drugs in the United States and other countries.

To examine how brand-name prescription drug prices at the retail and
manufacturer levels in the United States compare to publicly available
retail and manufacturer level prices in other countries, we compared
estimated 2020 net prices in the United States to publicly available 2020
prices in three countries with similar income levels to the United States:

3Inaddition, the supply chain and entities involved in distributing and paying for drugs can
vary by country. For example, in the United States, the supply chain can include different
types of entities, in addition to wholesalers and pharmacies, and often includes pharmacy
benefit managers. Pharmacy benefit managers are organizations that help manage drug
benefits.

Page 2                                     GAO-21-282 International Drug Price Comparison
Australia, Canada (Ontario), and France.4 To conduct this analysis we
                                                        used a variety of data sources and methods, as summarized below and
                                                        described in more detail in appendix I.

While our work for this report was limited to           ·     We obtained and analyzed prescription drug pricing data for a non-
single-source, brand-name prescription drugs,                 generalizable sample of 41 brand-name, single-source prescription
these drugs do not represent other types of                   drugs that were among those with the highest expenditures and use in
drugs, such as generics. Studies have found
that use of generic drugs is more prevalent in                the U.S. Medicare Part D program in 2017.5 Twenty of the 41 drugs
the United States than in other countries, and                had publicly available prices on each of the selected country’s
the prices for generic drugs in the United
States are often lower than prices for these                  formularies. We defined a prescription drug as single-source if the
drugs in other countries.                                     drug had no generic or biosimilar alternative as of January 2020.
Source: GAO, the Milbank Quarterly, and Food and Drug
Administration. | GAO-21-282                            ·     To estimate net prices paid at the retail and manufacturer levels in the
                                                              United States, we analyzed data from various sources, including
                                                              estimates of Medicare Part D rebates and other price concessions
                                                              and data from a commercially available compendium, among others.
                                                              ·   To estimate the net prices paid at the retail level (the final amount
                                                                  paid to a retailer by all payers, such as a consumer and their
                                                                  insurer, less rebates and other price concessions the payers
                                                                  receive from any source), we estimated the average price a
                                                                  Medicare Part D plan might pay at the retail level after any rebates
                                                                  or price concessions have been applied.6 To calculate this
                                                                  estimated net price, we subtracted Medicare Part D confidential

                                                        4We  selected the comparison countries based on the following characteristics: OECD
                                                        status, GDP per capita, geography, population size, health care system (pharmaceutical
                                                        coverage and pricing), and the availability of publicly reported prescription drug pricing
                                                        data. Because prescription drug coverage in Canada is decentralized, we used Ontario
                                                        (Canada’s most populated province) as a proxy for Canada when examining prescription
                                                        drug pricing in that country. Throughout this report, references to drug prices in Canada
                                                        are based on prices in Ontario.
                                                        5Medicare  is the federally financed health insurance program for persons aged 65 and
                                                        over, certain individuals with disabilities, and individuals with end-stage renal disease.
                                                        Medicare Part D is the voluntary program that provides outpatient prescription drug
                                                        coverage for Medicare beneficiaries who enroll in Part D drug plans. When we started
                                                        selecting our non-generalizable sample of 41 prescription drugs, the most recent Medicare
                                                        Part D cost and usage full-year data was from 2017.

                                                        Physician-administered drugs are outside the scope of this work.
                                                        6Research   suggests that the range of net prices paid at the retail level in the United States
                                                        might vary widely depending on the payer, and that net prices under Medicare Part D
                                                        generally might fall in the middle of that range. For example, on average, rebates and
                                                        other price concessions for Medicaid may be larger than those for Medicare Part D plans
                                                        and might be smaller for private plans.

                                                        Page 3                                       GAO-21-282 International Drug Price Comparison
rebate and price concession data from the estimated gross prices
Medicare Part D plan sponsors paid to retailers.7
· To estimate net prices paid at the manufacturer level in the United
States (the final amount a manufacturer receives from all payers,
such as wholesalers or retail chains, less any rebates and other
price concessions the manufacturer provides to those payers), we
used prescription drug wholesale acquisition cost (WAC) data—a
price point commonly used by researchers as a proxy for U.S.
manufacturer-level prices.8 In conducting this work, we determined
that, in many cases, WAC was not markedly different from U.S.
retail-level prices, so we adjusted these data to account for the
estimated amount of the rebates and price concessions offered at
the manufacturer level.9 (See appendix II for more information on
how we determined that WAC was not markedly different from
U.S. retail-level prices.) We estimated these rebate and price
concession amounts based on the Medicare Part D confidential
rebate and price concession data we obtained, along with
estimated additional price concession amounts reported by the
IQVIA Institute for Human Data Science (IQVIA).10 The
confidential rebate and other price concession data used in our
7Medicare beneficiaries can obtain coverage for outpatient prescription drugs by choosing
from multiple competing plans offered by plan sponsors that contract with the Centers for
Medicare & Medicaid Services to offer the prescription drug benefit. Plan sponsors are
responsible for paying retail pharmacies for drugs dispensed to Medicare Part D
beneficiaries, and beneficiaries may be responsible for applicable cost-sharing. Drug
plans may differ in the premiums charged to the Centers for Medicare & Medicaid
Services and beneficiaries; beneficiary deductibles and copayments (i.e., beneficiary-paid
amounts); the drugs covered; pharmacies available to beneficiaries for filling prescriptions;
and the drug prices, rebates, and other price concessions negotiated with manufacturers
and pharmacies.
When we calculated price estimates, 2018 Medicare Part D payment data were the most
recent full-year data available. We projected the gross prices forward to 2020. See
appendix I for a detailed description of this methodology.
8The manufacturer-level price is often referred to as the ex-factory price, ex-manufacturer
price, or WAC. We obtained 2020 WAC from a commercially available compendium, Red
Book. Because manufacturer-level data are not publicly available in the United States,
WAC is commonly used by researchers as a proxy to represent manufacturer prices paid
by wholesalers, before discounts and rebates.
9WAC is a list price set by manufacturers that does not reflect actual transactions with
wholesalers and is generally considered to overstate actual prices paid to manufacturers
by wholesalers.
10SeeIQVIA Institute for Human Data Science, Medicine Use and Spending in the U.S.: A
Review of 2018 and Outlook to 2023 (Parsippany, New Jersey: 2019).
Page 4 GAO-21-282 International Drug Price Comparisonestimates reflect price concessions (such as those made by
manufacturers, pharmacies, or other sources), which decrease the
cost of the drug for Part D plan sponsors. However, these data do
not necessarily reflect rebates and other price concessions that
may be received by other government programs or by other
prescription drug payers in the United States.11
· We obtained January 2020 retail- and manufacturer-level data for the
selected comparison countries from national pricing sources that the
countries make publicly available.12 We did not discount these publicly
available retail and manufacturer prices for the comparison countries,
as estimates of rebates and other price concessions are
confidential.13 As a result, the publicly available prices for the other
countries generally represent gross prices, rather than net prices that
reflect rebates and other price concessions. We converted all foreign
prices to USD using the January 2020 United States Federal Reserve
average monthly foreign exchange rates.14
11In 2018, Medicare Part D accounted for approximately USD 107 billion in retail
prescription drug sales—nearly one-third of total U.S. expenditures. Other studies,
including a prior GAO report, found that, on average, rebates by other public or private
payers in the United States were higher or lower than Medicare Part D. For example,
Medicaid (which accounted for about USD 33 billion in retail prescription drug sales in
2018) had average rebates representing a larger share of gross prices as a result of
statutorily defined rebate requirements. In contrast, private insurers (which accounted for
USD 134 billion in retail prescription drug sales) had rebates averaging a smaller share of
gross prices than Medicare Part D. See GAO, Prescription Drugs: Comparison of DOD,
Medicaid, and Medicare Part D Retail Reimbursement Prices, GAO-14-578 (Washington,
D.C.: June 30, 2014). See appendix I for more information.
12Data were obtained from the following formularies: Australia’s Pharmaceutical Benefits
Scheme (PBS); the Database for Medication and Pricing Information, maintained by
France’s national health insurance program; and the Ontario Ministry of Health’s Drug
Benefit Program Formulary or the Ontario Exceptional Access Program.
13Based on information from national pricing sources, the publicly available pricing data
used in our review for selected comparison countries—Australia, Canada (Ontario), and
France—represent the gross price paid before confidential discounts and rebates.
However, according to Australian officials and based on our review of Australia’s
formulary, some drugs are not subject to confidential discounts and rebates, so the
publicly available price is both the gross and net price for those drugs. In our review, 32 of
our 41 selected drugs were listed on Australia’s formulary in 2020; among these 32 drugs,
14 were not subject to confidential discounts and rebates.
14January 2020 average monthly rates were accessed from the Federal Reserve on July
7, 2020, at https://www.federalreserve.gov/releases/g5/20200203/; USD 1.00 was equal to
1.3089 Canadian Dollar (CAD), Euro (EUR) 1.00 was equal to USD 1.1098, and
Australian Dollar (AUD) 1.00 was equal to USD 0.6851.
Page 5 GAO-21-282 International Drug Price ComparisonTo provide information on consumers’ out-of-pocket costs for prescription drugs in the United States and selected comparison countries, we compared publicly available 2020 data and other information on what consumers pay out-of-pocket for prescription drugs in general (including a detailed look at five drugs within our sample) for all four countries in our analysis. Specifically, to determine the amount insured and uninsured (or cash-paying) consumers may pay out-of-pocket for prescription drugs in the United States, we obtained and reviewed data from the Centers for Medicare & Medicaid Services, which administers the Medicare Part D program; reviewed published literature on consumer cost-sharing for prescription drugs for other public and private options; obtained and reviewed data from a nationally recognized prescription drug discount service in the United States (GoodRx) that may be utilized by uninsured (or cash-paying) consumers; and called 20 U.S. pharmacies. Similarly, to determine the amount insured and uninsured consumers may pay out-of-pocket for prescription drugs in Canada, we obtained and reviewed data from national pricing sources, reviewed published literature on consumer cost-sharing, and called 21 Canadian pharmacies.15 To determine the amount insured consumers may pay out-of-pocket for prescription drugs in Australia and France, we reviewed information from each country’s publicly available national pricing source. Because prescription drug pricing is nationally regulated and prescription drug coverage is universal in Australia and France, we did not perform a similar analysis for uninsured consumers in these countries. For both objectives, we also reviewed country-specific guidance and other relevant information on prescription drug coverage and price controls in the United States and select comparison countries and interviewed government officials—including officials from the United States Department of Health and Human Services’ Office of the Assistant Secretary for Planning and Evaluation—and other industry and academic researchers with expertise in conducting international price comparisons in recent years. We also obtained information from several manufacturers with prescription drugs included in our comparisons regarding their perspectives on differences in prescription drug prices across countries. We assessed the reliability of the data sets used in our analyses by 15When judgmentally selecting pharmacies for direct calls in both the United States and Canada, we selected a mix of prescription drug retailers from geographically diverse areas. Our United States calls included pharmacies from six different states and both urban and rural areas. Our Canadian calls included pharmacies from five different cities (both smaller and larger) within the province of Ontario. Page 6 GAO-21-282 International Drug Price Comparison
reviewing related documentation and interviewing officials, among other
steps. We determined the data were sufficiently reliable for the purposes
of our reporting objectives.

We conducted this performance audit from May 2019 to March 2021 in
accordance with generally accepted government auditing standards.
Those standards require that we plan and perform the audit to obtain
sufficient, appropriate evidence to provide a reasonable basis for our
findings and conclusions based on our audit objectives. We believe that
the evidence obtained provides a reasonable basis for our findings and
conclusions based on our audit objectives.

Background
The United States, Australia, Canada, and France all have developed
economies with relatively large gross domestic products (GDP) and
similar GDP per capita, but these countries vary in population size and in
two pharmaceutical spending measures—pharmaceutical spending per
capita and pharmaceutical spending as a percentage of GDP.16
According to the OECD, the United States has the largest population and
leads the four countries in each of the economic and pharmaceutical
measures. Australia has the smallest population of the four countries but
the highest GDP per capita after the United States; Canada has the
highest pharmaceutical spending, both per capita and as a percent of
GDP, after the United States; and France has a larger population than

16GDP  is the standard economic measure of the value added created through the
production of goods and services in a country during a certain period of time. As such, it
also measures the income earned from that production, but is not a measure of people’s
material well-being.

According to the OECD, pharmaceutical spending covers expenditure on prescription
drugs and over-the-counter products, but excludes drugs provided in hospitals or other
care settings. Final expenditure on pharmaceuticals includes wholesale and retail margins
and value-added tax. Total pharmaceutical spending refers in most countries to “net”
spending—that is, adjusted for possible rebates payable by manufacturers, wholesalers,
or pharmacies.

Page 7                                     GAO-21-282 International Drug Price Comparison
both Australia and Canada and falls between Canada and Australia in
GDP and the pharmaceutical spending measures.17 (See fig. 1.)

17See   Organisation for Economic Co-operation and Development, “Population”, accessed
November 17, 2020, https://data.oecd.org/pop/population.htm; “Gross Domestic Product”,
accessed December 2, 2020, https://data.oecd.org/gdp/gross-domestic-product-gdp.htm;
and “Pharmaceutical Spending” accessed November 17, 2020,
https://data.oecd.org/healthres/pharmaceutical-spending.htm.

Page 8                                   GAO-21-282 International Drug Price Comparison
Figure 1: Selected Countries and Relevant Economic Data, 2018 or Most Recent Year

                                        Page 9                                GAO-21-282 International Drug Price Comparison
Data table for Figure 1: Selected Countries and Relevant Economic Data, 2018 or
Most Recent Year
Country Population, in GDP (U.S. Pharmaceutical Pharmaceutical
millions dollars spending (U.S. spending (% of
per dollars per capita) GDP)
capita)
Canada 37.1 $50,078 $865 1.8%
France 66.9 $46,398 $671 1.5%
United 327.2 $62,949 $1,229 2.0%
States
Australia 25.0 $53,851 $651 1.3%
Note: Population and gross domestic product (GDP) data were from 2018 for each country.
Pharmaceutical spending data, both per capita and as a percent of GDP, were from 2018 for the
United States, Canada, and France and from 2017 for Australia. According to the OECD,
pharmaceutical spending covers expenditure on prescription drugs and over-the-counter products but
excludes drugs provided in hospitals or other care settings. Final expenditure on pharmaceuticals
includes wholesale and retail margins and value-added tax. Total pharmaceutical spending refers in
most countries to “net” spending—that is, adjusted for possible rebates payable by manufacturers,
wholesalers, or pharmacies.
Further, spending on research and development in the pharmaceutical
sector varies among our selected countries. According to the OECD,
pharmaceutical research and development are funded from a complex
mix of private and public sources—governments mainly support basic and
early-stage research, and the pharmaceutical industry, while active
across all phases of research and development, makes the largest
contribution to translating and applying knowledge to develop products.18
Among OECD member countries with available data, nearly two-thirds of
pharmaceutical research and development expenditures occur in the
United States.19 In addition, among our selected countries, the
18According to the OECD, government support is provided through direct budget
allocations, research grants, publicly owned research institutions, and higher education
institutions. In addition, clinical trials required to gain market approval are largely funded
by industry; however, industry also receives direct research and development subsidies or
tax credits in many countries. See Organisation for Economic Co-operation and
Development, “Research and Development in the Pharmaceutical Sector”, Health at a
Glance 2019: OECD Indicators, (Paris, France: 2019).
19We have also reported that pharmaceutical company-reported research and
development spending in the United States grew slightly from 2008 through 2014, while
federally funded spending decreased slightly over the same period. In addition, industry
spending focused on drug development rather than earlier-stage research, whereas direct
federal spending, such as through grants from the National Institutes of Health, funded a
greater amount of basic research. See GAO, Drug Industry: Profits, Research and
Development Spending, and Merger and Acquisition Deals, GAO-18-40 (Washington,
D.C.: Nov. 17, 2017).
Page 10 GAO-21-282 International Drug Price Comparisonpharmaceutical industry research and development expenditures as a share of GDP are highest in the United States. Specifically, according to OECD data for the most recent year available, pharmaceutical industry research and development expenditures in the United States were 0.34 percent of GDP compared to 0.03, 0.02, and 0.03 percent of GDP in Australia, Canada, and France, respectively.20 (See fig. 2). Figure 2: Pharmaceutical Industry Research and Development Expenditure as a Share of Gross Domestic Product (GDP), 2017 or Most Recent Year Available Data table for Figure 2: Pharmaceutical Industry Research and Development Expenditure as a Share of Gross Domestic Product (GDP), 2017 or Most Recent Year Available Country Percent of GDP United States 0.34 Australia 0.03 Canada 0.02 France 0.03 Notes: Data for the United States, Canada, and France were from 2017. The most recent data available for Australia was from 2013. Pharmaceutical research and development in this figure refers to expenditures on research and development by businesses classified in the pharmaceutical industry, known as the business enterprise expenditure for research and development, and covers 20Pharmaceutical research and development in this context refers to expenditures on research and development by businesses classified in the pharmaceutical industry, known as the business enterprise expenditure for research and development, and covers research and development carried out by corporations, regardless of the origin of the funding, which can include government subsidies. See Organisation for Economic Co- operation and Development, “Research and Development in the Pharmaceutical Sector.” Page 11 GAO-21-282 International Drug Price Comparison
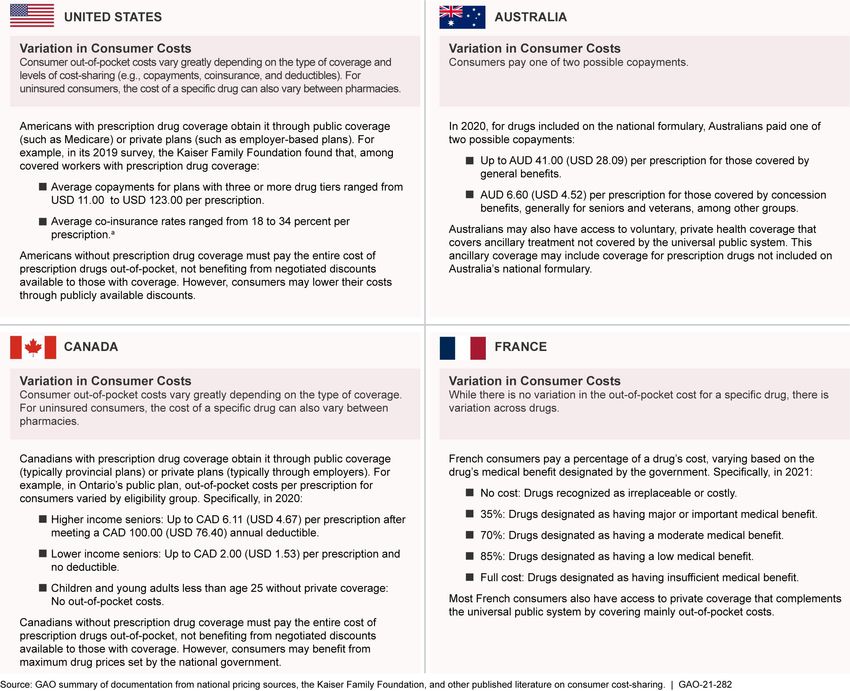
research and development carried out by corporations, regardless of the origin of the funding, which
can include government subsidies.

Prescription Drug Coverage
Prescription drug coverage varies by country. Australia and France
provide centralized universal public coverage for prescription drugs and
have established national formularies—a list of prescription drugs
approved for coverage. Prescription drug coverage in Canada and the
United States is not universal, although both countries have various
publicly funded coverage options for some segments of their
populations—such as the elderly or veterans. In addition, all of the
countries in our review have private prescription drug coverage options
available. For example, France has voluntary private coverage that
complements the public system by covering the out-of-pocket costs from
the public plan, and Australians can purchase private health coverage
that may pay for drugs not included on the national formulary. Private
coverage in Canada and the United States is generally used by
consumers who do not have access to publicly funded coverage. In
general, those without prescription drug coverage in both Canada and the
United States pay the full retail-level cost of prescription drugs out-of-
pocket. See table 1 for summary information about prescription drug
coverage in each of the four countries.

Page 12                                         GAO-21-282 International Drug Price Comparison
Table 1: Summary of Prescription Drug Coverage in the United States, Australia, Canada, and France

United States                                  Australia                            Canada                              France
Not universal                                  Universal                            Not Universal                       Universal
The United States does not                     Australia has a universal,           Canada has a universal,             France has a universal, publicly
have universal public health                   publicly funded health               publicly funded health insurance    funded health insurance system
insurance or prescription drug                 insurance system that includes       system, but this system does        that covers prescription drugs
insurance coverage. Instead,                   coverage for prescription drugs      not include coverage for            included on its national
Americans generally receive                    included on its national             prescription drugs. Instead,        formulary.
prescription drug coverage                     formulary—a list of covered          Canadians receive prescription      Complementary
either through a publicly or                   prescription drugs.                  drug coverage either through a
privately funded plan (or both),                                                    publicly or privately funded plan   France also has voluntary,
                                               Ancillary                                                                private health coverage that
or do not have coverage.                                                            (or both), or they do not have
                                               Australia also has voluntary,        coverage.                           complements the universal
For example, the United States                 private health coverage that                                             public system by covering out-
has several federal agencies                   covers ancillary treatment not       Specifically, each of Canada’s      of-pocket costs incurred under
and programs, including the                    covered by the universal public      provinces and territories have      the public system.
Department of Veterans Affairs’                system. This ancillary coverage      their own public prescription
(VA) Veterans Health                           may include coverage for             drug coverage options with
Administration (VHA), which                    prescription drugs not included      varying eligibility requirements
provide health care to veterans.               on Australia’s national              and consumer costs. The
These also include Medicare,                   formulary.                           federal government also has a
which generally covers the                                                          public plan for eligible groups,
elderly, and Medicaid, a joint                                                      including eligible indigenous
federal and state program that                                                      peoples. In addition, private
covers qualifying low-income                                                        prescription drug coverage is
adults and children. In addition,                                                   available for many Canadians,
private coverage is available,                                                      often through employers.
obtained through employers or
purchased on the individual
market.
Source: GAO summary of documentation from each country. | GAO 21-282

                                                             Prescription Drug Pricing Strategies
                                                             Each of the four countries uses varying pricing strategies to limit the price
                                                             of prescription drugs. However, the United States is the only country in
                                                             our review that does not have an overarching national pricing strategy for
                                                             prescription drugs, although some of its publicly funded coverage, such
                                                             as Medicaid and the Department of Veterans Affairs’ (VA) Veterans
                                                             Health Administration (VHA), use pricing strategies.21 Some researchers
                                                             have noted that cross-country differences in the introduction and uptake
                                                             of new prescription drugs are likely influenced by country specific pricing
                                                             strategies—specifically, countries’ processes for assessing the
                                                             therapeutic value of new medicines. See table 2 for summary information

                                                             21Medicaid   is the joint federal-state program that finances health care coverage for
                                                             qualifying low-income adults and children. VA provides prescription drug coverage to
                                                             eligible veterans and their eligible dependents.

                                                             Page 13                                    GAO-21-282 International Drug Price Comparison
about prescription drug pricing strategies used in each of the four
selected countries. For more detailed information on each country’s
prescription drug pricing strategies, see appendix III.
Table 2: Summary of Prescription Drug Pricing Strategies in the United States, Australia, Canada, and France
United States Australia Canada France
No overall national strategy Negotiated national prices Regulated maximum national Negotiated national prices
but various strategies at Australia’s national formulary is prices France negotiates a price for
plan level limited to prescription drugs for Canada regulates the maximum each drug based on its added
The United States does not which the government and price at which manufacturers therapeutic value. The added
have a national prescription manufacturers have agreed to can sell patented prescription therapeutic value of a new
drug pricing strategy, but the prices. First, each prescription drugs in Canadian markets. prescription drug is given a price
various publicly funded drug is assessed by a number of Upon introduction and classification that is established
coverage options available factors, including comparing the thereafter, as required until the in relation to a comparator
use a range of prescription effectiveness of two or more patent expires, a prescription prescription drug. This
drug pricing strategies. These prescription drugs that are drug’s price is reviewed against classification determines the
include statutorily defined therapeutically equivalent. If a guidelines, such as the parameters in place for the
rebates and other price drug is recommended for prescription drug’s median government’s price negotiation
concessions and pricing inclusion, the government then international price in comparator with the manufacturer. If
formulas for some federal negotiates with the manufacturer countries, to determine if its agreement can be reached on
options like Medicaid and the the price it will pay. If no price is excessive. When prices the price, the prescription drug is
Veterans Health agreement is reached on a are determined to be excessive, added to the national formulary.
Administration (VHA).a In price, the prescription drug is not manufacturers must decrease Cap on drug manufacturers’
addition, private health plans included on the formulary. the prescription drug’s price, pay sales growth
that participate in Medicare back the excess to the
Part D negotiate prices and government, or both. Each year, France caps the
rebates and other price growth of drug companies’ total
Joint negotiations sales. When manufacturer sales
concessions and apply
utilization management, tiered Canada’s public (federal, exceed the cap, manufacturers
formularies, and benefit provincial, and territorial) must pay the government a
design to prefer, discourage, prescription drug plans “clawback”—a rebate set based
or exclude certain prescription collectively negotiate—through on sales revenue.
drugs. Further, other private the pan-Canadian
plans, including employer- Pharmaceutical Alliance—with
sponsored plans, employ manufacturers to determine
similar strategies. prices paid by the public plans.
Source: GAO summary of documentation from each country. | GAO 21-282
a
For example, Medicaid uses mandatory prescription drug price rebates and other price concessions,
and the Department of Veterans Affairs (VA) has access to statutory discounts on its drug purchases
and receives additional discounts if drug prices rise faster than general inflation. In addition, VA may
negotiate further price discounts for drugs included on its formulary through blanket purchase
agreements or other national contracts with manufacturers.
Prescription Drug Supply Chain
The prescription drug supply chain within the United States, Australia,
Canada, and France includes a number of entities, with differing prices
paid to each entity.
Page 14 GAO-21-282 International Drug Price Comparison· Manufacturer: The drug manufacturer develops and produces
prescription drugs that are purchased by other entities within the
supply chain. The manufacturer-level price (sometimes referred to as
the ex-manufacturer price or ex-factory price) generally refers to the
amount the manufacturer receives for a prescription drug by entities
such as the wholesaler or retailer; however, the manufacturer may
provide rebates or other price concessions to the various entities
within the supply chain. For the purpose of this report, we generally
refer to the manufacturer price as the gross price at the manufacturer
level, and we refer to the amount received by manufacturers from
entities such as the wholesaler and retailer, less rebates and other
price concessions, as the net manufacturer price.
· Wholesaler: The wholesaler is a distributor that may purchase
prescription drugs directly from a manufacturer and sell them to other
entities later in the supply chain.
· Retailer: The retailer is the pharmacy or other public or private
distributor through which consumers may directly obtain prescription
drugs. Retailers may purchase prescription drugs from a wholesaler
or directly from the manufacturer. Consumers and other payers, such
as insurance plans (see below), pay a retail price to retailers when
purchasing prescription drugs—for the purpose of this report, we refer
to this as the gross price at the retail level. The net price at the retail
level is the total amount the retailer is paid for the prescription drug
less discounts and other price concessions that may be passed along
to payers. For example, a private insurer may have an agreement with
a manufacturer to receive volume discounts for sales of its drugs
within a given plan year—the price the insurer and the insured
consumer pay a retailer, less these discounts, represents the net price
at the retail level.
· Consumer: The consumer is the prescription drug user. Consumers
purchase prescription drugs from a retailer and may be responsible
for some or all of the prescription drug’s cost out-of-pocket.
· Other payers: Other payers include entities such as private insurers,
employers, or government programs that may pay for or contribute to
the cost of consumers’ prescription drugs. For example, other payers
may pay for a set percentage of the retail price of the drug and require
the consumer to pay the balance. (See fig. 3.)
Page 15 GAO-21-282 International Drug Price ComparisonFigure 3: Summary of Prescription Drug Supply Chain and Relevant Price Points
Page 16 GAO-21-282 International Drug Price ComparisonText of Figure 3: Summary of Prescription Drug Supply Chain and Relevant Price
Points
Manufacturer Price
· The drug manufacturer develops and produces prescription drugs that
are purchased by other entities within the supply chain. The
manufacturer-level price (sometimes referred to as the ex-
manufacturer price or ex-factory price) generally refers to the amount
the manufacturer receives for a prescription drug by entities such as
the wholesaler or retailer; however, the manufacturer may provide
rebates or other price concessions to the various entities within the
supply chain. For the purpose of this report, we generally refer to the
manufacturer price as the gross price at the manufacturer level, and
we refer to the amount received by manufacturers from entities such
as the wholesaler and retailer, less rebates and other price
concessions, as the net manufacturer price.
Wholesaler
· The wholesaler is a distributor that may purchase prescription drugs
directly from a manufacturer and sell them to other entities later in the
supply chain.
Retailer
· The retailer is the pharmacy or other public or private distributor
through which consumers may directly obtain prescription drugs.
Retailers may purchase prescription drugs from a wholesaler or
directly from the manufacturer. Consumers and other payers, such as
insurance plans, pay a retail price to retailers when purchasing
prescription drugs—for the purpose of this report, we refer to this as
the gross price at the retail level. The net price at the retail level is the
total amount the retailer is paid for the prescription drug less discounts
and other price concessions that may be passed along to payers. For
example, a private insurer may have an agreement with a
manufacturer to receive volume discounts for sales of its drugs within
a given plan year—the price the insurer and the insured consumer
pay a retailer, less these discounts, represents the net price at the
retail level.
Page 17 GAO-21-282 International Drug Price ComparisonConsumer
· The consumer is the prescription drug user. Consumers purchase
prescription drugs from a retailer and may be responsible for some or
all of the prescription drug’s cost out of pocket.
Other payers
· Other payers include entities such as a private insurer or employer
that may contribute to the cost of consumers’ prescription drugs. For
example, other payers may pay for a set percentage of the retail price
of the drug and require the consumer to pay the balance.
Source: GAO analysis of information from GoodRx, Kaiser Family
Foundation, and other public sources. | GAO-21-282
U.S. Net Prices for Selected Drugs Were, on
Average, More than Two to Four Times Higher
than Publicly Available Prices in Australia,
Canada (Ontario), and France
For the selected drugs in our review, estimated U.S. net prices at the
retail level were, on average, more than two to four times higher than
publicly available retail prices in Australia, Canada (Ontario), and France.
At the manufacturer level, the comparisons between U.S. net prices and
publicly available prices in our selected comparison countries followed a
very similar trend—estimated U.S. net prices were also more than two to
four times higher.
At the Retail Level, U.S. Net Prices for Selected Drugs
Were, on Average, More than Two to Four Times Higher
than Publicly Available Prices in Selected Comparison
Countries
On average, the estimated U.S. net prices at the retail level for the
selected brand-name, single-source prescription drugs included in our
review were higher than publicly available (gross) prices in all three
Page 18 GAO-21-282 International Drug Price Comparisonselected comparison countries.22 For example, for the 20 drugs in our review for which we had pricing data for all three selected comparison countries in 2020, estimated U.S. net prices at the retail level were over four times higher, on average, than gross prices paid at the retail level in Australia and France and about 2.8 times higher than gross prices in Canada (Ontario).23 (See table 3.) 22While the estimated U.S. net prices reflect confidential rebates and other price concessions, information on such discounts was not publicly available for the comparison countries, so we used gross prices that do not reflect discounts. 23Of the 41 drugs included in our review, 20 were available on each relevant formulary in all three other countries—Australia, Canada (Ontario), and France—in 2020. Page 19 GAO-21-282 International Drug Price Comparison
3: Ratios of Estimated U.S. Net Prices to Selected Comparison Countries’ Gross
Prices at the Retail Level, for Selected Drugs, in 2020

                                                                               U.S. estimates were on average:
 Australia                                                                                              4.25 times higher
 Canada (Ontario)                                                                                       2.82 times higher
 France                                                                                                 4.36 times higher
Source: GAO analysis of Centers for Medicare & Medicaid Services data and selected countries’ formularies. | GAO 21-282

Notes: Our analysis was based on 20 brand-name, single-source prescription drugs that were among
those with the highest total expenditures and use in the U.S. Medicare Part D program in 2017 and
included on the formularies of all three selected comparison countries in 2020. U.S. net prices at the
retail level are the final amount paid to a retailer by all payers, such as a consumer and insurer, less
rebates and other price concessions the payers receive from any source. Estimates were calculated
by applying confidential, first quarter 2018 Medicare Part D rebate and price concession data, at a
per-drug level, to each drug’s projected gross price at the retail level in 2020. Prices for selected
comparison countries—Australia, Canada (Ontario), and France—were prices listed on their
respective public formularies from January 2020 and were converted to U.S. dollars at the relevant
monthly Federal Reserve rates.
While research has found that confidential rebates and other price
concessions are generally higher in the United States, rebates and price
concessions are also used in all three of our selected comparison
countries, according to public reporting and officials in Australia, Canada,
and France that we interviewed. However, data on these rebates and
price concessions were not publicly available at the time of our review.
Without accounting for these rebates and other price concessions, U.S.
gross prices at the retail level were higher than all equivalent gross prices
in Australia, Canada (Ontario), and France. Because our analysis could
not account for these rebates and other price concessions, actual net
price differences between U.S. net prices and net prices in our
comparison countries were likely larger than those identified in our
comparison.24

24For the 41 selected drugs, U.S. net prices at the retail level were lower than U.S. gross
prices by about 28 percent, on average.

Page 20                                                      GAO-21-282 International Drug Price Comparison
Some of the retail prices on Australia’s At the retail level, the drug-by-drug difference in U.S. net prices compared
formulary represented both the gross and net to the gross prices in all three selected comparison countries varied.
prices for that country, because, according to
Australian officials, certain drugs listed on
While the U.S. net prices were mostly higher (by as much as 10 times),
their formulary are not subject to rebates or some were lower. Specifically, four of the 41 drugs in our review had
price concessions. The Australian government estimated U.S. net prices at the retail level that were lower than a gross
confirms the existence of special pricing
arrangements on a per-drug basis via their price available at the retail level in one or more of the selected
public website. These special pricing comparison countries. For these four drugs, the lower estimated U.S. net
arrangements include, but are not limited to,
confidential rebates and other price
prices ranged from less than 1 percent to 70 percent lower than the gross
concessions. Of the 32 of our 41 selected prices in the selected comparison countries.25 However, it is possible that
drugs included in our analysis that were listed these drugs were subject to confidential rebates and other price
on Australia’s formulary in 2020, 14 did not
have special pricing arrangements. As a concessions in these countries. As a result, we do not know how the
result, Australia’s formulary prices for these estimated U.S. net prices for these four drugs compared to the actual net
drugs represented both the gross and net
prices. The one drug (Zepatier) for which the prices at the retail level in Australia, Canada (Ontario), and France. Using
estimated U.S. net price at the retail level was Australia as an example, of the 41 drugs included in our analysis, 32 were
lower than Australia’s gross price was among
those subject to rebates or price concessions.
included on Australia’s formulary in 2020, and the U.S. net prices were
Source: GAO analysis of information from Australian higher than Australia’s gross prices for all but one of these 32 drugs.
government officials and country-specific data. | GAO-21-
282
Figure 4 illustrates examples of the retail-level price comparisons for two
of our selected prescription drugs—Anoro Ellipta Inhalation Powder and
Epclusa Oral Tablet.26 For these two drugs, we found that one—Anoro
Ellipta Inhalation Powder—had a higher estimated U.S. net price than the
gross prices at the retail level in all three of our selected comparison
countries. For the second drug, Epclusa Oral Tablet, our estimated U.S.
net price was lower than the gross price in Canada (Ontario). The
estimated rebates and price concessions in the United States for this drug
were substantial—about 42 percent of the gross price. We do not know
the amount of confidential rebates and price concessions for this drug in
Canada (Ontario), but if it was only about one third the level of the U.S.
rebates and price concessions—12 percent of the gross price—the net
prices in Canada (Ontario) would have been lower than the estimated net
25Three of the four drugs had estimated U.S. net prices at the retail level that were lower
than the gross prices in Canada (Ontario); two were lower than gross prices in France,
and one was lower than the gross price in Australia.
26Inorder to permit public reporting on a per-drug basis, estimated U.S. net prices
reported in fig. 4 were developed using a methodology that was different than that used to
develop the summary statistics above. See appendix I for additional details.
Page 21 GAO-21-282 International Drug Price Comparisonprice in the U.S.27 (See fig. 4. App. IV contains details on all 41 selected prescription drugs.) Figure 4: Estimated U.S. Prices Compared to Selected Comparison Countries’ Prices at the Retail Level for Two Selected Drugs and Package Sizes, 2020 27The estimated rebates and price concessions in the United States for Epclusa Oral Tablet were 42 percent off its $25,018 gross retail price—or $10,581—resulting in an estimated net retail price of $14,437. If the rebates and price concessions in Canada (Ontario) for Epclusa Oral Tablet were 12 percent of its gross price of $16,204—or $1,944—the resulting net price would have been $14,260. Page 22 GAO-21-282 International Drug Price Comparison
Data table for Figure 4: Estimated U.S. Prices Compared to Selected Comparison
Countries’ Prices at the Retail Level for Two Selected Drugs and Package Sizes,
2020

 Country                           Anoro Ellipta                    Epclusa Oral Tablet
                                   Inhalation Power                 (28 tablet)
                                   (30 inhalations)
 United States                     $248 (net retail price);         $14,437 (net retail
                                   $429 (gross price                price); $25,018 (gross
                                   before rebates)                  price before rebates)
 Australia                         $64 (net retail price)           $8,668 (gross retail
                                                                    price)
 Canada (Ontario)                  $76 (gross retail                $16,204 (gross retail
                                   price)                           price)
 France                            $49 (gross retail                $9,211 (gross retail
                                   price)                           price)
Notes: Prices for Australia, Canada (Ontario), and France were effective January 2020. Local
currencies were converted to U.S. dollars (USD) using the United States Federal Reserve average
foreign exchange rates for the month of January 2020. Estimated U.S. net prices at the retail level
were calculated by projecting 2018 Medicare Part D gross prices to 2020 using commercially
available data and adjusted using confidential calendar year 2018 Medicare Part D rebates and other
price concessions at a per drug level to arrive at an estimated net price. In order to permit public
reporting on a per-drug basis, drugs were grouped into four quartiles, and projected 2020 Medicare
Part D gross prices were discounted using the average percentage rebate and other price
concessions from each relevant quartile.

At the Manufacturer Level, U.S. Net Prices for the Drugs
We Reviewed Were, on Average, More than Two to Four
Times Higher than Publicly Available Prices in Selected
Comparison Countries
Similar to prices at the retail level, on average, the estimated U.S. net
prices at the manufacturer level for the selected single-source, brand-
name prescription drugs included in our review were higher than publicly
available (gross) prices in all three selected comparison countries.
Specifically, for the 20 drugs in our review for which we had pricing data
for all three selected comparison countries in 2020, estimated U.S. net
prices at the manufacturer level were about four times higher than gross
prices in Australia and France and about 2.5 times higher compared to

Page 23                                        GAO-21-282 International Drug Price Comparison
You can also read