Rainier Beach: A Beautiful Safe Place for Youth - Rainier Beach: A Beautiful Safe ...
←
→
Page content transcription
If your browser does not render page correctly, please read the page content below
Center for Evidence-Based Crime Policy
                 Department of Criminology, Law & Society

Rainier Beach:
A Beautiful Safe Place for Youth

2020 Evaluation Update

Charlotte Gill, PhD
Heather Prince, MS

Report prepared for the City of Seattle

December 31, 2020

Contract Number: DC20-1603
The Center for Evidence-Based Crime Policy (CEBCP) in the Department of Criminology, Law and Society at George Mason University seeks to make scientific research a key component in decisions about crime and justice policies. The CEBCP carries out this mission by advanc- ing rigorous studies in criminal justice and criminology through research-practice collabora- tions, and proactively serving as an informational and translational link to practitioners and the policy community. Learn more about our work at http://cebcp.org and about the De- partment of Criminology, Law and Society at http://cls.gmu.edu. Charlotte Gill is Deputy Director of the Center for Evidence-Based Crime Policy and Associate Professor in the Department of Criminology, Law and Society at George Mason University. Heather Prince is a Graduate Research Assistant in the Center for Evidence-Based Crime Pol- icy and a doctoral student in the Department of Criminology, Law and Society at George Mason University. We are grateful for statistical assistance provided by David B. Wilson, Professor, Department of Criminology, Law and Society at George Mason University for this report. This evaluation update was funded by the City of Seattle Human Services Department, Con- tract # DC20-1603. Prior support for this research through 2016 was provided by the Bureau of Justice Assistance, U.S. Department of Justice (Byrne Criminal Justice Innovation grant # 2012-AJ-BX-0006) and funding from 2016 to 2018 was provided by the City of Seattle Human Services Department (Contract #s DC16-1603, DC17-1603, DC18-1603, and DC19-1603). The opinions, findings, and conclusions or recommendations expressed in this report are those of the authors and do not necessarily reflect those of the U.S. Department of Justice, the Bu- reau of Justice Assistance, or the City of Seattle.
Contents

List of Tables                                                                                                   ii

List of Figures                                                                                                  iv

Summary of Findings                                                                                               v

1   Background                                                                                                   1

2   2020 Intervention Update                                                                                     2
    2.1 Intervention summary . . . . . . . . . . . . . . . . . . . . . . . . . . . . . . . . . . . . . . .       2

3   2020 Evaluation Update: Summary of Methods                                                                   5
    3.1 Police crime data definitions . . . . . . . . . . . . . . . . . . . . . . . . . . . . . . . . . . . .    6
    3.2 Community survey . . . . . . . . . . . . . . . . . . . . . . . . . . . . . . . . . . . . . . . . .       7
    3.3 Analytic strategy . . . . . . . . . . . . . . . . . . . . . . . . . . . . . . . . . . . . . . . . . .    8

4   Updated Evaluation Findings                                                                                  9
    4.1 Crime is still trending down in most of the hot spots, but some positive trends from last
        year have reversed . . . . . . . . . . . . . . . . . . . . . . . . . . . . . . . . . . . . . . . . .     9
    4.2 Calls for service remain significantly higher in the hot spots, but individual ABSPY inter-
        ventions affect crime outcomes differently . . . . . . . . . . . . . . . . . . . . . . . . . . .        14
    4.3 Satisfaction with interventions is high, but business improvements need attention . . . .               16
    4.4 Fewer people think crime has gotten better in Rainier Beach in the past year . . . . . . . .            17
    4.5 Social cohesion is fairly high among 2020 respondents, although most do not think that
        people are willing to intervene . . . . . . . . . . . . . . . . . . . . . . . . . . . . . . . . . .     19
    4.6 Satisfaction with the police is low, and people report low levels of police visibility . . . . .        20

5   Conclusions and Recommendations                                                                             22
    5.1 Recommendations for 2021 . . . . . . . . . . . . . . . . . . . . . . . . . . . . . . . . . . . .        24

Statistical Appendix                                                                                            A.1

                                                         i
List of Tables
A1 Random effects negative binomial regression on calls for service . . . . . . . . . . . . . . . A.1
A2 Random effects negative binomial regression on all offenses . . . . . . . . . . . . . . . . . A.2
A3 Random effects negative binomial regression on offenses involving youth . . . . . . . . . A.3
A4 Random effects negative binomial regression on violent offenses . . . . . . . . . . . . . . A.4
A5 Random effects negative binomial regression on part A person offenses . . . . . . . . . . A.5
A6 Random effects negative binomial regression on part A property offenses . . . . . . . . . A.6
A7 Random effects negative binomial regression on part B offenses . . . . . . . . . . . . . . . A.7
List of Figures
1 Rainier Beach hot spots identified for ABSPY intervention . . . . . . . . . . . . . . . . . . . 1
2 Monthly youth and adult offense counts in the South Precinct, September 2011-August
2020 . . . . . . . . . . . . . . . . . . . . . . . . . . . . . . . . . . . . . . . . . . . . . . . . . 10
3 Offenses and incidents in all Rainier Beach hot spots, September 2011-August 2020 . . . 10
4 Offenses and incidents at Rose Street, September 2011-August 2020 . . . . . . . . . . . . 11
5 Offenses and incidents at Rainier & Henderson, September 2011-August 2020 . . . . . . . 12
6 Offenses and incidents at Light Rail, September 2011-August 2020 . . . . . . . . . . . . . 13
7 Offenses and incidents at Lake Washington, September 2011-August 2020 . . . . . . . . . 13
8 Offenses and incidents at Safeway, September 2011-August 2020 . . . . . . . . . . . . . . 14
9 Survey respondents’ satisfaction with ABSPY and specific interventions . . . . . . . . . . . 17
10 Survey respondents’ assessment of change in crime in the hot spots in the past year . . . 18
11 Survey respondents’ perceptions of safety in the hot spots . . . . . . . . . . . . . . . . . . 18
12 Survey respondents’ perceptions of frequency of disorder in the hot spots . . . . . . . . . 19
13 Survey respondents’ perceptions of likelihood of serious crime in the hot spots . . . . . . 19
14 Survey respondents’ perceptions of social cohesion in the hot spots . . . . . . . . . . . . . 20
15 Survey respondents’ perceptions of collective efficacy in the hot spots . . . . . . . . . . . 21
16 Survey respondents’ perceptions of frequency of police activity in the hot spots . . . . . . 22
17 Survey respondents’ perceptions of police in the hot spots . . . . . . . . . . . . . . . . . . 22
A1 Percent change in calls for service in hot spots, Rainier Beach, and South Precinct, pre/post
May 2014 . . . . . . . . . . . . . . . . . . . . . . . . . . . . . . . . . . . . . . . . . . . . . . A.8
A2 Percent change in offenses in hot spots, Rainier Beach, and South Precinct, pre/post May
2014 . . . . . . . . . . . . . . . . . . . . . . . . . . . . . . . . . . . . . . . . . . . . . . . . . A.8
A3 Percent change in youth offenses in hot spots, Rainier Beach, and South Precinct, pre/post
May 2014 . . . . . . . . . . . . . . . . . . . . . . . . . . . . . . . . . . . . . . . . . . . . . . A.9
A4 Percent change in violent offenses in hot spots, Rainier Beach, and South Precinct, pre/post
May 2014 . . . . . . . . . . . . . . . . . . . . . . . . . . . . . . . . . . . . . . . . . . . . . . A.9
A5 Percent change in NIBRS Group A Person offenses in hot spots, Rainier Beach, and South
Precinct, pre/post May 2014 . . . . . . . . . . . . . . . . . . . . . . . . . . . . . . . . . . . . A.10
A6 Percent change in NIBRS Group A Property offenses in hot spots, Rainier Beach, and South
Precinct, pre/post May 2014 . . . . . . . . . . . . . . . . . . . . . . . . . . . . . . . . . . . . A.10
A7 Percent change in NIBRS Group B offenses in hot spots, Rainier Beach, and South Precinct,
pre/post May 2014 . . . . . . . . . . . . . . . . . . . . . . . . . . . . . . . . . . . . . . . . . A.11
A8 Percent change in calls for service at Rose Street and its comparison site, pre/post May 2014A.11
iiRainier Beach: A Beautiful Safe Place for Youth 2020 Update
A9 Percent change in all offenses at Rose Street and its comparison site, pre/post May 2014 . A.12
A10 Percent change in youth offenses at Rose Street and its comparison site, pre/post May 2014A.12
A11 Percent change in violent offenses at Rose Street and its comparison site, pre/post May
2014 . . . . . . . . . . . . . . . . . . . . . . . . . . . . . . . . . . . . . . . . . . . . . . . . . A.13
A12 Percent change in NIBRS Group A person offenses at Rose Street and its comparison site,
pre/post May 2014 . . . . . . . . . . . . . . . . . . . . . . . . . . . . . . . . . . . . . . . . . A.13
A13 Percent change in NIBRS Group A property offenses at Rose Street and its comparison site,
pre/post May 2014 . . . . . . . . . . . . . . . . . . . . . . . . . . . . . . . . . . . . . . . . . A.14
A14 Percent change in NIBRS Group B offenses at Rose Street and its comparison site, pre/post
May 2014 . . . . . . . . . . . . . . . . . . . . . . . . . . . . . . . . . . . . . . . . . . . . . . A.14
A15 Percent change in calls for service at Rainier & Henderosn and its comparison site, pre/post
May 2014 . . . . . . . . . . . . . . . . . . . . . . . . . . . . . . . . . . . . . . . . . . . . . . A.15
A16 Percent change in all offenses at Rainier & Henderson and its comparison site, pre/post
May 2014 . . . . . . . . . . . . . . . . . . . . . . . . . . . . . . . . . . . . . . . . . . . . . . A.15
A17 Percent change in youth offenses at Rainier & Henderson and its comparison site, pre/post
May 2014 . . . . . . . . . . . . . . . . . . . . . . . . . . . . . . . . . . . . . . . . . . . . . . A.16
A18 Percent change in violent offenses at Rainier & Henderson and its comparison site, pre/post
May 2014 . . . . . . . . . . . . . . . . . . . . . . . . . . . . . . . . . . . . . . . . . . . . . . A.16
A19 Percent change in NIBRS Group A person offenses at Rainier & Henderson and its compar-
ison site, pre/post May 2014 . . . . . . . . . . . . . . . . . . . . . . . . . . . . . . . . . . . . A.17
A20 Percent change in NIBRS Group A property offenses at Rainier & Henderson and its com-
parison site, pre/post May 2014 . . . . . . . . . . . . . . . . . . . . . . . . . . . . . . . . . . A.17
A21 Percent change in NIBRS Group B offenses at Rainier & Henderson and its comparison site,
pre/post May 2014 . . . . . . . . . . . . . . . . . . . . . . . . . . . . . . . . . . . . . . . . . A.18
A22 Percent change in calls for service at Light Rail and its comparison site, pre/post May 2014 A.18
A23 Percent change in all offenses at Light Rail and its comparison site, pre/post May 2014 . . A.19
A24 Percent change in youth offenses at Light Rail and its comparison site, pre/post May 2014 A.19
A25 Percent change in violent offenses at Light Rail and its comparison site, pre/post May 2014 A.20
A26 Percent change in NIBRS Group A person offenses at Light Rail and its comparison site,
pre/post May 2014 . . . . . . . . . . . . . . . . . . . . . . . . . . . . . . . . . . . . . . . . . A.20
A27 Percent change in NIBRS Group A property offenses at Light Rail and its comparison site,
pre/post May 2014 . . . . . . . . . . . . . . . . . . . . . . . . . . . . . . . . . . . . . . . . . A.21
A28 Percent change in NIBRS Group B offenses at Light Rail and its comparison site, pre/post
May 2014 . . . . . . . . . . . . . . . . . . . . . . . . . . . . . . . . . . . . . . . . . . . . . . A.21
A29 Percent change in calls for service at Lake Washington and its comparison site, pre/post
May 2014 . . . . . . . . . . . . . . . . . . . . . . . . . . . . . . . . . . . . . . . . . . . . . . A.22
A30 Percent change in all offenses at Lake Washington and its comparison site, pre/post May
2014 . . . . . . . . . . . . . . . . . . . . . . . . . . . . . . . . . . . . . . . . . . . . . . . . . A.22
A31 Percent change in youth offenses at Lake Washington and its comparison site, pre/post
May 2014 . . . . . . . . . . . . . . . . . . . . . . . . . . . . . . . . . . . . . . . . . . . . . . A.23
A32 Percent change in violent offenses at Lake Washington and its comparison site, pre/post
May 2014 . . . . . . . . . . . . . . . . . . . . . . . . . . . . . . . . . . . . . . . . . . . . . . A.23
A33 Percent change in NIBRS Group A person offenses at Lake Washington and its comparison
site, pre/post May 2014 . . . . . . . . . . . . . . . . . . . . . . . . . . . . . . . . . . . . . . A.24
A34 Percent change in NIBRS Group A property offenses at Lake Washington and its compari-
son site, pre/post May 2014 . . . . . . . . . . . . . . . . . . . . . . . . . . . . . . . . . . . . A.24
A35 Percent change in NIBRS Group B offenses at Lake Washington and its comparison site,
pre/post May 2014 . . . . . . . . . . . . . . . . . . . . . . . . . . . . . . . . . . . . . . . . . A.25
iiiRainier Beach: A Beautiful Safe Place for Youth 2020 Update
A36 Percent change in calls for service at Safeway and its comparison site, pre/post May 2014 A.26
A37 Percent change in all offenses at Safeway and its comparison site, pre/post May 2014 . . . A.26
A38 Percent change in youth offenses at Safeway and its comparison site, pre/post May 2014 . A.27
A39 Percent change in violent offenses at Safeway and its comparison site, pre/post May 2014 A.27
A40 Percent change in NIBRS Group A person offenses at Safeway and its comparison site,
pre/post May 2014 . . . . . . . . . . . . . . . . . . . . . . . . . . . . . . . . . . . . . . . . . A.28
A41 Percent change in NIBRS Group A property offenses at Safeway and its comparison site,
pre/post May 2014 . . . . . . . . . . . . . . . . . . . . . . . . . . . . . . . . . . . . . . . . . A.28
A42 Percent change in NIBRS Group B offenses at Safeway and its comparison site, pre/post
May 2014 . . . . . . . . . . . . . . . . . . . . . . . . . . . . . . . . . . . . . . . . . . . . . . A.29
A43 Calls for service in treatment and comparison sites, January 2011-August 2020 . . . . . . A.30
A44 Predicted number of calls by treatment assignment and intervention status . . . . . . . . A.30
A45 Offenses in treatment and comparison sites, January 2011-August 2020 . . . . . . . . . . A.31
A46 Predicted number of offenses by treatment assignment and intervention status . . . . . . A.31
A47 Youth offenses in treatment and comparison sites, January 2011-August 2020 . . . . . . . A.32
A48 Predicted number of youth offenses by treatment assignment and intervention status . . A.32
A49 Violent offenses in treatment and comparison sites, January 2011-August 2020 . . . . . . A.33
A50 Predicted number of violent offenses by treatment assignment and intervention status . A.33
A51 NIBRS Group A person offenses in treatment and comparison sites, January 2011-August
2020 . . . . . . . . . . . . . . . . . . . . . . . . . . . . . . . . . . . . . . . . . . . . . . . . . A.34
A52 Predicted number of NIBRS Group A person offenses by treatment assignment and inter-
vention status . . . . . . . . . . . . . . . . . . . . . . . . . . . . . . . . . . . . . . . . . . . . A.34
A53 NIBRS Group A property offenses in treatment and comparison sites, January 2011-August
2020 . . . . . . . . . . . . . . . . . . . . . . . . . . . . . . . . . . . . . . . . . . . . . . . . . A.35
A54 Predicted number of NIBRS Group A property offenses by treatment assignment and in-
tervention status . . . . . . . . . . . . . . . . . . . . . . . . . . . . . . . . . . . . . . . . . . A.35
A55 NIBRS Group B offenses in treatment and comparison sites, January 2011-August 2020 . . A.36
A56 Predicted number of NIBRS Group B offenses by treatment assignment and intervention
status . . . . . . . . . . . . . . . . . . . . . . . . . . . . . . . . . . . . . . . . . . . . . . . . . A.36
ivSummary of Findings
What is Rainier Beach: A Beautiful Safe Place for Youth?
Rainier Beach: A Beautiful Safe Place for Youth (ABSPY) is an innovative community-led, place-
based violence prevention initiative. The goal of the program is to reduce youth victimization
and crime in the Rainier Beach neighborhood. The program is named for the vision set out
by the Rainier Beach community in its Neighborhood Plan Update, which is to make Rainier
Beach a Beautiful Safe Place. ABSPY is happening in five small groups of street blocks in the
neighborhood—“hot spots”—where about half of all youth crime incidents in Rainier Beach
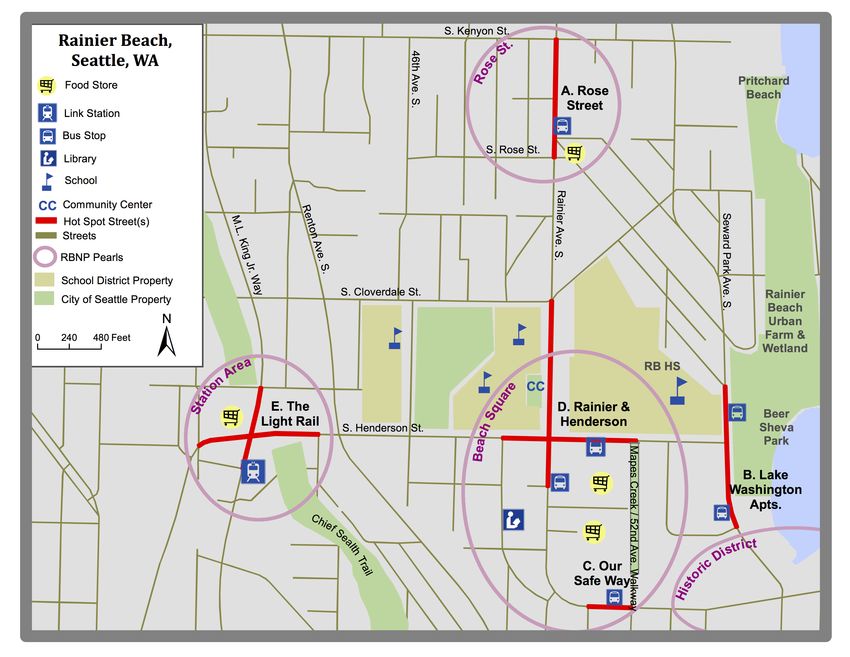
happened in 2012. The five hot spots are Rose Street, Rainier and Henderson, Rainier Beach Light
Rail Station, Lake Washington, and Our Safe Way. This report updates our original 2016 evaluation
report and updates in 2017, 2018, and 2019.
ABSPY Background
ABSPY is based on a number of research studies, including one from Seattle by David Weisburd
and his colleagues, showing that about half of all crime in cities comes from a very small number—
typically about 5 percent—of street blocks. Crime involving young people is even more likely to
come from a small number of places. Research shows that police efforts to reduce crime at hot
spots through crackdowns and arrests are effective at reducing crime, but arrest and prosecution
can increase the chance of reoffending among high-risk youth. ABSPY focuses on non-arrest
strategies to reduce crime, such as building community leadership and capacity to help solve
problems and addressing environmental risk factors for crime to promote community safety.
ABSPY was originally funded by a $1 million grant from the Byrne Criminal Justice Innovation
Program, an initiative of the U.S. Department of Justice’s Bureau of Justice Assistance, awarded
in 2012, and has been funded by the City of Seattle since 2016. The Byrne Criminal Justice
Innovation Program supports partnerships between cities, communities, and researchers to
develop community-led, place-based, data-driven problem-solving efforts. ABSPY is advised by a
Core Team including representatives from the City of Seattle, the Seattle Neighborhood Group,
Seattle Police Department, the Boys and Girls Club of King County, Seattle Public Schools, and the
Rainier Beach Action Coalition. However, what makes ABSPY unique is that community members
in Rainier Beach itself took the lead in developing evidence-informed strategies to address the
root causes of youth crime in the neighborhood.
Community-Led Problem Solving
From 2013 through 2016, in an effort overseen by the Core Team, community members from the
five Rainier Beach hot spots took the lead in developing evidence-informed strategies to address
the root causes of youth crime in the neighborhood. These interventions were tailored to the spe-
cific conditions in each hot spot, and continue to be regularly updated and adjusted based on new
data and changing conditions in the hot spots. ABSPY’s signature interventions include:
• Corner Greeter events, led by the Rainier Beach Action Coalition, in which young people
from the neighborhood set up stations offering refreshments, information, and fun activities
in each hot spot to engage community members and “activate” places that were previously
considered to be unsafe.
• Safe Passage, led by the Boys and Girls Club of King County, which provides guardianship,
supervision, and encouragement to young people as they leave school.
v• Business engagement, coordinated by Seattle Neighborhood Group and supported by the
Rainier Beach Merchants Association, Seattle Police Department, and local community and
economic development organizations. This intervention focuses on learning about the con-
cerns facing local businesses, building relationships between businesses and with the police,
and increasing business owners’ ability to prevent and report crime.
• Crime Prevention Through Environmental Design (CPTED) interventions and resources,
applied to both public and private property, to improve design, layout, and place manage-
ment.
• Positive Behavioral Interventions and Supports (PBIS) in both school and community
settings, overseen by Seattle Public Schools and the ABSPY Core Team, to collaboratively set
behavioral expectations for young people, reward good behavior, and support youth in need
of services.
Updated Evaluation Findings
The Center for Evidence-Based Crime Policy at George Mason University is the research partner for
ABSPY. We tracked calls for service and reported crime in the five hot spots from September 2011
to August 2020. We paired each Rainier Beach hot spot with a comparison hot spot—a similar
location elsewhere in Seattle Police Department’s South Precinct—and assessed crime rates in
the Rainier Beach hot spots and neighborhood compared to trends in the South Precinct. We
were not able to conduct our usual in-person community survey in the hot spots and comparison
sites in 2020 due to the COVID-19 pandemic, but we were able to conduct a small online survey
with some community members who subscribe to the Rainier Beach Action Coalition’s mailing
list. Although the survey respondents and sample size are not comparable to previous years, we
asked the same questions.
Our updated findings for 2020 show that crime in the ABSPY hot spots continues to trend
downwards, but the events of 2020 and some of the challenges ABSPY has experienced over the
past few years have highlighted some areas where renewed focus is needed.
• Crime is still trending down in most of the hot spots, but some positive trends from last year
have reversed. Last year youth crime almost disappeared at Rose Street and the Light Rail,
but we saw small upticks this year. However, the Rainier and Henderson and Lake Washing-
ton hot spots have seen long-term downward trends in youth crime.
• Calls for service remain significantly higher in the hot spots, but individual ABSPY interven-
tions seem to affect crime outcomes differently according to new statistical models we im-
plemented this year.
• Satisfaction with ABSPY interventions is high, but business improvements need attention.
Because our survey sample this year was connected to RBAC, they were all well aware of
ABSPY’s work in the Rainier Beach community. However, those who responded to the survey
were somewhat dissatisfied with the business improvements in the community. This also
aligns with a conversation that occurred early in 2020 within the Core Team about the low
visibility of CPTED interventions.
vi• Fewer people in this year’s survey believe crime has gotten better in Rainier Beach in the
past year. While these results are not really comparable to previous years, a majority of re-
spondents this year believed crime had stayed the same or gotten worse. While they felt
fairly safe in most situations in the hot spots, they reported noticing various types of disor-
der quite frequently and believed it was highly likely that a serious crime could occur in the
hot spots. This may have been influenced by high profile crime events in the neighborhood
in 2020.
• Social cohesion is fairly high among survey respondents this year, but most do not think that
people are willing to intervene in neighborhood problems.
• Satisfaction with police is low, and survey respondents report low levels of police visibility
in the neighborhood. As noted above, this may reflect the events of 2020 both locally and
nationally, as police brutality and the relationship between police and communities of color
returned to the national spotlight.
Recommendations for 2020
It is not surprising that interventions intended to create sustainable change at long-term hot spots
of crime can take many years to work. However, the advantage of regular data analysis and eval-
uation is the ability to catch potential problems early and make course corrections. It is important
to note that the ongoing COVID-19 pandemic also affects both the implementation of ABSPY in-
terventions and our ability to evaluate their impact. However, our analysis this year suggests the
following focus areas for 2021:
• Continue to mobilize the Core Team and ABSPY resources to support the Rainier Beach
community through continued public health and violence emergencies, including discus-
sion and planning for what the role of the Core Team should be in the long-term.
• Explore how to re-engage the community and increase representation, particularly
among youth, in the continued development and evolution of ABSPY interventions and
data collection and evaluation efforts.
• Explore the differential impacts of interventions at the hot spots to understand small
changes in trends over time and possible reporting effects.
viiRainier Beach: A Beautiful Safe Place for Youth 2020 Update
1 Background
This report updates the original Rainier Beach: A Beautiful Safe Place for Youth (ABSPY) Final Evaluation
Report (Gill et al., 2016) and subsequent evaluation updates (Gill et al., 2018; Gill & Prince, 2020; Gill &
Vitter, 2017) with new findings from our crime analysis and community survey (modified due to COVID-
19) in 2020. ABSPY is a community-led, place-based, data-driven, non-arrest based collaboration
focused on preventing crime in five juvenile and youth crime hot spots in the Rainier Beach neighbor-
hood of Seattle (see Figure 1). ABSPY builds on several neighborhood and City processes, including the
2011 Rainier Beach Neighborhood Plan Update (RBNPU) and the Seattle Youth Violence Prevention Ini-
tiative, and is grounded in research evidence showing that crime—especially crime involving juveniles
and youth1 —is highly concentrated at small places (e.g. Weisburd, 2015; Weisburd et al., 2004; Weis-
burd et al., 2009). This evidence indicates that policing and crime prevention efforts focused at these hot
spots are effective (Braga et al., 2014; Lum et al., 2011; Weisburd & Majmundar, 2018). However, proactive
policing approaches that focus on law enforcement strategies such as crackdowns and “busts” to clear
offenders from high-crime areas may not be suitable at hot spots of youth crime, since young people who
are arrested and processed through the juvenile justice system—especially those involved in less serious
crimes—are more likely to reoffend than those who are diverted. Research suggests that community-led,
non-arrest strategies may be more appropriate at such places.
Figure 1: Rainier Beach hot spots identified for ABSPY intervention
1
ABSPY defines “youth” as individuals aged 25 and under. While the juvenile justice system focuses on young people under the
age of 18, ABSPY builds on increasing recognition by researchers and policy makers that the brain does not fully develop until
around age 25, directly impacting decision-making and risky behavior (e.g. Steinberg, 2008).
1Rainier Beach: A Beautiful Safe Place for Youth 2020 Update
The RBNPU explicitly called for a community-led hot spots approach to address crime and improve neigh-
borhood safety in Rainier Beach, which led to the development of ABSPY. The planning process began
in 2012 with the development of a successful $1 million grant proposal to the U.S. Department of Jus-
tice, Bureau of Justice Assistance’s Byrne Criminal Justice Innovation Program (renamed “Innovations in
Community Based Crime Reduction” in 2017). Implementation began in October 2013 with a problem-
solving process undertaken by Community Task Force (CTF) teams representing each of the five hot spots,
and the subsequent development and implementation of a suite of signature interventions (see below).
Federal funding continued through September 2016. Beginning in January 2016, the City of Seattle’s Hu-
man Services Department also began to fund implementation and evaluation on an annual basis. In 2019
ABSPY received funding through 2020 from the city’s Department of Neighborhoods. ABSPY planning
and implementation is overseen by a cross-sector Core Team and supported by a range of community
intervention partners. A detailed description of ABSPY’s history, including key partners, hot spot identi-
fication process, problem-solving process, and intervention development, can be found in the original
evaluation report (Gill et al., 2016).
2 2020 Intervention Update
Our 2017 evaluation update shows the timeline of ABSPY interventions from October 2013, the beginning
of the planning phase, to October 2017 (Gill & Vitter, 2017, p. 3). The interventions continued through
the last few months of 2017 and were consistently implemented through 2018 and 2019. Due to the
COVID-19 pandemic beginning in early 2020, some ABSPY interventions have been temporarily paused,
while others have continued in a modified capacity (for example, virtual Peace Circles). However, the
ABSPY Core Team has continued to meet virtually and spent considerable time in 2020 working to sup-
port the Rainier Beach community through the pandemic, policing protests that occurred in the summer,
and high-profile shootings that occurred in the neighborhood. For example, Core Team members have
coordinated community healing spaces to respond to local and national events and helped provide in-
formation to residents about access to COVID testing, food support, and so on. Overall, the pandemic
led to continued conversations among the Core Team about its role in crisis response and long-term
community support in Rainier Beach.
2.1 Intervention summary
2.1.1 Coordination and planning
Although the COVID-19 pandemic significantly impacted ABSPY’s primary role, which is to bring people
together within and around physical space, the Core Team continued to meet virtually throughout the
year and think creatively about how to adapt to the “new normal” of the pandemic in both the short- and
longer-term. Specific highlights, activities, and challenges throughout the year included:
• Transitions within the team. There were a number of transitions in and out of the Core Team in
2020, including people in key roles. Hana Mohamed, the NIJ grant project manager at the Office
of City Auditor (OCA) left the team at the beginning of the year and was replaced by IB Osuntoki.
Danielle Jackson, Rashad Barber and Gabbie Price from RBAC joined the team, with Danielle taking
on the role of CW-PBIS coordinator from Mahogany Villars, who also left. ABSPY coordinator Jenny
2Rainier Beach: A Beautiful Safe Place for Youth 2020 Update
Frankl left at the end of May, and hiring for her replacement continued throughout the summer,
with Cathie Wilmore joining the team in the fall. Finally, ABSPY funding and formal administration
is transitioning from the Human Services Division to the Department of Neighborhoods (DON) be-
ginning with 2021 contracts. Waing Waing and Jenn Brandon from DON regularly attend Core
Team meetings to support the team through this process.
• Team-building. Core Team meetings have been virtual since March, but the team has adapted
well to the change. In June the team participated in a retreat with Dr. Jabali Stewart and his or-
ganization Huayruro. The retreat was successful and focused on discussions about what comes
next for ABSPY, particularly given the climate of the pandemic (and the injustices it highlighted)
and concerns about policing both locally and nationally. A key theme from the retreat was ABSPY’s
own accountability, and participants discussed the voting policy, addressing power imbalances
between institutions and individuals, improving clarity around the structure and decision-making
processes within the group, and the importance of developing and maintaining effective commu-
nication practices within a decentralized system. The lack of youth participation was also high-
lighted once again, and ideas for addressing this issue included developing a youth action team
to serve in an advisory capacity. During 2020 another key conversation within the Core Team was
how to continue ABSPY’s efforts without inadvertently contributing to gentrification and displace-
ment of existing residents. OCA led a literature review and report on gentrification to increase the
team’s understanding of these issues for continued awareness and advocacy.
• Community advocacy and outreach. The COVID-19 pandemic and gun violence in the neigh-
borhood over the summer presented a number of opportunities for the ABSPY interventions to
pivot to helping community members facing unprecedented levels of need throughout the year.
Specific examples of ABSPY’s community outreach and advocacy in 2020 include:
– Supporting construction and improvement efforts at Be’er Sheva Park that were planned prior
to the pandemic, including successfully lobbying for the grass to be cut after maintenance
slowed during lockdown.
– ABSPY funds were used in March and April to cover lunches, cleaning, and sanitation supplies
at the Boys and Girls Clubs of Rainier Vista and Skyway. The BGC was one of the few organi-
zations that stayed open to provide childcare, activities, and support for young people and
their families in the community during lockdown. Two hundred and fifty families were served
by the Rainier Vista network.
– RBAC set up a COVID-19 hotline for the community to coordinate information sharing and
outreach. Key needs identified by the community included groceries, deliveries and pickup,
hand sanitizer, and information. RBAC staff also made hand sanitizer to distribute to health
centers and families in the community.
– Several Core Team meetings were dedicated to discussing how ABPSY interventions could be
adapted to the virtual space or modified to better address emerging community needs.
– Core Team members conducted and facilitated community outreach and consultation, in col-
laboration with the Department of Neighborhoods and Lake Washington Apartments, after a
public COVID-19 testing site was proposed at the Atlantic Street boat ramp without commu-
nity consultation. As a result of this outreach, the site was moved to the Rainier Beach High
School parking lot and Core Team members worked to provide information to the community
3Rainier Beach: A Beautiful Safe Place for Youth 2020 Update
about the site.
– ABSPY members engaged in outreach and convened regular community healing spaces after
several high-profile crimes in the neighborhood in the summer, including the murder of a
local teenager on Mother’s Day.
2.1.2 Safe Passage/Campus Safety Initiative
Safe Passage is one of the flagship initiatives of ABSPY. Overseen by the Boys and Girls Club of King
County, Safe Passage provides supervision, guardianship, and a friendly face on the streets in the af-
ternoons (between 1 and 6pm) when children are leaving schools on the Rainier and Henderson campus
and the risk of youth crime at this hot spot is highest. Safe Passage staff work for the Boys and Girls Club
and are community members who have grown up in the neighborhood. They are easily recognizable by
their bright blue jackets or t-shirts with the “Be Safe” slogan, which (along with “Be Safe Bro!”) has become
a popular greeting between the Safe Passage team and local young people. While Safe Passage staff are
authorized to break up fights, they primarily focus on providing a positive presence and engaging young
people as they walk home or head to the bus stop.
As Seattle Public Schools were closed for much of 2020, Safe Passage could not continue in its normal
format this year. However, the team still conducted regular monitoring of the safety zones, created sig-
nage and surveys, increased focus on case management and supporting vulnerable families, delivering
food and supplies, and supporting activities at the Boys and Girls Club.
2.1.3 Corner Greeters
The Corner Greeters initiative, overseen by the Rainier Beach Action Coalition (RBAC), consists of positive
community messaging, mobilization, and outreach; pop-up events and activities such as music, dancing,
crafts, and other fun and culturally-relevant activities at the hot spots; and community data collection.
The goal of the Corner Greeters is to “take back” hot spot spaces for the community and build collective
efficacy and empowerment among residents. The key feature of the Corner Greeters is that the events
are completely youth-led. Young people from the neighborhood collaborate with RBAC to plan different
activities and staff the events. They are also trained to communicate and share ABSPY data and infor-
mation, such as neighborhood crime data reports, with visitors to their events to connect community
members to ABSPY, build collective efficacy, and empower them to take action in the neighborhood.
RBAC is also responsible for the Mobile Discovery Center, a unique community information booth on
wheels that sets up at Corner Greeter and other neighborhood events. The Corner Greeters also conduct
their own surveys regularly at the Rainier Beach hot spots to track community perceptions of safety and
collective efficacy at the hot spots, and support ABSPY at community events.
In 2020 RBAC announced an expansion to the Corner Greeters program, supported by $100,000 from
the Youth Consortium of the City Council, to develop YATTA (Young Adults Transitioning to Adulthood)
Rising, a program for young people aged 15-24 who may be at risk of negative contact with the police.
YATTAs coordinate Corner Greeter activities, such as clean-ups, surveys, documenting positive activities
on social media, planting bulbs, and using the city’s Find it, Fix it app. YATTA Rising also incorporates
a systems change effort in which young people become advocates for police reform. As documented
4Rainier Beach: A Beautiful Safe Place for Youth 2020 Update
above, RBAC and the Corner Greeters team was able to continue with a number of community support
and outreach activities, as well as virtual meetings and social media campaigns, during the pandemic.
2.1.4 Business and community engagement
2020 has been a challenging year for Seattle Police Department, given the pandemic, large numbers of
resignations from the department (including Chief Best in August), and the summer protests. In addition,
since many businesses were closed or operating with limited capacity during the pandemic, business
and community engagement activities have been difficult. However, SPD continued to plan Cops and
Cones events at Lake Washington, and worked with Dr. Jabali Stewart to design and implement police-
community healing circles. The department also worked to identify new officers to regularly participate
in ABSPY meetings and activities. During the summer months, outdoor hot spot activation activities that
could still be carried out with safety measures such as social distancing in place continued in Rainier
Beach.
2.1.5 Crime Prevention Through Environmental Design (CPTED)
Early in 2020 it became clear that while ABSPY has done a lot of CPTED activities over the years, many of
the efforts were not well-known or publicized, even within the Core Team. At the February Core Team
meeting Jenny Frankl gave a presentation highlighting these efforts. It was proposed that signs should be
created saying “this project was done in partnership with ABSPY,” although due to the pandemic this idea
has not yet moved forward. As part of its overall environmental efforts the ABSPY Core Team approved
additional funding for the Clean Crew in 2020, subject to improvements to its supervision and referral
procedures. Challenges to continued CPTED implementation during the pandemic included the need for
social distancing and limited access to supplies, volunteers, and businesses. However, the team helped
to purchase and distribute cleaning supplies and continued checking for and reporting graffiti.
2.1.6 Positive Behavioral Interventions and Supports (PBIS) and restorative practices
The NIJ Workgroup of the Core Team continued to meet regularly in 2020 to implement community-
wide PBIS and restorative practices under a grant from the National Institute of Justice. While schools
were closed most of the year due to COVID, Seattle Public Schools worked with teachers and parents to
bring PBIS principles to the online space. SPS also worked to revise the Tiered Fidelity Inventory, the key
implementation data collection tool for PBIS, to align it with racial and social justice principles. Virtual
peace circles, and some in-person circles, were held at the Boys and Girls Club and provided important
opportunities for young people to process the trauma and challenges of the year’s events.
3 2020 Evaluation Update: Summary of Methods
A detailed description of the data and methods used for this evaluation can be found in the original
evaluation report and the 2017 update. In this section we summarize the most important aspects of our
5Rainier Beach: A Beautiful Safe Place for Youth 2020 Update
approach and the updates we made in 2020. Our 2020 evaluation is based on monthly police data on
calls for service and recorded offenses and incidents from January 2011 to August 2020, provided by SPD,
and a modified community survey conducted online in December 2020. Our analytic approach matches
each Rainier Beach hot spot with a comparison location elsewhere in SPD’s South Precinct, which is simi-
lar in terms of crime rates and characteristics such as land use, presence of schools, access to public transit
etc. Further details about the selection of the hot spots and comparison sites and information about the
police data are available in our original report. It is important to note that while we include the originally
selected comparison sites because analytic models need to match the research design, significant gen-
trification and population change in Southeast Seattle have changed some of our matched comparison
spots considerably and they now look very different compared to when they were first identified in 2012.
This may affect the conclusions of the research. It is also very important to note that crime rates are likely
to have been significantly impacted by the pandemic, protests, and disruption to police services in 2020.
We do not yet know exactly what the impact of these events have been on crime rates nationwide or in
Seattle.
To make this report easier to read, all of the tables and most graphs are included in the Statistical Ap-
pendix at the end of this report. You can look at any of the tables or graphs in more detail in the electronic
version of this report by clicking on the blue number next to each reference to a table or figure (e.g. Table
A1—click the blue “A1” link to see the table).
3.1 Police crime data definitions
We use the following information from official police data provided to us by SPD in our analyses. Each
measure of crime data can tell us different information about how ABSPY is working. Note that we are not
allowed to report the numbers of certain offense types, including homicide, rape, and domestic incidents.
These offenses are included in our statistical models because specific numbers cannot be identified, but
they are not included when we report the numbers of certain offenses.
1. Calls for police service. “Calls for service” include both 911 calls from the public to the police, and
the logs that police record (usually on their in-car computers) while they are out on patrol. Calls
for service tell us what people in the neighborhood are concerned about, what they are willing to
call the police about (which may indicate how much they trust the police), and what the police
see or hear about while they are in the neighborhood. But calls for service don’t tell us the “true”
picture of crime. Sometimes the person calling 911 doesn’t know exactly what they are seeing or
hearing, but when the police arrive they can determine what type of crime has been committed and
record this in their report (see below). Multiple people might call 911 about the same problem, like
hearing shots being fired. And sometimes, even if a person was worried about an issue and called
the police, it might turn out that no crime has been committed or the police can’t find whatever
was going on. Calls for service also don’t tell us who was involved in a crime (e.g. the age, gender,
or race of a suspect or victim). This information is verified by police at the scene and included in
the report.
2. Police reports (offenses). Police write reports when they respond to a call or see something while
on patrol and have reason to believe that a crime may have occurred (such as a victim or witness
willing to make a report). Although not every call for service turns into a report, the reports give
us a better idea of what happened and who was involved. However, police can decide whether or
not to take a report, and sometimes victims don’t want the police to take a formal report, so not all
6Rainier Beach: A Beautiful Safe Place for Youth 2020 Update
crimes make it into the data. Data on offenses and incidents reported by police are stored in the
new NIBRS-compliant system described above. This overall category of police reports includes the
juvenile/youth, violent, and minor crime incidents described in points 3-5 below.
3. Juvenile/youth crime reports. Because ABSPY is focused on creating a “beautiful safe place for
youth,” we also analyze reports of offenses that involve young people (under 18 and age 18-25).
4. Violent crime reports. ABSPY is also focused on violence prevention, so we look at the effects of
the interventions on violent offenses. We define “violent offenses” as murder and non-negligent
manslaughter; aggravated assault; robbery; rape; and simple assault.2
5. Group A person offenses. NIBRS Group A offenses are the most serious or violent offenses. They
are similar to Part I offenses in the older Uniform Crime Reporting (UCR) system, but more offense
types are included. Group A person offenses include the violent incident types described above
and certain other offenses against the person such as intimidation and kidnapping. To create this
category, we selected all offenses that were categorized as both Group A and Person Offenses. A
full list of NIBRS offense definitions is available here.
6. Group A property offenses. Similar to the Group A person offense category, Group A property
offenses include the more serious property offenses. These include crimes like arson, burglary,
larceny/theft (including motor vehicle theft), property damage, and so on. To create this category,
we selected all offenses that were categorized as both Group A and Property Offenses.
7. Group B offenses. NIBRS Group B offenses are typically minor crimes, including things like disor-
derly conduct, drunkenness, non-violent family offenses, and liquor law violations. It is useful to
look at these less serious crimes because if they increase it may suggest that community members
are more likely to call the police and feel more empowered to take action against minor quality of
life issues.
3.2 Community survey
Due to COVID-19 we were unable to safely conduct our usual in-person community survey in the five
Rainier Beach and five comparison hot spots this year. Ultimately, in December 2020 we collaborated
with RBAC to conduct an online community survey of the approximately 800 members of RBAC’s mailing
list. The survey was anonymous so we do not know exactly how members of the mailing list are con-
nected to the five hot spots, but given RBAC’s location and mission it is reasonable to assume that most
members have a strong connection to the neighborhood (almost everyone who responded to the sur-
vey said that they lived or worked in Rainier Beach). The online survey was very similar to the in-person
survey instrument we used in 2019, but we included a question at the beginning asking participants to
identify which of the five hot spots they spend the most time in when they are in Rainier Beach because
we could not be physically present in the hot spots. Participants were asked to choose one of the five
locations from a map similar to the one on page 1.
Unfortunately we received very few survey responses, given the size of the mailing list. Only 19 people
fully completed the survey. This is likely due to the time of year (mid-December), the possibility that many
people may not fully read mailing list emails, and the length of the survey—although only four people
2
We are not permitted to report homicide and rape offenses separately.
7Rainier Beach: A Beautiful Safe Place for Youth 2020 Update
started the survey and then failed to complete it. As a result, while the survey questions were the same
we do not have sufficient data to conduct a full statistical analysis incorporating all six survey waves as
we have done in prior years. It is also likely that the people who did respond are different to those we
usually encounter on the street, because they have chosen to actively engage with RBAC (for example,
this suggests they will be more likely to be aware of ABSPY interventions—especially those led by RBAC,
like the Corner Greeters). Finally, because the comparison hot spots are outside Rainier Beach and not
all in the same neighborhood, we did not have any means of online access to residents of those areas to
collect comparison data. Therefore, the results we present below are simply descriptive, although we do
note similarities and differences between findings from previous years.
The characteristics of the 2020 survey respondents also differed substantially from respondents in Rainier
Beach and the comparison sites in previous years. They were much more likely to be female (76.4%, com-
pared to about half of the sample in previous years) and older (about three-quarters were aged between
26 and 55, while in previous years about half of respondents were under 35). Respondents were also
much more likely to be White (42.1%, compared to less than one-quarter in previous years). All partic-
ipants were born in the United States compared to less than two-thirds in previous years, and about
three-quarters had children of any age, compared to about half in previous years. The 2020 respondents
were highly educated, with 63% holding a Masters, graduate, or professional degree compared to around
10% in previous years. About 90% of the sample were employed full- or part-time, compared to about
60-75% in previous years, and only two respondents were attending school. Finally, respondents in 2020
were somewhat more likely to report “I live here” as the main activity they did in Rainier Beach (68.4%
compared to fewer than half in previous years who said they lived at the hot spot in question). When
asked which of the five Rainier Beach hot spots they spent the most time in, the majority of 2020 respon-
dents (43.8%) said Safeway, followed by Rainier and Henderson (25%), Light Rail and Lake Washington
(12.5% each), and Rose Street (6.3%). Due to the small number of respondents we present combined
survey results across all five hot spots in this report.
3.3 Analytic strategy
We updated our analytic strategy for the crime data in 2020 to account for advances in statistical methods
and to better align with our original research design. Specifically, we now analyze the effects of ABSPY
on police incidents and calls for service using random effects negative binomial regression, which allows
us to better account for the structure of the underlying data and the clustering of crime within each indi-
vidual hot spot. Our new models also control for autocorrelation—the relationship that naturally occurs
between one month’s crime rate and the next month’s regardless of the intervention. Finally, instead of
combining all the interventions in the model, we include a series of interaction terms between each indi-
vidual intervention—Corner Greeters, Safe Passage, business engagement, CPTED, and PBIS/restorative
practices—to better account for the variation in the use of each intervention by hot spot and the specific
months when each of the initiatives were active or inactive at each location. As before, we also control
for seasonal and overall crime rates in the models. The updated timeframe for the police data analysis
is January 2011 to August 2020 (116 months).3 We also present descriptive graphs showing offense in
each hot spot and across all five Rainier Beach hot spots from September 2011 to August 2019, and the
percentage change in each crime outcome pre- and post-May 2014 (when the first interventions were
rolled out) in each hot spot relative to its comparison site, the overall Rainier Beach neighborhood, and
the South Precinct overall. These descriptive graphs complement the statistical analysis and are easy to
3
Refer to the 2017 Evaluation Update for a table showing pre-intervention monthly average numbers for each crime outcome.
8Rainier Beach: A Beautiful Safe Place for Youth 2020 Update
read and interpret.
As in previous reports, we also calculated the crime inflation factor, which is the ratio of calls to offenses
in the pre-intervention and during-intervention periods (Weisburd et al., 2020). The crime inflation factor
assesses whether higher numbers of offenses can be attributed to increased calls to the police (reflecting
improved collective efficacy and trust in police among residents) rather than ABSPY failing to work or
even “backfiring.” This is an important potential source of bias in analyzing the effects of interventions
that aim to decrease crime but increase citizen engagement with crime prevention (which can result
in more calls to the police). We calculated the inflation factor for both the treatment and comparison
hot spots and adjusted the number of incidents in the treatment spots by the difference between the
treatment and comparison group inflation factors.
As noted above, we did not conduct any statistical analysis on the 2020 crime data, because the numbers
are so low and the respondents are very different from those in previous waves so we cannot compare
the results to previous years. We provide a narrative report on the survey results, and tables or graphs
where appropriate.
4 Updated Evaluation Findings
4.1 Crime is still trending down in most of the hot spots, but some positive trends from last year have
reversed
Figure 3 shows a small but steady downward trend in the number of offenses and incidents involving
youth between September 2011 and August 2020. Youth offenses and incidents have decreased every
year since 2015-16, around the time that all ABSPY interventions were fully under way, and offenses in-
volving adults age 26 and over also decreased between 2019 and 2020, although it is important to note
that the COVID-19 pandemic may affect these results. Figure 2 shows that there was a substantial spike
in offenses involving adults in the South Precinct in May 2020. This spike, which is seen across the entire
city, is entirely driven by identity theft incidents and is related to a major statewide unemployment scam
that was discovered that month.4 SPD informed us that there was a substantial increase in citywide re-
porting of fraudulent unemployment benefit filings that month. However, there was no corresponding
spike in offenses involving youth and the steady decrease in youth offenses in the Rainier Beach hot spots
seems to track with previous years.5
A descriptive analysis of the period pre- and post-May 2014, when ABSPY interventions first began, shows
only a minimal decrease in calls for service or overall offenses in the Rainier Beach hot spots relative to
the comparison spots, the Rainier Beach neighborhood (excluding the hot spots) or the South Precinct
(Figures A1-A2). However, offenses involving youth are 26% lower than the pre-ABSPY period (Figure A3),
compared to 19% lower last year. While the decrease in youth offenses was slightly greater in the com-
parison spots, the decrease in the Rainier Beach hot spots is on par with the rest of the neighborhood and
4
’Washington state raises its estimate for number of fraudulent unemployment claims by
41%,’ Seattle Times, December 17, 2020. https://www.seattletimes.com/business/economy/
estimated-number-of-fraudulent-jobless-claims-jumps-41-in-washington-state/.
5
We reran all of the models and analyses in this report that may have been affected by the spike—all offenses, youth offenses,
and Part A property offenses—with the identity theft cases excluded to check whether it affected the results, but there were
no substantial changes. The analyses reported here include the identity theft cases. Calls for service, violent offenses, Part A
person offenses, and Part B offenses are not affected by the spike.
9Rainier Beach: A Beautiful Safe Place for Youth 2020 Update
Figure 2: Monthly youth and adult offense counts in the South Precinct, September 2011-August 2020
the South Precinct overall. Violent offenses were also 14% lower in the hot spots, compared to 7% in the
South Precinct overall (Figure A4). There was little change in NIBRS Group A person or property offenses
(Figures A5-A6); however, NIBRS Group B offenses were 10% higher in the hot spots post-ABSPY last year
but have not changed from pre-2014 levels when this year’s data is added. Part B offenses continue to
decrease substantially elsewhere in Rainier Beach and the South Precinct (Figure A7).
Figure 3: Offenses and incidents in all Rainier Beach hot spots, September 2011-August 2020
10Rainier Beach: A Beautiful Safe Place for Youth 2020 Update
As we have seen in prior years, crime problems at Rose Street have largely been driven by adults in recent
years, and there was an uptick in offenses in 2019-20 compared with the previous period. There was a
small uptick in youth offenses as well this year after several years of steady decreases, but the numbers
are very small (Figure 4). Last year we suggested that Rose Street may no longer be a hot spot of youth
crime because only five publicly-reportable youth offenses occurred there, but the uptick this year, while
small, should be monitored. Calls for service were 25% lower than the pre-ABSPY period (Figure A8), the
same as last year, although they were 52% lower in Rose Street’s comparison spot, and offenses were
28% lower (also the same as last year) compared to 30% in the comparison spot (Figure A9). Offenses
involving youth were 47% lower compared to 23% in the comparison spot (Figure A10). Violent, Group
A, and Group B offenses were also substantially lower, but Part A property offenses were 2% higher than
pre-ABSPY. This is likely because most of the crime opportunities at Rose Street are property-related, i.e.
business and retail. However, the changes are very small (Figures A11-A14).
Figure 4: Offenses and incidents at Rose Street, September 2011-August 2020
After seeing a slight uptick in both youth and adult crime at Rainier and Henderson last year, crime fell
sharply again in 2019-20 (Figure 5). It is important to consider that this hot spot has a number of schools
and other locations that attract young people, such as the community center. These venues were closed
for most of 2020, so the routine activities of people at this location are likely to be very different. Nonethe-
less, Rainier and Henderson continues to show promising trends. Calls for service are 22% lower than
pre-ABSPY, compared to just 8% lower in the comparison site (Figure A15), and while all incidents are
only 3% lower, they were 9% higher in the comparison site (Figure A16). Last year youth offenses were
higher than pre-ABPSY levels, but this has balanced out again—they are 5% lower at Rainier and Hen-
derson with the most recent data included (Figure A17). Encouragingly, violent offenses remain much
lower than pre-ABSPY levels at Rainier and Henderson and relative to the change at the comparison site:
22% lower at the hot spot, compared to 5% higher in the comparison area (Figure A18). Part A person
offenses, which include violent offenses, were also 7% lower at Rainier and Henderson, but 23% higher
in the comparison spot ((Figure A19). Part A property offenses were 6% lower than pre-ABSPY levels,
although they were 21% lower in the comparison area (Figure A20). While Group B offenses were 8%
higher at Rainier and Henderson, they were 66% higher in the comparison site (Figure A21). It is worth
11You can also read