Probabilistic QPF & Impactbased Forecasting / Warning - WC Woo, Hong Kong Observatory Typhoon Committee Roving Seminar 2019 Beijing, China 12 ...
←
→
Page content transcription
If your browser does not render page correctly, please read the page content below
Probabilistic QPF & Impact-
based Forecasting / Warning
         WC Woo, Hong Kong Observatory
     Typhoon Committee Roving Seminar 2019
                  Beijing, China
               12 November 2019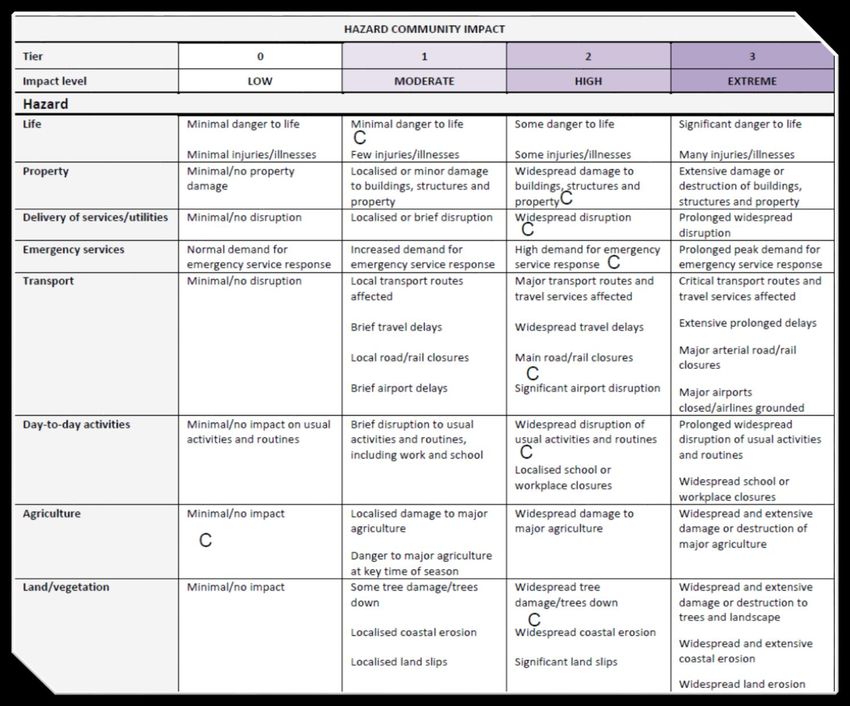
Quantitative Precipitation
Forecast (QPF)
Principle of Radar-based Rainfall Nowcast
           3:00pm            3:06pm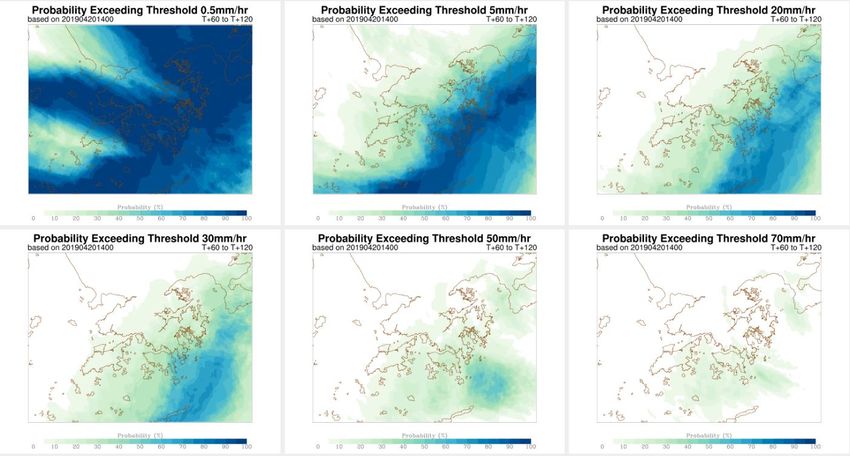
Generation of Motion Field
    Consecutive Radar Images
                               Motion Field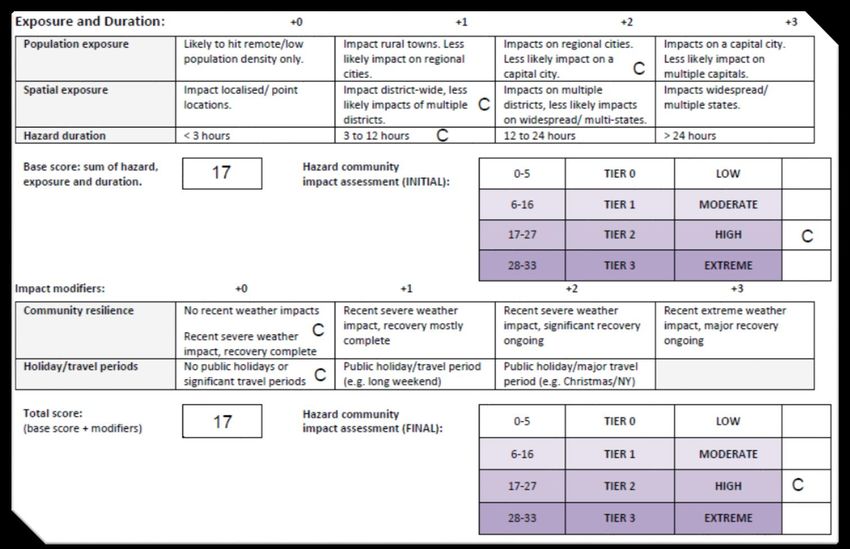
Rainfall Nowcast by Extrapolation
     Analysis           1 Hour Forecast
Radar Echo Tracking
• Correlation-based
   • TREC / Co-TREC / MTREC
• Variational Optical Flow
   • MOVA / ROVER
• Deep Learning
   • ConvLSTM / ConvGRU / TrajGRU
• References:
   • Operational Application of Optical Flow Techniques to Radar-Based Rainfall
     Nowcasting (Link)
   • Deep Learning for Precipitation Nowcasting: A Benchmark and A New Model
     (Link)
Variational Optical Flow
• “ROVER“ - Real-time Optical-flow by Variational method for Echoes of
  Radar –
   • Enhance Radar images
   • Derive Motion Field based on the “VarFlow” algorithm developed by Bruhn et
     al. (2003 & 2005)
Enhancing Radar Images
250 53 559
55 6
54 60
5
78
51
50 52
47 49
48
46
• Bowler et al. (2004): Radar or rain rate
45
44
43
42
gray(dBZ) 41
40
field is typically noisy and pre- 200
gray(Z)
gray(R200,1.6) 37
39
38
smoothing is needed for a stable gray(R230,1.46) 36
calculation of the partial derivatives. gray(rootZ)
gray(atanZ)
35
34
• Highlight echoes from the convective
150
33
Gray level
regime with high dBZ values and play 32
down echoes with intensity of less 100
31
interest. 30
29
50 28
27
26
25
24
23
22
21
20
17 19
18
13 15
14 16
1 12
6 7 8 9 10
0 01 23 4 5
0 5 10 15 20 25 30 35 40 45 50 55 60
dBZ
Enhancement of Radar Images
OPTICAL FLOW
• Assumption:
I I I
+u +v = 0
t x y
• Variational FormulationFORMULATION BY BRUHN ET AL 2003
I x ( q) u + I y ( q ) v = − I t ( q ) where q
Adopting a least-square principle and applying weights to different
points in the neighbourhood through Gaussian convolution, it can be
solved with the following solution, where the operator ∗ denotes
convolution and Kρ a Gaussian kernel with standard deviation ρ.
Compared with
the global variational methods
−1
u K (I x I x ) K (I x I y ) −K (I x It )
v = K (I I ) K (I I ) −K (I I )
y x y y y t
J HS = u + v dxdy (HS81)
2 2
Local Scheme + Global SchemeFORMULATION BY BRUHN ET AL 2003 Bi-directional with errors at all coarser levels of the grid hierarchy corrected before going down to the next finer level.
Motion Field - Product of ROVER
(Radar Echo Tracking)
Forecast by Extrapolation
• Semi-Lagrangian Advection dZ Z
= +u
Z
=0
dt t x
(SLA)
• Robert scheme (3 iterations
to find origin point)
• Bi-cubic interpolation
• Flux limiter
(local max, min constraint)
Semi-Lagrangian
• One-way nesting
Advection
• resolution 1.1 km -> 0.5 km
?
linear
extrapolationSWIRLS SLA Examples
• circulation pattern preserved →
• numerically less dissipative
Forecast reflectivity – pure rotation
Up to 6 hr (6-min interval)
TREC wind Forecast reflectivity – TREC wind
Up to 6 hr (6-min interval)Probabilistic QPF
Why?
1. Better support for Rainfall Warning System
2. Facilitate cost-benefit analyses
3. More tailored to the needs of organizations under various
   operational constraints
SWIRLS Ensemble Rainfall Nowcast
• By tuning the 6 parameters, 36
  sets of parameters have been
  experimented, i.e. ensemble of
  36 members.
Parameter Tuning & Ensemble
ROVER depends on tunable parameters:
Parameter Significance Value adopted
in ROVER
σ Gaussian convolution for image smoothing 9
ρ Gaussian convolution for local vector 1.5
field smoothing
α Regularization parameters in the energy function 2000
Lf the finest spatial scale 1
Lc the coarsest spatial scale 7
Tr the time interval for tracking radar echoes 6
SERN
SWIRLS
Ensemble
Rainfall
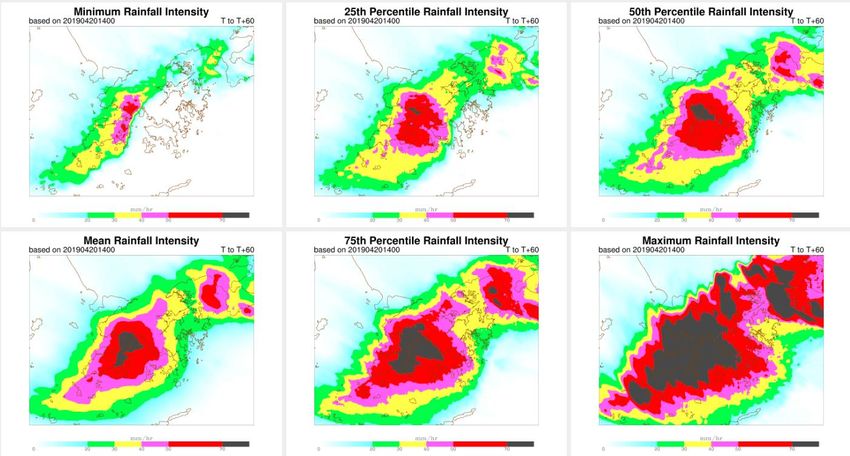
NowcastProbabilistic QPF (PQPF)
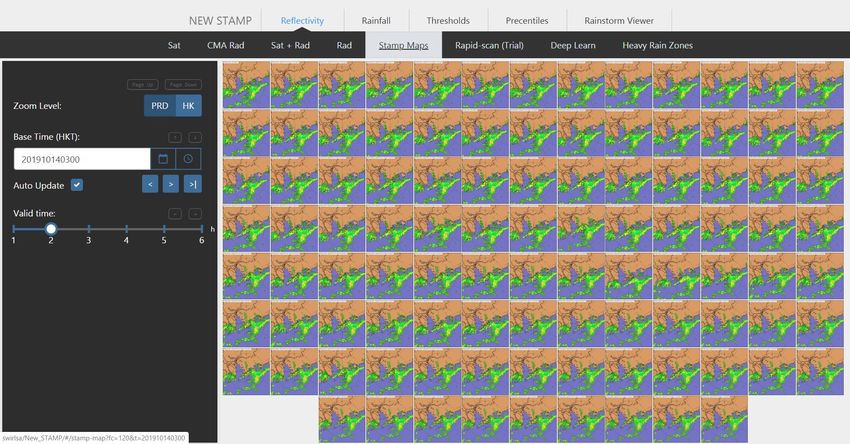
Stamp Map
PQPF Product 1
Rainfall Intensity Contour Map
• For Specific Exceedance Probability:
Rainfall Intensity at Fixed Percentile
PQPF Product 2
Probability Contour Map
• For Specific Intensity Threshold

                       Probabilistic quantitative precipitation forecasts
                                  For tropical cyclone rainfall
Probability of Exceeding Fixed Intensity
Verification and Analyses

      Verified against Radar QPE data:

                                         480
         • resolution 480X480 pixels
         • Generated every 6 minutes

                                                        480
                                               One datum for each grid
Verification and Analyses
Verification and Analyses
Probability in Time Series
Impact-based Forecasting /
Warning
Status of IBFWS Implementation
• IBFWS implemented / being implemented
  • e.g. UK, Australia, France, Canada, Korea

• Developing from other IBFWS
  • Mongolia from MeteoAlarm, Indonesia from WRN of NWS

• Hazard/weather oriented early warnings
  • Japan, China, Hong Kong

• Direct impact forecast/warning
  • UK, Japan, Korea (developing)

                                                          31
UKMO
• Direct impact forecasting
developed for some impacts,
e.g. flooding, vehicle
overturning (due to high
winds), …
• Emergency responders defined
the levels of impact
• Forecasters to provide an
expected level of impact and a
likelihood of this impact (on a
subjective basis)
• Thresholds are no longer used
to trigger warnings (but may
form part of the decision
process)BoM - Australia
BoM Example

              34
BoM Example – Risk Assessment Process
Community
Impact and Risk
Assessment
35BoM Example
36BoM Example
37Meteo-France : Vigilance EWS
• Does not rely on risk-
matrix
• Still uses thresholds:
• dependent on local
climatology
• regularly reviewedMet Service Canada
Attempted to improve
over UK’s version to cater
for low-prob high-impact
events
Risk matrix varied for
different extreme events
based on EFI:
Seasonal
➔ unseasonal
➔ exceptional
39KMA
• Axes swapped
• Colour gradient
• Diagonal symmetric
• with 5 x 5 tiles
• Non-linear scale
• Likelihood
= impacted days/(365 x 12 yrs)BMKG - Indonesia
Detailed
description
of weather
impact
Risk levels
ordered by
numbers
N.B. Numerical levels to supplement risk colours
Response
41Public Product - BMKG Example
• Colour coded risk
maps to indicate
“hot spots”
• CAP messages for
more specific uses
• Road map:
• Pilot operation in
2019, with CAP
• National
implementation by
2021
()An Example of TC Impact Study
DATA COLLECTION – impact data

Source of Impact data:
                                              REPORT ON DAMAGE CAUSED BY CYCLONES, FLOODS AND DROUGHT
                                              (This report should cover the total damage caused by typhoons and heavy rainfall, and associated storm-surges, floods, landslides.)

                                              Period:     from 1 JANUARY 2017 to 31 DECEMBER 2017

                                              Prepared by:       SA(D)13

• Annual damage survey conducted by HKO       Date prepared:        27 Jul 2018

                                              For consistency, please use the following where necessary:

    to government department and public
                                              …          data are not available or not separately reported
                                                         amount is negligible or nil
                                              N/A        item is not applicable

                                              I.    GENERAL                                            Sequence     1        2         3          4         5         6             7         8           9          10          11

    utilities
                                                                                                       No.
                                              1.    Type of disaster                                              Merbok   Roke     Hato      Pakhar     Mawar     TD Sep     Khanun      Rainstorm   Rainstorm   Rainstorm   Rainstorm
                                                                                                                                                                                          /Landslip   /Landslip               /Landslip
                                                    Sequence number/code name of the typhoon
                                                    and/or type of disaster caused by it or by a
                                                    combination of weather disturbances such as

• HKSAR government Press Release
                                                    rainfall, strong winds, storm-surges, floods and
                                                    landslides

                                              2.    Date of period of occurrence                                   11-13    22-23     22-23     26-27    2-4 Sep     23-24    14-16 Oct    24 May       13 Jun     17 Jun       17 Jul
                                                                                                                    Jun      Jul       Aug       Aug                  Sep
                                              3.    Name of regions/areas seriously affected

• Newspaper                                   II.

                                              4.
                                                    HUMAN DAMAGE

                                                    Dead and missing
                                                                                                       Unit

                                                                                                       persons

                                              5.    Injured                                            persons                                    1         1

                                                    6.   Homeless                                      persons                         4          8
                                                                                                       families                        1          2
                                                                    1
                                                    7.   Affected                                      persons                        148         8                                 2
                                                                                                       families                       66          2
                                                    8.   Total                                         persons                        152        17         1                       2
                                                                                                       families                       67          4

Source of Meteorological data:                1
                                                    Please specify other categories of disaster victims covered here e.g. assisted by emergency relief activities, those whose normal activities are seriously disrupted.

• Wind Speed: Maximum hourly wind and
                                              Remarks:

    max gust of the 8 reference stations for the
    issuance TC signals
• Rainfall: Rainfall recorded at Hong Kong
    Observatory Headquarters when a TC is
    within 600 km range + subsequent 72 hours
    after the TC dissipation or moving out of
    the 600 km range of HK;
                                                                                                                                                                                                                                          44
Regression analysis – methodologies
Simple and Multiple Linear Regression
- All combinations will be attempted.
- Reject the model if the variable is insignificant at 5% level
- Reject the model if R2 < 40% (i.e. less than 40% are explained)
- Select the model with the highest R2 as the ‘BEST’ model
45Regression analysis – Tropical cyclone
Name max Date start Date end Max Gust Mean (km/hr) Max Hourly Mean Wind Mean (km/hr)
MANGKHUT 10 14/09/2018 17/09/2018 159.500 86.000
VICENTE 10 21/07/2012 24/07/2012 120.875 66.625
NURI 9 20/08/2008 23/08/2008 110.625 61.000
HATO 10 22/08/2017 23/08/2017 122.250 60.250
HAGUPIT 8 22/09/2008 24/09/2008 114.625 60.125
KOPPU 8 13/09/2009 15/09/2009 106.625 59.000
MOLAVE 9 17/07/2009 19/07/2009 98.375 57.500
PAKHAR 8 26/08/2017 27/08/2017 112.000 54.750
PRAPIROON 3 01/08/2006 04/08/2006 106.333 54.000
NIDA 8 31/07/2016 02/08/2016 92.625 50.625
46Regression analysis – tropical cyclone
Impact on Life
Mangkhut
Hato
Vicente
Koppu
Pakhar Nuri
Hagupit
47Regression analysis – tropical cyclone
Impact on Utilities (adjusted based on inflation rate)
(unit: Million in US dollars, 7.8 HKD = 1 USD)
Mangkhut
Pakhar
Nida Nuri
48Regression analysis – tropical cyclone
Impact on Agriculture (Farmland, unit: Hectares)
Hato
Mangkhut
Merbok
Nida Vicente
49Regression analysis – tropical cyclone
Impact on Land/vegetation (unit: number of reports)
Sarika (20)
Fengshen (18)
Merbok (9)
Mangkhut (18)
50Regression analysis – tropical cyclone
Summary:
51SUMMARY
Statistical relationships between impacts and weather
has been analyzed with a view to develop impact-based
forecasts
Preliminary results suggested that statistical relationship
exists between maximum hourly mean wind and (1)
death and injury, (2) economic loss of utilities, (3) area of
farmland affected
52You can also read