Productivity in UK healthcare during and after the Covid-19 pandemic
←
→
Page content transcription
If your browser does not render page correctly, please read the page content below
Productivity in UK healthcare during
and after the Covid-19 pandemic
Authors:
Diane Coyle
University of Cambridge
Kaya Dreesbeimdieck
University of Cambridge
Annabel Manley
University of Cambridge

Date:
February 2021
The Productivity Institute
Working Paper No.002

 Page 1 of 39

Key words
productivity, health care, NHS

JEL codes:
JEL Codes: H51, I10, E01

Acknowledgements:
The authors are very grateful to Office for National Statistics colleagues for their help, and also to Huw
Dixon, Carol Propper, Bart van Ark and Tony Venables for their comments on an early draft. The
research is funded by the ESRC through The Productivity Institute.

Authors' contacts:
dc700@cam.ac.uk, kmd46@cam.ac.uk, am2494@cam.ac.uk

Copyright
D. Coyle, K. Dreesbeimdieck, A. Manley (2021)

Suggested citation
D. Coyle, K. Dreesbeimdieck, A. Manley (2021) Productivity in UK healthcare during and after the
Covid-19 pandemic. The Productivity Institute working paper No.002.

The Productivity Institute is an organisation that works across academia, business and policy to better
understand, measure and enable productivity across the UK. It is funded by the Economic and Social
Research Council (ESRC).
More information can be found on The Productivity Institute's temporary website. Contact us at
theproductivityinstitute@manchester.ac.uk

Publisher
The Productivity Institute, headquartered at Alliance Manchester Business School, The University of
Manchester, Booth Street West, Manchester, M15 6PB. No part of this publication may be reproduced,
stored in a retrieval system or transmitted in any form or by any means without the prior permission in
writing of the publisher nor be issued to the public or circulated in any form other than that in which it
is published. Requests for permission to reproduce any article or part of the Working Paper should be
sent to the editor at the above address.

 Page 2 of 39
Abstract

Measured health output in the UK has declined sharply during the
Covid-19 pandemic, despite the evident increase in some National
Health Service (NHS) activities such as critical care, and the new test
and trace and vaccination programmes.

We identify the measurement methods applied to public services that
explain the measured decline, and also explore the likely impact of
changes in hospital practices during the pandemic, including
increased use of technology, on healthcare productivity.

We find that within NHS England the capacity constraints have
contributed to substantial falls in non-Covid-19 health care activities,
and argue that increased capacity in the social infrastructure of the
health service is essential to enable higher productivity in an uncertain
environment.

 Page 3 of 39
1. Introduction

Tracking economic activity during the pandemic has been challenging, and nowhere more so than in the
measurement of the output and productivity of the health sector as it came under intense pressure. A sharp
fall in volume-terms public sector output, with health services making up 37.5% of total public expenditure
(and 10% of GDP in 2018), contributed to the UK’s plunge in GDP in the second quarter of 2020. This contrasted
with the profile of the public sector contribution to growth in some other European economies. This paper
explores the reasons for the sharp decline in measured UK health service output and productivity, and
considers the longer-term prospects for productivity improvements.

First, we discuss the measurement method used in the UK, explaining why the health output measure in the
national accounts declined so sharply when, after all, some health services were extremely busy. We also
discuss the implications for the quality adjustments made to derive separate UK health service productivity
measures, not at present incorporated in the output and GDP statistics.

However, the decline in health service output cannot be considered to be a statistical quirk, although its
measurement has been challenging. The pressure the crisis placed on the NHS led to significant changes in
service provision during the year and will have some lasting effects. There was a large decline in non-Covid-19
service provision of all kinds. This consequence of limited NHS capacity – due to continuing pressures over
many years to seek efficiencies and meet centrally-determined targets – raises the question of the option
value of ‘spare’ capacity and the need for insurance against future pandemics or crises.

It is also important to note that output and productivity measurement is distinct from understanding what is
happening to health outcomes and economic welfare. Health outcomes during the pandemic have been better
than they would have been had the NHS not dramatically changed its mix of activities, while the final
assessment of outcomes will bring in wider and complex considerations such as life years lost from delayed or
cancelled procedures as well as Covid-19 lives saved.

We explore the short- and long-term implications of the pandemic for health service output and productivity,
first reporting insights from qualitative interviews (conducted in November and December 2020) in two
English hospital trusts. We describe what happened in these hospitals during the pandemic and discuss which
changes they made (such as use of technology or organisational changes) might continue. These experiences
underline other evidence of underlying issues not only regarding health service productivity, but also health
outcomes relating to NHS provision. We conclude by considering the lessons of the pandemic experience for
service resilience, and the consequences for resourcing and managing the health service. We argue for
considering health services as a key component of the UK’s social infrastructure, implying a need for sufficient
additional capacity for peak loads. The emphasis on short-term cost efficiency has militated against having a
capacity margin that would have limited the output fall during the pandemic, but more importantly would also
have led to improved health outcomes compared to those the UK will experience, and thus improved
productivity potential over the longer term. For productivity to be a useful concept in the face of uncertain
future shocks, it should not ignore the expected value of output in a wide range of circumstance.

 Page 4 of 39
2. Measurement of health service output and productivity

Total expenditure on health has increased significantly during the pandemic, in the UK amounting to an
additional £50bn for the National Health Service (NHS) for Covid-19 response in 2020. However, the
measurement of public sector output including health output in volume terms, and consequently the
productivity of public services, has always been challenging because there are no market prices with which to
deflate expenditure. For many years the convention everywhere was to assume the value of outputs was the
same as the value of inputs, setting productivity growth, by definition, equal to zero. Even when all statistical
offices were using this same methodology, comparisons across countries have never been straightforward
because the mix of public and private provision differs. Even looking just at health services, these can range
from largely public in the UK through the NHS to largely private in the US. Over time, the methodological
practices have diverged too (Schreyer & Mas 2018), with the ONS having gone further than most others in
adopting direct measures of outputs for use in the national accounts, 1 and in developing quality-adjusted
output for the separate measurement of public sector productivity. Further complications arise in comparing
outcomes to outputs - for instance, public health and environmental factors as well as hospital or GP
treatments affect health outcomes. Here, we focus first on outputs, but outcomes are what matter in
contributing to the productivity of the whole economy, and we return to this in the final section.

According to the published statistics to date, public services’ contribution to GDP during 2020 plunged in the
UK, in contrast to some other European countries: Figure 1 shows the quarterly percentage changes in volume
terms final government consumption expenditure for the UK and four EU countries. The public service outputs
included in these figures are not quality adjusted; the measurement methods differ only in the scope of the
use of the “outputs=inputs” approach compared to direct measurement of activities. To what extent are the
contrasts due to this difference in measurement methods? And what does the decline reveal, if anything,
about the ‘true’ impact of the pandemic on UK health productivity?

1
 New Zealand, Malaysia and a small number of others are noticeable exceptions who have also moved this agenda
forward.

 Page 5 of 39
Figure 1: Quarterly % change in GGFCE, volume terms, SA

 Germany France Italy Netherlands UK

 24.0

 16.0

 8.0

 0.0

 -8.0

 -16.0
 2019Q1 2019Q2 2019Q3 2019Q4 2020Q1 2020Q2 2020Q3

Source: https://ec.europa.eu/eurostat/databrowser/view/teina031/default/table?lang=en; ONS 22/12/20 Economic Accounts
release for UK figures (KH2J);
https://www.ons.gov.uk/economy/nationalaccounts/uksectoraccounts/datasets/unitedkingdomeconomicaccountsmainaggregates

The evolution of health service measurement in the UK – both the volume-terms output figures feeding into
GDP and the separate productivity figures –is described in Foxton et al (2019). The 1993 System of National
Accounts (SNA) first recommended moving away from the ‘outputs=inputs’ convention in favour of direct
output measures for public services, as discussed below. ONS implemented this in the UK, but other statistical
offices either did not, or did so to a lesser degree, or used alternative measures altogether. The ONS’s first
attempts were imperfect: the UK’s early experience of making this switch in the late 1990s was paradoxically
to make measured public service productivity decline, the explanation being that statisticians initially used
certain activity input measures (such as number of operations) rather than health service output measures
(the health improvements resulting from the operations). The Atkinson Review (2005), commissioned to get
to the bottom of the paradox, therefore firmly recommended what it described somewhat loosely as a ‘value
added’ approach, in line with the principles of national accounting.2 In other words, what was the difference
the public service activity made to health? The Atkinson Review led to refinements in the measurement of
direct outputs and also the quality adjustment of outputs. Its perspective was adopted in the 2008 SNA but
not in the EU’s 2010 ESA guidance. Hence the UK public service output and GDP have been to date constructed

2
 In other words, the direct marginal contribution of activity to output. Phelps (2010) notes though that the public
service output measures do not net off intermediate purchases.

 Page 6 of 39
differently from the separate UK public service productivity figures, as explained further below. ONS has gone
further than other statistical offices in developing these latter, quality-adjusted, productivity figures, but these
are not used in constructing the output figures in GDP.

However, even within the ESA 2010 framework, countries differ in the extent to which they use the
outputs=inputs versus direct output measures (Schreyer and Mas, 2018, Table 1.1). As Figure 1 shows, the
profile of change in volume-terms government expenditures - in the face of a common shock - thus differs
greatly across countries. The choice of measurement approaches within a common methodology (and before
implementing quality adjustment) contributes to the differences in profiles for GDP growth.

Public service output in UK GDP, comprising one-fifth of the total, is currently measured as follows:3

A. Just under two-fifths of the total (37.8% in 2015) and 10.1% of healthcare is still measured using the
 ‘outputs=inputs’ convention, with inputs consisting of labour, capital consumption such as the
 depreciation of buildings or equipment, and intermediate purchases such as supplies. This category covers
 ‘collective services’ such as defence.
B. The remaining 62.2% of total public service output (and 89.9% of health) is measured as ‘quantity output’.
 The volume of output is a cost-weighted activity index: the sum of the change in the level of different
 activities, which in the case of hospitals are grouped in terms of the diseases treated, weighted by their
 unit costs:4

 Δ = σ⬚ ⬚
 , −1 , / σ , −1 , −1

Where Δ is the current period output change, indexes activities and associated unit costs . Examples
of activities are specific hospital treatments, GP visits, drugs dispensed and so on. If the mix of activity shifts
in the current period shifts such that activities accounting for a smaller proportion of the total the previous
year become more frequent, or those which were more common and have a higher weight become less
frequent, activity this output index will decrease. While better than the older convention, this method will be
misleading if a cost reduction is due to, say, a new technique that delivers the same or better outcomes at
lower cost, as has happened with many medical procedures over the years such as cataract or varicose vein
treatments. Similarly with a shift to lower cost procedures in the output mix for any reason.

3
 In calculating the separate public service productivity figures, just under one fifth (17.7% of the total in 2015, 9.8% of
healthcare) is derived using the cost-weighted activity index in B. The remaining just over two-fifths (44.5% in 2015,
80.1% of healthcare) quality adjusts the ‘quantity output’ measures to address this issue3. Specific, complex and model-
based, quality metrics are used to adjust the volume of output initially constructed by the quantity output approach (B)
(Castelli et al 2018, Hardie et al 2010, Peñaloza et al 2010). In principle the quality adjustments take the implied
deflator closer to the valuations users place on the different activities rather than using the costs to producers (Diewert
2018, Diewert & Fox 2017). These quality-adjusted statistics are used in the ONS’s stand-alone public service
productivity measures, but they are not currently used in constructing GDP or the whole economy productivity statistics
4
 The UK also uses a more detailed categorisation of activities (Healthcare Resource Group classifications) in its full year
health output figures than some other OECD countries (typically using Diagnostic Related Group classifications), so
compositional changes may play a bigger role for this reason too.

 Page 7 of 39
The output mix changed significantly during the course of 2020, with the existing weights applied in
constructing the statistics (Table 1). Nominal health expenditure has increased (most of the increase occurring
in the second quarter of 2020). But the volume of health output declined in the second quarter (recovering
partially in the third) due to the composition change: a cessation (and then Q3 recovery) in relatively high-cost
elective activities despite an increase (substantial in Q2) in relatively lower cost Covid-19-related care, mostly
critical care. Activities that declined or halted in Q2 such as GP visits, outpatient appointments and elective
procedures, along with A&E visits,5 account for about three-quarters of current quarterly health service output
by weight (Athow 2020).6 Critical care - the main area of increased activity for Covid-19 patients - accounts for
just 3.2% of weighted health output on the basis of existing weights. In addition, new health service activities
have been introduced – test and trace in 2020, and vaccinations in 2021 – which need to be added to the
output index using weights that need to be defined as there are no past data. Despite ONS making
approximate upward adjustments for the new activity of test and trace, and later for the vaccination
programme,7 on balance the changing mix led to a large increase, mainly in Q2, in the implied deflator and
decline in volume-terms output.

It could be argued that the output statistics should have incorporated altered weights within-year to reflect
the substantial mix change, but these would be ad hoc given the incompleteness of the available data.
Moreover, as discussed further below, the capacity constraints in the NHS do imply a worse output
performance compared to less constrained health systems, and it would be misleading to adjust the output
decline away through the weights used in its calculation. Judgements about the weights to apply to 2020 and
in future years will be difficult even with hindsight, depending on the extent to which the pandemic experience
is considered exceptional.

The dilemma in constructing this quantity index is similar to the well-known index number problems in
constructing a Laspeyres price index (using base year weights) or a Paasche index (using current year weights)
in constructing a price index. The two approaches answer different questions – respectively, how much worse
off are people today if they had to buy yesterday’s basket of goods (at today’s prices), as opposed to how
much worse off are they today having to buy today’s basket of goods. For statistical purposes, timely data are
almost never available for either a Paasche or an ‘ideal’ index to be used in practice. When there are large
expenditure share shifts, these can be very different answers. The situation with the quantity index here is
parallel: do we want the perspective from ‘normal’ times using previous year weights?

5
 A&E visits also declined sharply, including paediatric visits (Hughes et al 2020)
6
 There are additional services in the annual healthcare output measure for which data are not available quarterly or on
a timely enough basis to include in quarterly GDP (inc. mental health, community and ambulance services), so the listed
services account for a smaller portion of final annual healthcare output “benchmark”.
7

https://www.ons.gov.uk/economy/grossdomesticproductgdp/bulletins/gdpfirstquarterlyestimateuk/octobertodecemb
er2020#expenditure The data on the new activities are likely to be revised through 2021 as new data sources and
enhanced methods become available.

 Page 8 of 39
Table 1: Weights in health output
 High level activity Weight (%)
 GP visits 21
 Elective inpatient care 19
 Non-elective inpatient care 18
 st
 Outpatients 1 attendance 5
 Outpatients follow-up attendance 8
 Drugs 15
 A&E 6
 Critical care 3
 Dental 5
 Optical 1
 NHS Direct 0.3
 NHS Online 0.01
 Source: ONS

Figure 2. Selected non-Covid-19 NHS activities, 2019Q4-2020Q3

Source:
https://www.ons.gov.uk/economy/grossdomesticproductgdp/articles/internationalcomparisonsofgdpduringthecoronavirusCovid-
19pandemic/2021-02-01

 Page 9 of 39
The differences in measurement implementation between the UK and most other countries contribute to an
explanation of why in the UK GDP, government consumption and healthcare output all show larger volume
terms declines than some other comparable countries, but are not the only reason for the decline. An
implication is that some of those countries may be failing to measure declines in their health output. For
although the weights on different activities will be updated in future years to reflect (to some degree) the
2020 changes, the decline in non-Covid-19 health service outputs has been substantial and is a genuine
phenomenon (Figure 2); for instance, elective care procedures in 2020Q3 were at less than one-quarter of the
level in the final quarter of 2019, while the largest category (by pre-existing weight) was GP visits, at 62% of
their 2019Q4 level in Q3. Countries without the same tight capacity constraints have not had to reduce other
health activities to the same extent, however (although it is worth noting that prior to the pandemic some of
these – such as Germany – were criticized for inefficient hospital over-capacity).8 It is not clear to what extent
other countries use direct quantity output measures, but ONS reports that discussions suggest it is to a lesser
extent than in the UK.9

These declines in activity will also have a lasting effect on health outcomes through reduced screening, late
diagnosis, delayed treatment, and increased incidence of mental ill-health, on top of the adverse
consequences of the recession on health through higher unemployment and reduced incomes (Banks et al
2020, Miles et al 2020 and Thorlby et al 2020). We return to the question of outcomes, and the organization
and constraints on the NHS, in the final section below.

The discussion so far has referred to health output on the SNA basis. The separate productivity measures will
quality adjust outputs (Kent 2020). These health service productivity measures incorporating quality
adjustments might also be expected to decline when 2020 figures are published, due to input increases as well
as the directly-measured output decline. The directly-calculated productivity measure additionally accounts
for spending on inputs. All of these inputs - labour, supplies (such as PPE, oxygen and ventilation equipment)
and spending on buildings (to fit them for new infection control) requirements or augment oxygen delivery
systems for example will have increased substantially in 2020.

There will also be lasting changes in NHS processes affecting output and productivity, working in both positive
and negative directions. Depressing future productivity levels will be the need for permanent Covid-safe (more
generally, infection-safe) arrangements and ways of working in the long term, given scientific concern about
the likelihood of future pandemic threats (IPBES 2020). This implies, for example, permanently lower bed
occupancy in given ward space, fewer appointments for given staff numbers and space constraints, and dual
(Covid and non-Covid) spaces in hospital buildings. Potentially boosting productivity on the other hand will be
the changed ways of working, including using new technology, introduced almost overnight thanks to the
crisis, and in some cases also changed organisational structures and increased flexibility. In primary care, for
example, the NHS has moved to a ‘total triage’ model of care enabled by online, video and telephone
consultations (Bakhai 2020), along with tech-enabled remote monitoring (also known as ‘virtual wards’) to

8
 E.g. https://www.euro.who.int/__data/assets/pdf_file/0008/255932/HiT-Germany.pdf
9

https://www.ons.gov.uk/economy/grossdomesticproductgdp/articles/internationalcomparisonsofgdpduringthecorona
virusCovid-19pandemic/2021-02-01
support people with Covid-19 oximetry (Inada-Kim and Donnelly 2020). We turn to these issues next, building
on interviews exploring these various changes, including the extent to which they are likely to persist.

 3. NHS England context

While private healthcare exists in the UK, the main or sole provider of primary care for the vast majority of the
population is the government-funded NHS (Majeed et al, 2020). Total current healthcare expenditure in 2018
was £214.4bn, and both total and per capita measures have risen in real and nominal terms every year
between 2014 and 2018. The NHS England budget was £148.8bn in 2019/20, increasing to £201.7 billion in
2020/21, which included £50bn for Covid-response. Health expenditure has broadly remained a broadly
constant share of GDP at 10.0% since 2011, but this is up from 6.9% in 1997. The government finances 78% of
all healthcare expenditure, with the majority of this (64%) spent on curative or rehabilitative care. Only 4.8%
of government healthcare expenditure was on preventative care, including early detection of disease, and this
has been falling in real terms since 2015, largely due to falls in spending on public health services by local
authorities (ONS, 2020).

Our interview hospital trusts are within NHS England. In general, health services in the devolved nations have
diverged away from NHS England structures, with less emphasis on competition. For example, Scotland and
Wales have integrated boards that commission services at a local level. Northern Ireland has fully integrated
health and social care (Watson and Komashie, 2020). Within England, health care was formally devolved to
Greater Manchester in 2016. This included taking control of the annual health and social care budget of £6
billion. Ten Local Authorities, 12 CCGs, and 15 NHS trusts and foundation trusts were involved. However, the
changes occurred within the existing legislative framework for the NHS in England. The Local Authorities and
NHS bodies involved experienced no change in budgets, accountability structures or governance
arrangements (Walshe et al, 2018). Manchester is also notable for now having one of the largest acute Trusts
in England, running a group of nine hospitals and over 20,000 staff. Three existing hospital providers, Central
Manchester NHS Foundation Trust (CMFT), the University Hospital of South Manchester NHS Foundation Trust
(UHSM), and North Manchester General Hospital (NMGH) were merged in October 2017 to form the
Manchester University NHS Foundation Trust (MFT). The new trust also runs the Manchester Local Care
Organisation, a partnership between several community and NHS stakeholders with responsibility for delivery
of out-of-hospital care.

Since the 1980s, the NHS and NHS England have been subject to a series of reforms aimed at increasing
efficiency and introducing more private sector management practices. This was driven by the shift to New
Public Management (NPM) and included the creation of an internal market within the NHS, which mandated
a distinction between which NHS organisations were buying services and those which were providing (and
therefore selling) the healthcare services. Criticism grew over the 1990s concerning the fragmentation of
healthcare and also a desire for digitization, which required collaborative efforts. Subsequent reforms were
nominally a reverse of the drive toward NPM methods, but maintained the internal markets, centralisation,
and targets that were features of the previous reforms (Dalingwater, 2014). The ‘multiple, overlapping, and
often contradictory reforms’ of the NHS in recent decades have been criticised for creating conflicting
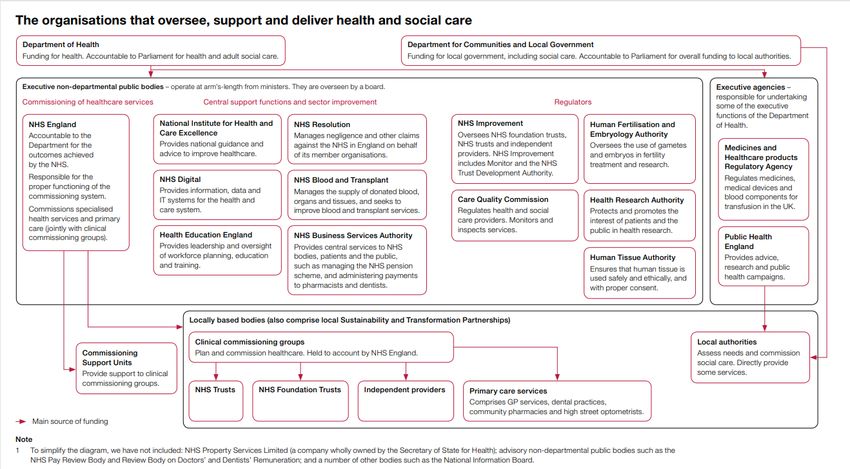
incentives for both collaboration and competition between NHS organisations (Walshe et al, 2018). However,
Propper (2018) shows that increasing competition within NHS England has had broadly positive results for
patients, although its implications for productivity are less clear.

As of 2017, there were 27 agencies and public bodies within the NHS, summarised in Figure 3. The largest of
these is NHS England, with responsibility for planning and buying health services in England since the latest
set of reforms in 2012. It also plans a large part of NHS strategy (Powell, 2020). In turn, most of the budget of
NHS England is passed on to over 200 Clinical Commissioning Groups (CCGs), also formed in the 2012 reforms,
which plan for health services in their local area, and buy the services from various organisations, such as NHS
Trusts running hospitals and community services, and General Practitioner (GP) practices (King’s Fund, 2017).
Separate to the CCGs, many NHS England bodies have developed Sustainability and Transformation
Partnerships (STPs) as a collaborative effort between NHS commissioners, providers, and Local Authorities.
There are 44 such STPs, though they have no formal powers. The 2012 legislative reforms were designed to
increase competition, and therefore these collaborative efforts can be restricted by competitive tendering
rules (Alderwick, 2020), illustrating the tensions between competitive and collaborative approaches.

In January 2019, the NHS published a new long term plan and five year framework. A key part of this plan
involved new Primary Care Networks (PCNs), formal structures for large scale GP collaboration. Since May
2020, nearly all GP practices have been incorporated into around 1,250 geographical networks, typically
covering 30-50,000 patients, and normally contained within one CCG (Baird and Beech 2020). At the outset,
all GP practices were expected to join a PCN and could only access certain new funding streams by doing so.
This funding is intended to compensate individual practices for their collaborative efforts, and also to deliver
an expanded variety of primary care services, specified by the NHS, that will be mandatory for PCNs to provide
in future. The networks are intended to focus on the wider health of the local population and include more
proactive and anticipatory care. However, there are concerns over the current feasibility of delivering these
services in all PCNs, as well as the possibility that new funding for recruitment of specific roles which may
result in labour shortages elsewhere. In addition, the geographic areas for PCNs were not based upon existing
collaboration networks, which may be disrupted (NHS Confederation 2020). As we write this, another White
Paper proposing health service reform was published, creating a duty for the NHS and local authorities to co-
operate to integrate care, and reducing bureaucracy including by amending competition law to enable joint
provision of services (Health Policy Insight 2021). The proposed changes mark a significant move away from
the prior emphasis on competition within the NHS, ending the ‘internal market’, and also a shift toward
centralisation of decision-making.10

There is also some evidence that the extension of market based approaches led to the private sector, or
“independent sector providers,” being awarded a large number of NHS contracts. However, these tend to be
smaller contracts. In the year 2018/19, £9.2 billion was spent by NHS commissioners on these services, which
account nevertheless for a large proportion of some procedures (hip and knee replacements, and cataracts,
Stoye & Kelly 2020). This represented an increase in absolute terms from the previous year but remained
constant as a proportion of the total budget at 7.3%. However, this does not include organisations such as the

10
 https://www.gov.uk/government/publications/working-together-to-improve-health-and-social-care-for-all
majority of GP services, which are private partnerships, and not-for-profit charities. The figure increases to
25% when spending on primary care services, including GPs, optical and dental services, is included (King’s
Fund, 2019).

NHS Digital/NHS X

Digitisation has been seen as a potential source of increased efficiency and productivity in the NHS, yet the
record of introducing digital technology has been mixed. There are two separate agencies dedicated to
incorporating digital technology into health and social care. They are NHS Digital, founded in 2016, focussed
on delivery support, and NHSX, founded in 2019, which focuses on strategy work and the long term agenda.
Both these bodies have been involved in aiding the Covid-19 pandemic response in terms of technologies such
as remote monitoring, video conferencing, and 111 coronavirus services; easing the regulatory burden of data
compliance governance; and delivering the NHS Covid-19 app (Lovell 2020).

 Figure 3

Source: NAO https://www.nao.org.uk/wp-content/uploads/2017/09/2017-Short-Guide-to-the-Department-of-Health-
and-NHS-England.pdf
Staff shortages

A key concern prior to Covid-19 pandemic was the significant shortage of NHS staff. Based on pre-pandemic
data up to February 2020, there was a projected shortfall of over 115,000 full time equivalent staff in England,
projected to double over the next five years and more than treble in the next ten years (Shembavnekar, 2020).
In particular, there were prior shortages of nurses and GP staff. In the FYE 2018, a year with a 2.3% increase
in overall labour inputs to the NHS, FTE nursing staff numbers fell by 0.2% and GPs and GP staff numbers fell
by 0.9% (ONS, 2020). London has the highest percentage of vacancies to jobs in both NHS roles (Nuffield Trust,
2020) and in social care. Large shortages of nurses were noted as the most urgent issue in the NHS 2019
Interim People Plan, with subsequent pledges in the 2019 UK election to decrease the shortfall through
retention and recruitment (Macdonald and Baker, 2020). The UK also has one of the lowest rates of doctors
relative to its population in the OECD, with 2.8 doctors per 1,000 people compared to the OECD average of
3.5 (OECD 2019).

In the first UK lockdown several measures were taken to address hospital shortages. The supply of doctors
was increased by the early graduation of final year medical students, and an agreement with funding bodies
to allow those working in education, research, or inspection to return to clinical duties. There was also an
appeal to NHS staff who had left in the previous three years to return to work, and there was redeployment
of staff within to departments with greatest need with rapid training to facilitate this (Alterwick, 2020).
However, the Covid-19 pandemic arrived in a context of a health service that has seen successive re-
organisations, a strong emphasis on competition and efficiency metrics, and also clear evidence of prior
pressures on the service - mainly manifesting as staff and bed shortages.

 4. Changes in hospital practice during the pandemic

Hospitals are at the frontline of public health response to pandemics. The speed at which Covid-19 can
propagate through a population, and the criticality of the symptoms, lead to peaks in demand for hospitals
which are usually not designed to provide the required capacity. In consequence, medical and non-medical
executives have to make critical decisions regarding clinical operations and resource allocation, with
implications for their day-to-day productivity. To get additional insight into what has happened in hospitals
specifically during 2020, which changes might persist, and their potential future productivity impacts, we
conducted semi-structured interviews in two hospital trusts, Addenbrooke’s in Cambridge, and the
Manchester Foundation Trust, in November and early December 2020 (see Appendix for methodology).

Based on the interviews, here we describe key elements, challenges and enablers of the response strategies
taken to create surge capacity for the delivery of services during the pandemic. Although the number of
interviews was small, there were consistent themes (see Appendix).

“Incredibly busy and incredibly idle”: The dynamics of Covid-19 and non-Covid-19 care

In spite of earlier epidemics such as Severe Acute Respiratory Syndrome (SARS), Middle East Respiratory
Syndrome (MERS) and H1N1 influenza, hospitals were caught unprepared by the Covid-19 pandemic. The
expectation of an imminent large influx of patients suffering from an insufficiently researched, highly
transmissible disease at unknown scale was fuelled by the images from other European countries of patients
suffocating in hospital corridors. This perception induced significant efforts towards service reconfiguration at
all levels of the UK health care system. National authorities, medical societies and academic scholars set out
to issue guidelines advising on the management of Covid-19 patients and reconfiguration of hospitals to
minimise the risk of nosocomial transmissions. 11 Like others, the hospitals in Manchester and Cambridge
quickly reacted to the anticipated increase in demand by undertaking multiple modelling and planning
activities to identify resource gaps and create surge capacity:

 “So we were constantly trying to say there's this tidal wave - that we don't know the size of it (…)
 coming towards us of a particular group of patients and we need to prepare for that. And those
 patients are infectious. And you need PPE. And a lot of them need ventilators, we haven't got enough
 ventilators; a lot them need critical care, we haven't got critical care staff.”

A key element of the early response strategy was the launch of an extensive human resource activation and
upskilling programme. While recently retired medical staff and staff in education or research made themselves
voluntarily available for clinical duty, hundreds of staff entered a retraining programme to provide adequate
capacity in critical care. These activities were complemented not only by the large-scale cessation of non-
essential services including elective, outpatient and diagnostic activities, but also by the discharge of medically
fit hospital inpatients. This was supported by an increased effort to obtain social care.

As a consequence of these early changes, staff and bed resources freed up, rendering several departments of
the hospital idle. This effect was further enhanced by the shift in behavioural patterns that could be observed
in the community even before lockdown measures taken by the government became effective. The “Stay at
Home” campaign led to a steep decline in demand for emergency services. For instance, at Addenbrooke’s
hospital, the number of patients turning up at the Emergency Department dropped by about 50 percent
(Figure 4). These circumstances allowed the hospitals to focus on the treatment of Covid-19 patients and
critically ill inpatients, accelerating their learning about the new disease and enabling a higher-than-usual
turnaround of patients. Productivity was broadly perceived as high during these early phases of the pandemic:

 “The big thing that made a big difference to how we can look after our patients, was a combination of
 reduced demand and an increased supply of beds. And that meant that we were able to look after our
 patients much better. Patients who needed admitting, could be sent admitted quite quickly. Patients
 who could be discharged home could be seen earlier and sent home earlier. So, the thing that made a
 big difference was, you know... It helps having more staff on a bed. But the big thing that made a
 difference was actually reduced crowding.”

11
 Nosocomial transmissions are those resulting from a visit to or stay in hospital.
Figure 4: Emergency attendances at Addenbrooke’s hospital (March 2019 – September 2020)

 ED Attendances
 12000

 10000

 8000

 6000

 4000

 2000

 0

Despite the advantages of focused learning and the capacity to undergo organisational change, it was
nevertheless quickly recognised that the delay and cancellation of diagnosis and treatment for non-Covid-19
patients could potentially lead to harmful exacerbation of the conditions of these patients. As such, the public
was encouraged later in the spring and summer of 2020 to make use of emergency services again and non-
Covid-19 services were gradually restarted although not reaching pre-Covid-19 baseline levels before
cancellations began again with the beginning of the New Year. Simultaneously running Covid-19 care and
several services of non-Covid-19 care had significant implications for the availability of the resources and
operationalisation of infection control.

Infection control in focus: resource availability impairing productivity. Many of the guidelines that were
issued nationally and locally required a reorganisation of clinical pathways and processes affecting operational
performance metrics and capacity availability. There are several elements explaining the productivity issues
in hospitals during the ongoing Covid-19 pandemic flagged up in the interviews.

Loss of absolute capacity. Infection-control guidelines demanded social distancing be practiced in all areas of
the hospital. For example, greater distances between beds were required on the wards, to ensure appropriate
patient segregation. In addition, some areas were designated for “donning and doffing” of PPE. This led to a
significant reduction in available space and thus absolute bed capacity. In these extensive reconfiguration
efforts, the estate was broadly perceived as a primary limiting factor with hospital building layouts not
designed for such practices:
“(…) we had a ridiculous time during the escalation of the first wave, when there were only three or
 four patients in what would normally contain 14 ICU patients. And that's a big impact (…) what we did
 was we built a wall. We walled off that seven bays so that it could be considered as being
 geographically distinct from the six bedded bay”.

Loss of functional capacity. To ensure patient segregation, hospitals designated wards for different types of
patients (i.e. Covid-19 positive, Covid-19 negative, Covid-19 susceptible) limiting their flexibility in bed
allocation. An outbreak in an intentionally Covid-19-free ward could thus cause a sudden drop in available bed
capacity. Patients would be required to get tested and potentially moved to other areas in the hospital while
an additional cleaning demand during times of already extraordinary cleaning requirements would be created,
rendering wards not usable for an unforeseeable period of time.

Limited planning capability. While guidelines were regularly updated, and sometimes conflicting, little room
was provided for staff to synthesize, interpret and translate information into actionable operational processes
that were both feasible and comprehensive for staff and patients. The informational instability created more-
than-necessary caution among operational staff impairing planning capabilities, especially for patients in
surgical services:

 “Should we isolate a patient for 14 days? And then it was 3 days, but some surgeons might want to
 keep 14 days if they’re having the big cancer cases. And then, patients are then confused what did that
 mean for their families, so did the whole household have to isolate? (…) And at the beginning, PPE
 changed so constantly, very difficult to operationalize.”

Non-availability of staff. Over time, hospitals went from “being massively overstaffed to being massively
understaffed”. Populating non-Covid-19 services with staff after significant redeployment required another
reorganisation of team structures and adjustment of rotas. This proved a difficult endeavour in multiple ways.
Based on a risk assessment of their morbidity, certain members of staff were limited to work in specific areas
of the hospitals only. With a higher prevalence of Covid-19 within and outside the hospital with the onset of a
second wave, a higher percentage of the overall workforce became infected or needed to self-isolate. In
addition, an undoubtedly substantial effect on staff availability was the continuous exposure to pressure,
change and ambiguous timelines, with adverse mental and physical consequences among frontline staff. The
additional staff being sent to critical care were often not trained for the assigned roles and, while often helpful
for some tasks, this created more pressure on the ICU nurses who had to repeatedly train up incoming ward
nurses. The following interview excerpt gives insight into the situation of staff deployed to critical care:

 “For example, one of their theatres, the day surgery theatres (…) sent us [critical care] staff. (…) They've
 struggled with the exposure to patients that they would never be exposed to normally (…) You don't
anticipate that you're going to have to provide last rites to a patient and (…) send them to the
 mortuary.”

Shift in case mix. The pressures on the bed base were further aggravated by the shift in case mix observed in
elective surgery patients. The introduction of prioritisation schemes to manage congested waiting lists of
surgical specialties was intended to enable surgery for those patients with the highest clinical priority first. Yet
this shift in case mix towards a higher proportion of patients undergoing highly invasive and complex surgery
was associated with longer average lengths of stay for these patients. In addition, for some already critically
ill patients, the waiting time had already caused progression in their disease, increasing the likelihood for
higher bed level requirements. In light of the targets being set by the NHS that required all hospitals to return
between 80 and 100% of baseline surgical activity by the end of 2020, critical voices have been raised about
the appropriateness of those targets:

 “To me, this just seems completely out of kilter with what we should be doing. So, should we be only
 delivering the surgery on patients with the highest clinical priority, or should we be doing high volume
 numbers? And I think that’s very difficult for this organisation to make that decision.”

Longer turnaround times. The implementation of donning and doffing protocols and cleaning requirements
created an “extra layer of processes” which slowed all operational processes down. The impact proved
especially strong in surgical areas where surgery and turnaround times were substantially prolonged. To limit
exposure to aerosols, workflows inside and outside surgical suites needed to be redesigned. Taking on and
taking off extensive amounts of PPE not only extended pre- and post-surgical phases but even required the
exchange of surgical teams for procedures exceeding several hours. Another contributing factor was the
required time for air-cleaning activities in between surgical cases, especially after aerosol-generating
procedures. In consequence, compared to pre-Covid-19 rates, fewer patients could receive surgical treatment

 “Even if we've been able to see as many patients through the front door we would never have got
 through as many patients in a day, given all the PPE and the turnaround.”

Decline in Covid-19 mortality rates. With increasing numbers of treated and recovered Covid-19 patients and
further science-based treatment recommendations, learning processes became apparent highlighting the
importance of quality-adjusted measures of healthcare productivity:

 “We know when to give them steroids, we’re better equipped to know when to ventilate them or when
 to send them for non-invasive ventilation, when to give drugs, when to send them home (…) At the
 moment, they seem less likely to die. But as a consequence, they might stay in hospital for a bit longer.”
The fluctuations in resource availability together with the resumption of non-Covid-19 care have implications for the efficiency at which hospitals of the NHS are normally run. Implications for future resilience will be discussed in more detail in a subsequent section. Enablers of rapid organisational change and implications for the future Our interviews reveal that the rapid organisational change hospitals underwent in the early stages of the pandemic were enabled by (1) a major buy-in of internal and external NHS workforce, (2) the provision of extra funding, (3) the easing of governance processes (4) the creation of surge capacity, and (5) setting up enhanced communication and technology infrastructure. Despite the overwhelming tragedy, many interviewees reported that the dynamics during the pandemic helped to overcome red tape, potentially providing an impetus for rethinking the service and future improvement within NHS hospitals: Staff Recruitment, Retention and Willingness to Change. The willingness of NHS workforce to jointly combat the virus created a common purpose (“Keeping staff and patients safe”) and enabled swift changes in hospitals. However, the dynamics of the past months have more recently created stress, fatigue, and resistance to further change and the willingness to deliver extra services. At the same time, staff sickness rates have gone up, adding further to a general shortage of nursing staff. A long- term recruitment and retention strategy is required that alleviates the impact on workforce mental health, but maintains an appetite for change in terms of continuous improvement. Government funding. The removal of financial barriers by the government enabled hospitals to set up quickly extensive procurement programmes for consumables (e.g., PPE), testing capacity and equipment (e.g., ventilators); and also to launch continuous improvement projects previously without funding in place. Money for the use of private facilities allowed hospitals to ease the burden of the waiting lists by delivering surgery offsite. Future funding levels will be critical in addressing the backlog of patients. Easing of governance processes. The removal of bureaucratic layers and the set-up of new command and taskforce structures softened the vertical and horizontal boundaries of services and hierarchies in hospitals, and enabled more interdisciplinary coordination. Processes accelerated within hospitals and also in their relationship with the external environment. For example, the discharge of patients to nursing homes in the early stages of the pandemic happened faster than usual as barriers of paperwork and agreements evaporated – albeit with terrible consequences. Yet an acceleration of processes can put quality at jeopardy, as this example shows. Another example is that the urgent need for equipment such as ventilators has cut bidding processes resulting in the procurement of potentially lower quality products. The pace at which hospitals will operate in the future will largely depend on their ability of finding a balance between robust business-as-usual and flexible institutional structures.
We found some concern that this pace and flexibility would revert: “initially (…) there was a huge amount of change, and it was very dynamic, and we've now got a whole load of treacle.” Provision of surge capacity. In the expectation of a significant backlog of diagnostics and treatment demand, many hospitals have started to build surge capacity by purchasing more equipment and setting up external modules to enlarge their bed base. Due to the interdependency of hospital services, this has implications for other types of resources. For example, more beds provided for orthopaedic surgical patients creates significantly more demand for radiology services requiring additional capacity for example for CT and MRT scanning. To avoid bottlenecks within the hospital, a holistic view of the surge strategy is needed, potentially crossing the boundaries of the hospital. For example, prior to the pandemic, the Manchester Royal Infirmary had already bundled head and neck surgical services from other hospitals in the region. This model could hold lessons for endeavours in other regions. Technology infrastructure. Hospitals, like many businesses, expanded their technological infrastructure to enable effective remote working. Videoconferencing massively improved communication and coordination within and across hospitals. Likewise, the use of telemedicine for outpatient clinics has bridged an important gap in service availability and helped many physicians overcome their doubts. While there is general consensus among our interviewees that virtual meetings and consultations will have a long-lasting impact on certain hospital services, the necessity of face-to-face encounters in the patient-doctor-nexus is crucial for quality of care. Many interviewees also emphasised the importance of their electronic medical record system. To what extent IT systems will have a long-term impact enhancing co-ordination across different levels of the healthcare system will also depend on their interoperability. Prospects The effects of the pandemic remain profound. As we were writing this paper, hospitals across the UK were witnessing a rapid rise in daily hospital admissions due to high community prevalence. Presumed to be stemming from a mutation of the virus about which relatively little scientific knowledge exists to date, this third wave is likely to cause a reinforcement of restrictions jeopardising continuity of care and compounding the situation in hospitals. These developments will further require administrative, medical and management staff to make difficult decisions with potential unintended or unavoidable consequences and increase the mental, physical and emotional burden for the entire NHS workforce. The repeated wave further emphasizes the need for operational and logistical capabilities to respond to different scenarios in the short-, medium- and long-term for efficient healthcare delivery while maintaining a maximum level of staff and patient safety. Leveraging in-house collected data and knowledge will be crucial for hospitals to drive efficiency projects during the pandemic and beyond. Our interviewees repeatedly highlighted the role of leadership and transparent communication during the pandemic. Hospital executives, nursing managers and department supervisors, thus, need to seek approaches so they are responsive to the concerns of their workforce while navigating the ongoing pandemic.
Our interviews suggest that some of the changes in NHS services, processes and organisation implemented during 2020 may persist, with implications for future productivity: Non-Covid-19 treatments will stay at reduced levels, certainly in peaks of Covid-19 hospital admissions, as long as the pandemic persists, with adverse consequences for output and hence outcomes overall, given NHS capacity constraints. On the other hand, new activities including track and trace, and vaccination programmes, will add to output. When it comes to measurement, ONS will need to determine the most appropriate weights for different activities and this will involve judgements, including about the extent to which 2020 should be regarded as an outlier year. It is worth considering sensitivity checks such as using different weights, or using another price index such as average earnings to deflate health expenditures. There will be lasting changes in the use of physical space in hospitals and in staff practices (such as “donning and doffing” of PPE) to embed infectious disease control requirements. This will reduce their effective capacity (in-patient and out-patient) in current facilities. Output and productivity levels will thus be lower than in a counter-factual non-Covid-19 world, given current space and staff availability, even with many staff being reallocated to different activities within hospitals. The crisis has brought about rapid changes in the use of technology, both workplace productivity technology such as video-conferencing for staff, and technology for use with patients, such as video or telephone consultations. This is discussed further below. The move already under way toward using electronic patient record systems such as EPIC will likely be accelerated. Technology adoption by the NHS has a troubled history, however, and there will undoubtedly be challenges (Price et al 2019). There have also been changes in the organisation of services and in governance structures, giving the NHS greater operational flexibility and agility, but it is unclear whether these will last, or whether there will be a reversion to previous structures. Some interviewees feared a return to slower decision- making processes once the sense of crisis has passed. 5. Health service productivity outlook Spending on healthcare as a share of national output has trended upward and is likely to continue to do so, because of ageing and cost pressures (Stoye & Zarenko, IFS 2019). Future governments will naturally seek cost efficiencies and productivity improvements. The ONS figures for health productivity show that since 2010, both input and output growth have slowed, but a greater fall in inputs led to eight successive years of positive (non-quality adjusted) healthcare productivity growth. Quality-adjustment, incorporated into the health productivity figures in 2003, on average adds 0.5 percentage points to annual productivity growth. In FY2018, quality adjustment added 0.4 percentage points, with a resulting 0.7% quality adjusted healthcare productivity growth. This was the slowest increase since FY2010 (ONS, 2020).
As noted earlier, the measurement of public service health productivity is particularly challenging. The known
difficulties in distinguishing activities from outputs, and in quality adjusting as medical innovations continue,
reflect inherent conceptual challenges. Atkinson (2005) pointed out that there is no reason to expect
productivity improvements in certain services requiring essential human contact – where machines are limited
substitutes even in the case of digital technology – or in areas where there has already been so much
improvement that it is unreasonable to expect more and the challenge is rather to not regress (such as reduced
neonatal mortality). Technology in areas such as robotics has advanced considerably since he wrote this, but
there will nevertheless continue to be many services needing human input.

A full conception of productivity should also include a number of outcome improvements that either manifest
over time or reflect the management of uncertainty: the insurance value of better infectious-disease control
in a world at risk of experiencing repeated pandemics; the option value of a capacity margin in the event of
other types of unexpected peak load demand; and the demand-reduction effects of better preventive care
(such as the link between respiratory health and better Covid-19 outcomes).

A broader issue still is the difference between measurement of output and consequently productivity as
opposed to measurement of health outcomes and economic welfare. Figure 5 portrays the relationships. It
speaks to the fundamental dilemma of being able to measure activities and outputs relatively easily while
actually wanting to understand their impacts on economic welfare (Coyle 2014). Although the UK’s health
output performance will have been worse than in some other countries because limited capacity reduced non-
Covid health activities so considerably, the economic welfare outcome is nevertheless better than it would
have been without the adjustments in response to the pandemic.

Figure 5 Health Inputs, outputs and outcomes
You can also read