Public Expose 2014 PT Chandra Asri Petrochemical Tbk - Jakarta, 2 June 2014
←
→
Page content transcription
If your browser does not render page correctly, please read the page content below
Public Expose 2014
PT Chandra Asri Petrochemical Tbk
Jakarta, 2 June 2014
Contents

I.   Company At a Glance
II. Petrochemical Industry Updates
III. Financial & Operational Performance
IV. Strategic Initiatives

                                           2
I. Company At a Glance

                         3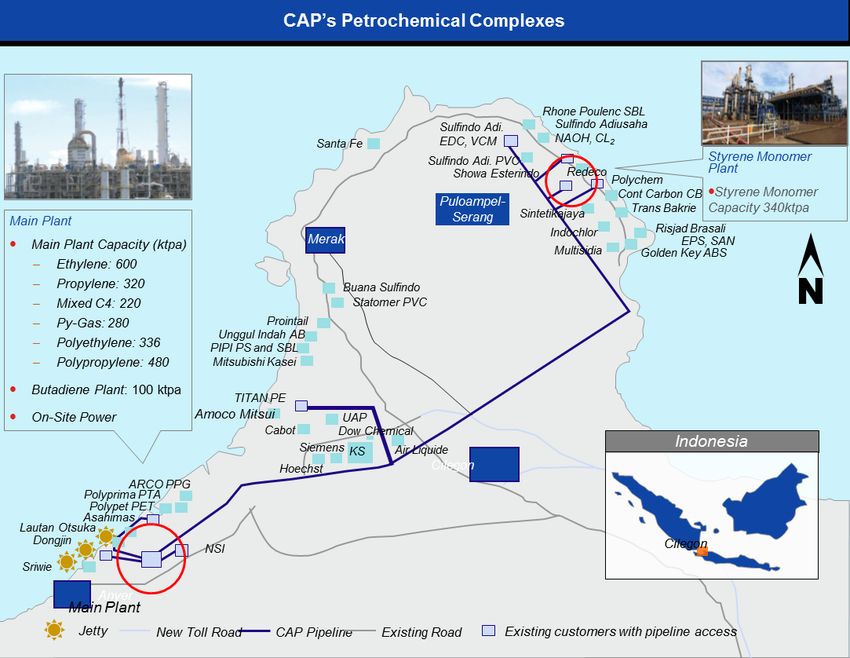
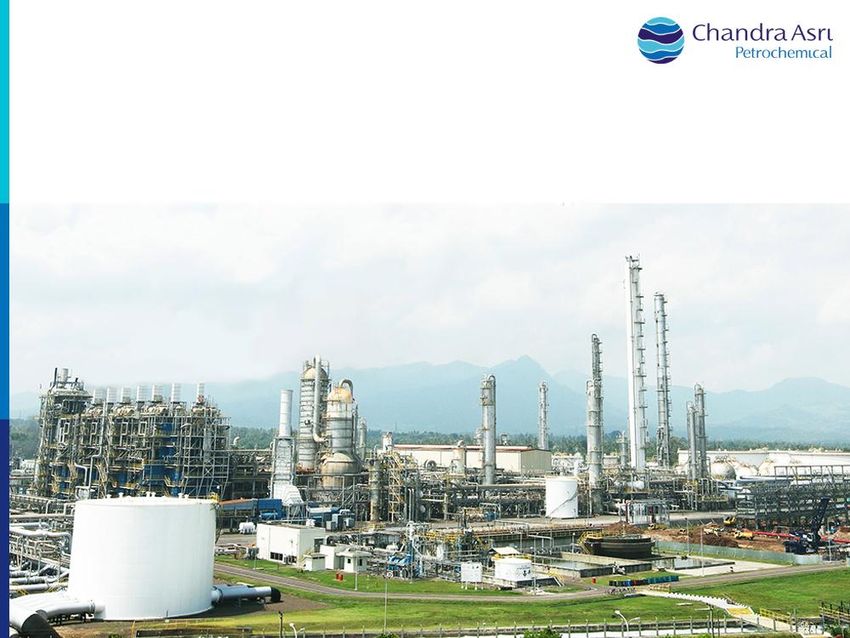
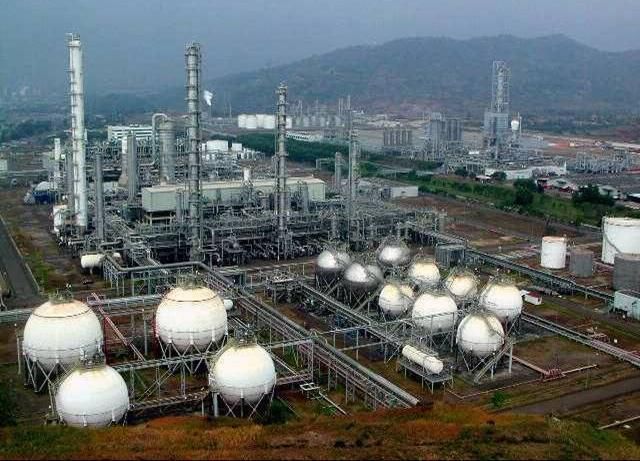
Company At a Glance (“CAP”)
The largest and integrated producer of Olefins and
Polyolefin in Indonesia.
Owns the only Naphtha Cracker, Styrene Monomer, and
Butadiene plant in Indonesia.
Manufactures chemicals and plastics that are used in a
variety of everyday consumer and industrial products
including packaging materials, containers, storage
materials, tires, and others.
End-user consumer of plastic products amounted to 70% Integrated manufacture complex
of CAP's total sales (30% from industrial markets).
Have unique position to capitalize the high growth
prospects of petrochemical industry in Indonesia and the
rising of consumers demand.
Ethylene plant Polypropylene plant
Supported by strong majority Shareholders, Barito Pacific
Group (65.20%)* and SCG Chemicals Co. Ltd. (30.15%) -
ownership as of 30 April 2014.
Notes: (*) Including CAP ownership which are owned by Marigold Resources Pte. Ltd. and
Magna Resources Corp. Pte. Ltd.
Styrene Monomer plant Butadiene plant
4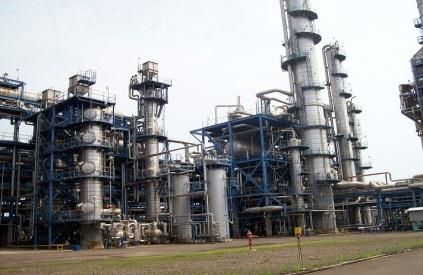
CAP Vision & Mission

VISION    The Leading and Preferred Petrochemical Company in Indonesia

          Continue to grow and improve our leadership position through
          integration, development of human capital and preferred
MISSION   partnership, in a sustainable manner that will contribute to the
          growth of Indonesia.

                                                                         5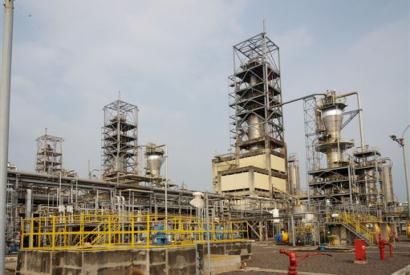
CAP Key Strengths

                                     1

                                         Diverse Product Portfolio

7
                                                                               2
     Solid & Experienced
    Management supported                                                            Integrated Business
    by Strong Commitment                                                                Operations
      from Shareholders

6                                                                              3
      Loyal and Broad
      Customer Base                                                                 Strategic Location

                     5                                    4

                                                              Stable and Flexible
                         High Operating Rates
                                                               Feedstock Supply

                                                                                                         6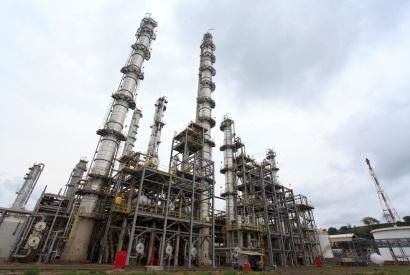
1        Diverse Product Portfolio

                                                                       Net Revenue FY-2013: US$2,506 million

                 51% of Net Revenue                     25% of Net Revenue                         22% of Net Revenue              2% of Net Revenue

        Polyolefins                               Olefins                             Styrene Monomer                      Butadiene

          Net Revenue                            Net Revenue                                Net Revenue                      Net Revenue
    FY-2013 : US$1,272 million              FY-2013 : US$616 million                   FY-2013 : US$556 million         FY-2013 : US$62 million

       Polyethylene                   Ethylene                  Propylene

      Polypropylene                   Py-Gas                    Mixed C4

                                                                                     Established a JV between PBI and Michelin to build
                                                                                      Synthetic Butadiene Rubber ("SBR") plant facility.

                                                                                                                                             7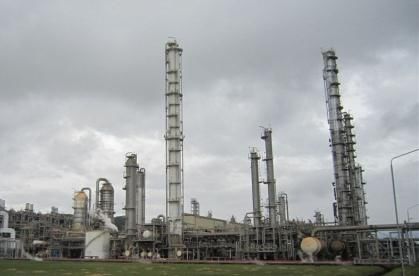
2                     Integrated Business Operations
                                Vertically integrated business operations resulting in higher efficiency and lower costs.

                                                                                              Crude Oil
       Oil & Gas

                                                                                              Refinery

                                                 Diesel               Kerosene                 Gasoline                 Naphtha                         LPG
Petrochemicals Petrochemicals

                                                                                         Naphtha Cracker
                 Upstream

                                                Ethylene                     Propylene                        Py-Gas                                Mixed C4
  Midstream

                                                Styrene
                                               Monomer                                                                                 Butadiene          Raffinate - 1

                                                                                                           New generation
                                                                                                          Synthetic Rubber
                                             Polyethylene                 Polypropylene
Petrochemicals
 Downstream

                                                                                                                             Company future products via joint
                                                                                 Company Products
                                                                                                                             venture with Michelin

                                                                                                                                                                      8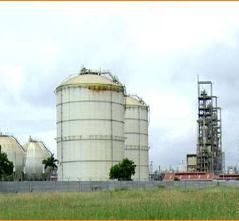
2 Integrated Business Operations
Fully integrated from feedstock to downstream products.
Key Products Main Process Plants Key Markets
Ethylene LLDPE(1)
330 ktpa Polyethylene Domestic
336 ktpa
HDPE(2)
Export
600 ktpa
170 ktpa
Domestic
Styrene Monomer
100 ktpa Licensed by Domestic
Lummus (USA), Export
340 ktpa
Naphtha Naphtha
cracker plant
Homopolymer
1,700 licensed by
ktpa Lummus Polypropylene
(USA) Propylene
Union Carbide Random Domestic
320 ktpa (USA) Copolymer
480 ktpa
Pyrolysis- Impact
gasoline Copolymer
(Pygas)
Export
280 ktpa
Butadiene
Crude C4 Domestic
BASF/Lummus
220 ktpa 100ktpa Export
Increased margin capture down the product value chain
Note:
(1) LLDPE: Linear low density polyethylene
(2) HDPE: High Density Polyethylene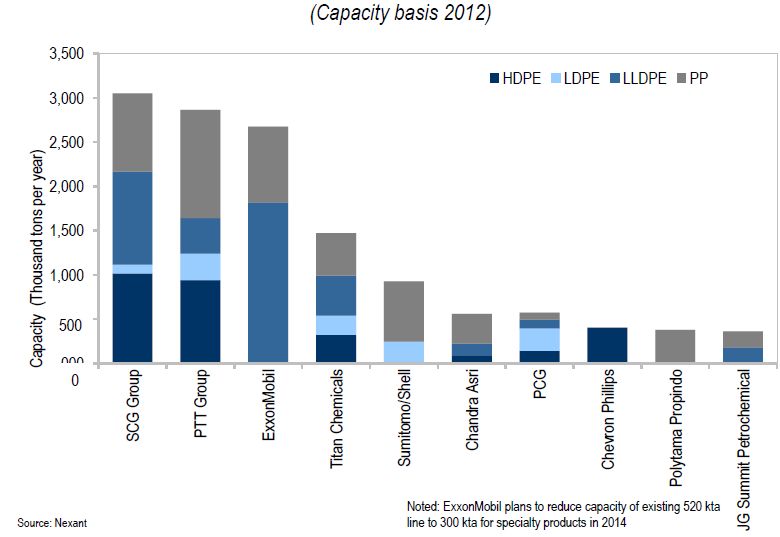
3   Strategic Location
    Adjacent and interlinked with Customer's Facilities.

                                                           10
4 Stable and Flexible Feedstock Supply
Feedstock Overview Naphtha Purchases: Spot vs. Contract
• Various feedstock can be used for Cracker,
30% 33% 28%
including: 45%
› Naphtha
› LPG 70% 67% 72%
55%
› Condensates
• Long-standing and stable relationships with our
2010 2011 2012 2013
suppliers.
Contract Purchase Spot Purchase
• No material interruptions to deliveries of own
feedstock over the last five years. Key Feedstock Source YTD Sept-2013
• Combination of supply arrangements and spot
purchases provide flexibility. Benzene 100%
• Diverse set of Naphtha suppliers: no single
Propylene 36% 64%
supplier dependence.
› Trading Companies in Singapore and Ethylene 100%
Malaysia.
Naphtha / LPG 100%
› Direct purchases from refineries.
0% 20% 40% 60% 80% 100%
Externally Sourced Internally Sourced
115 High Operating Rates
CAP continued to achieve high capacity utilization rates, mainly due to robust demand from the domestic market in
Indonesia which is a net petrochemical importing country and focusing on energy yield and efficiency improvements.
CAP Utilization Rates
Ethylene Polyethylene, Polypropylene, Styrene Monomer, Butadiene
2011: 45- day
planned shutdown
maintenance year
in Oct-Nov
95% 99% 102% 105% 100%
89% 96% 94% 95% 95%
89% 90% 90% 89%
78%
76% 75%
2010 2011 2012 2013 2010 2011 2012 2013
Polyethylene Polypropylene Styrene Monomer Butadiene
126 Loyal and Broad Customer Base
Diversified clientele with Top 10 Customers Top 10 Customer’s Sales Breakdown
accounting for only 37% of revenues in YTD Net Revenue CAP – FY-2013: US$ 2,506 million
2013.
Solid and long term relationships with key Top 10
37% Customer's Sales
Customers.
63%
Others
Customers integrated with CAP production
facilities via CAP’s pipeline.
Strong marketing and distribution platform Selected Key Customers
with wide network serving ~300+
Customers.
Short delivery trend time and historically
commanded pricing premium to
benchmark prices.
137 Solid and Experienced Management
Board of Commissioners
George Allister Agus Salim Loeki Cholanat
Tan Ek Kia Hanadi Rahardja Chaovalit Ekabut
Lefroy Pangestu Sundjaja Putera Yanaranop
Board of Directors
Erwin Ciputra
President Director
Paramate Raymond Terry Lim Chong Suryandi Baritono Paisan
Nisagornsen Budhin Thian Director Pangestu Lekskulchai
Vice President Vice President Director Director Director
Director Director
147 Strong Commitment from Shareholders
Shareholding Structure – per 30 Apr 2014
Public
65.20% (*) 30.15% 4.65%
Barito Pacific Siam Cement Group
An Indonesian-based business group headquartered Thailand’s largest industrial conglomerate and Asia’s
in Jakarta. leading chemicals producer.
Engaged in a diversified range of business, including Invested in CAP in 2011 through acquiring 30% of CAP
petrochemical, property, and palm plantations. from Barito Pacific and Temasek.
Listed on IDX since 1993. Long-term Shareholder with substantial experience
Majority Shareholder is Prajogo Pangestu. and expertise in petrochemicals committed to
supporting the development of the business.
Notes: (*) Including CAP ownership which are owned by Marigold Resources Pte. Ltd. and Magna Resources Corp. Pte. Ltd.
15II. Petrochemicals Industry Updates
16Strong Demand Growth in Indonesia
Demand of petrochemical products will remain strong in several periods ahead. Petrochemical products are fundamental to
production of a wide variety of consumer and industrial products, such as packaging materials, containers, and storage materials.
Total Demand Growth
End Markets CAGR (2013 – 2019)F
Plastic films Indonesia Global
Containers 5,0%
Polyethylene Bottles
4,6%
Plastic bags
Packaging
Films and sheets 5,1%
Polypropylene Fibers and filaments
4,7%
Toys
Automotive parts
Drinks cups 5,6%
Styrene Food containers
3,0%
Monomer Car interiors
Helmet padding
Vehicle tires 4,3%
Butadiene Synthetic rubber 3,1%
Gloves and footwear
Source: Nexant , Sep 2013
17Dominant Market Positions in Indonesia
Retains its dominant position as market leader in many categories of petrochemical products in Indonesia. The only
producer of Ethylene, Styrene Monomer, and Butadiene.
1 Largest Petrochemical Company in Indonesia(1) Top 10 Largest Polyolefins Producers in South East Asia
Ethylene (2012) Polyethylene (2012)
Import Import
53% 27% CAP
31%
CAP
47%
Others
42%
Total Demand: 1.28 million ton Total Demand: 1.06 million ton 6
Polypropylene (2012) Styrene Monomer (2012)
Import CAP
45% 29%
CAP
100%
Others
26%
Total Demand: 1.66 million ton Total Demand: 0.16 million ton
Source: Nexant, Sep 2013 Source: Nexant, Sep 2013
18
Notes: (1) Exclude fertilizer producersIII. Financial & Operational Performance
19Trend of Sales and Production Volume
Ethylene (1) Polyethylene
KT KT Sales Volume Production Volume
Sales Volume Production Volume
600 600
450 450
567
300 596 300
468 531
150 150 325 284 330 321 317
201 322 293 337
181 129 120
0 0
2010 2011 2012 2013 2010 2011 2012 2013
Polypropylene Styrene Monomer
KT
Sales Volume Production Volume KT Sales Volume Production Volume
600 600
450 450
458 458
300 461 471 300
410 329
382 380 416 305 309 302 326
322
259 254
150 150
0 0
2010 2011 2012 2013 2010 2011 2012 2013
Note: (1) The additional ethylene produced is consumed internally to produce polyethylene.Financial Highlights
31 December 2013 31 December 2012
Changes
Audited Audited
US$'000 US$'000 %
Balance Sheet
• Cash and cash equivalents 241,873 123,393 96%
• Current Assets 569,810 571,456 -0.3%
(exclude Cash and cash equivalents)
• Non Current Assets 1,095,755 992,266 10.4%
Total Assets 1,907,438 1,687,115 13.1%
• Current Liabilities 617,699 484,305 27.5%
• Non Current Liabilities 434,416 481,980 -9.9%
• Equity 855,323 720,830 18.7%
Total Liabilities and Equities 1,907,438 1,687,115 13.1%
31 December 2013 31 December 2012
Changes
Audited Audited
US$'000 US$'000 %
Income Statements
• Net Revenues 2,506,414 2,285,158 9.7%
• Gross Profit 98,044 22,789 330.2%
• Net Income (Loss) For The Year 11,030 (87,213) 112.6%
• EBITDA 107,180 21,186 405.9%
21IV. Strategic Initiatives
22Attractive Industry Fundamentals: petrochemical industry is expected to
enter recovery cycle
Petrochemical industry profitability to continue on path of sustainable recovery post 2012 as a result of improving demand. Fewer
capacity start-ups are scheduled over 2013-2016 resulting in improve profitability. Industry margin to climb to a new peak around
2016-2017.
Ethylene price spreads over Naphtha
23
Source: Nexant, Sep 2013Key Strategic Initiatives
1. Enhance cash flows from ramp-up of Butadiene plant.
2. Ensure timely completion of Naphtha Cracker expansion.
3. Continuing the implementation phase of JV with Michelin to build Styrene
Butadiene Rubber plant (“SBR”).
4. Continuing the operation and cost reduction initiatives in order to further
improve the performance while utilizing the potential synergies with the
SCG.
5. Optimizing human capital through human resource development
programs based on competency.
24Butadiene Plant
• Construction of Butadiene plant started in
2011 and operates since 4Q-2013.
• Investment cost US$130 million.
• Capacity 100 KTPA.
25Cracker Expansion Project in Brief
1. To increase economics scale of total production.
2. Maintain leading position in fulfilling the demand growth in Indonesia.
3. To strengthen profitable Polypropylene portfolio competitiveness.
4. To integrate downstream petrochemical industries.
26Cracker Expansion Project
Overview Ethylene Propylene Mixed C4
Planned Cracker expansion is to in KTA (Kilo-Tonnes per Annum)
take advantage of significant
Ethylene shortage in Indonesia. Capacity 600 320 220
New production capacity is
expected to operates in 2015. Current
Capacities Requirement 430 480 220
Surplus of Ethylene production
will be sold to local Indonesian
Surplus/(Deficit) 170 (160) 0
customers.
This project is prepared to face
the peak industry condition
which is expected to happen in 860
2016. Capacity 470 315
Project cost: US$380 million. Capacities
Post
480 315
Cracker Requirement 430
Expansion
Surplus/(Deficit) 430 (10) 0
27Synthetic Butadiene Rubber
• Type of Business : Joint Venture – CAP (45% through PBI) and Michelin (55%).
PT Synthetic Rubber Indonesia.
• Technology : Proprietary Technology (low technology risk).
• Start-up : 4Q2016 – 1Q2017.
• Investment cost : US$435 million.
• CAP rationale investment:
Butadiene downstream integration.
Entering new business with high business potential – synthetic rubber business.
Strengthen relationship with world-class partner as the technology provider.
28Refinancing Structure
• Conducted PUT I with HMETD (“rights issue”) on October 2013 by issuing
220,766,142 new shares.
• The proceeds amounted to US$127.9 million at the end of rights issue in
Rights Issue
November 2013 will be used largely to finance Naphtha Cracker expansion and
also equity injection of PT Synthetic Rubber Indonesia, joint venture with
Michelin, to build Styrene Butadiene Rubber plant.
• Signed Term Loan Facility Agreement – 7 years on 5 December 2013, amounting
to US$265 million through club deal basis with various local and international
Term Loan
banks.
Facility (New)
• The loan will be used to finance the capital expenditure of Naphtha Cracker
expansion which is estimated to cost US$380 million.
• Term Loan Facility amounted to US$150 million - 7 years through syndication
from various local and international banks, which is used to finance the
Term Loan construction of Butadiene plant. The agreement was signed on November 2011.
Facility • Term Loan Facility amounted to US$220 million – 7 years through syndication
(Current) from Siam Commercial Bank PCL and Bangkok Bank PCL, which is used for
refinancing Senior Secured Guaranteed Notes. The agreement was signed on
September 2012.
29Thank You Address: Contact: PT Chandra Asri Petrochemical Tbk Investor Relations Wisma Barito Pacific Tower A, Lt. 7 Email: investor-relations@capcx.com Jl. Let. Jend. S. Parman Kav. 62-63 Tel : +62 21 530 7950 Jakarta 11410 Fax: +62 21 530 8930 Visit our website at www.chandra-asri.com Disclaimer: Important Notice • This document was prepared solely and exclusively for the parties presently being invited for the purpose of discussion. Neither this document nor any of its content may be reproduced, disclosed or used without the prior written consent of PTChandra Asri Petrochemical Tbk. • This document may contain statements that convey future oriented expectations which represent the Company’s present views on the probable future events and financial plans. Such views are presented on the basis of current assumptions, are exposed to various risks and are subject to considerable changes at any time. Presented assumptions are presumed correct, and based on the data available on the date, which this document is assembled. The company warrants no assurance that such outlook will, in part of as a whole, eventually be materialized. Actual results may diverge significantly from those projected. The information in this document is subject to change without notice, its accuracy is not verified or guaranteed, it may be incomplete or condensed and it may not contain all material information concerning the Company. • None of the Company, PT Chandra Asri Petrochemical Tbk or any person connected with any of them accepts any liability whatsoever for any loss howsoever arising from any use of this document or its contents or otherwise arising in connection therewith. 30
You can also read