PUBLIC SERVICE CURRICULUM PROJECT TAKEAWAYS - Paul C. Light with Jie Ding NYU Wagner School of Public Service
←
→
Page content transcription
If your browser does not render page correctly, please read the page content below
PUBLIC SERVICE CURRICULUM PROJECT TAKEAWAYS

            Paul C. Light with Jie Ding
         NYU Wagner School of Public Service

           *Word cloud of public service school names in the top 55
            schools ranked by U.S. News and World Report, 2020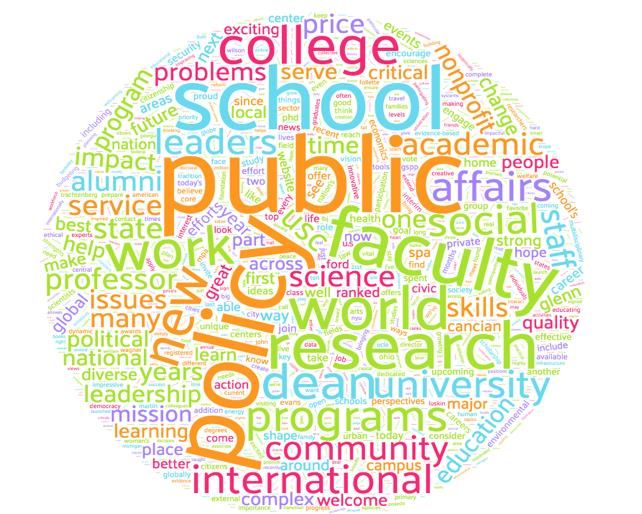
TABLE OF CONTENTS

A: INTRODUCTION

B. TRENDS, SOURCES, AND TOPLINE MEASURES

C. SPREADSHEETS

  I.    Organizational demographics

  II.   Operations and Impact

D. CORE QUESTIONS:

  I.    Where is the education occurring?

        1. Named school or not
        2. Morrill land-grant university or not
        3. East or west of the Mississippi River

  II.   How do the schools rank?

        4. U.S. News & World Report ranking
        5. Change in the U.S. News & World Report ranking
        6. Website usability score

                                                    1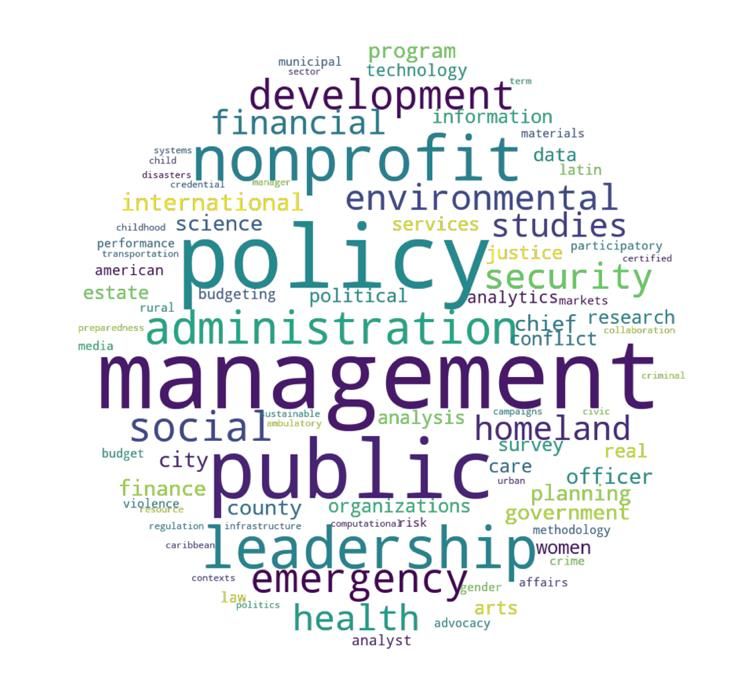
III.   Who is doing the teaching?

       7. Average percentage of female and male faculty
       8. Average percentage of white and faculty of diversity
       9. Field of doctoral study among tenure and tenure track faculty

IV.    Who is doing the learning?

       10. Average percentage of women and men graduates
       11. Average percentage of white and graduates of diversity
       12. Average percentage of federal loan borrowers and non-borrowers
       13. Average mean loan debt in dollars
       14. Average percentage of schools with at least one-fourth of international students

V.     How are students learning?

       15. Average percentage of schools with fixed/flex core courses
       16. Average number of required courses
       17. Average number of specializations
       18. Average percentage of schools with five core courses or more
       19. Average percentage of econ, quant, and management science courses
       20. Average percentage of strategy + structure courses
       21. Average percentage that of schools that require internships
       22. Average percentage that require a thesis
       23. Average percentage that offer a joint degree(s)
       24. Average percentage with a significant social innovation curriculum score

                                                       2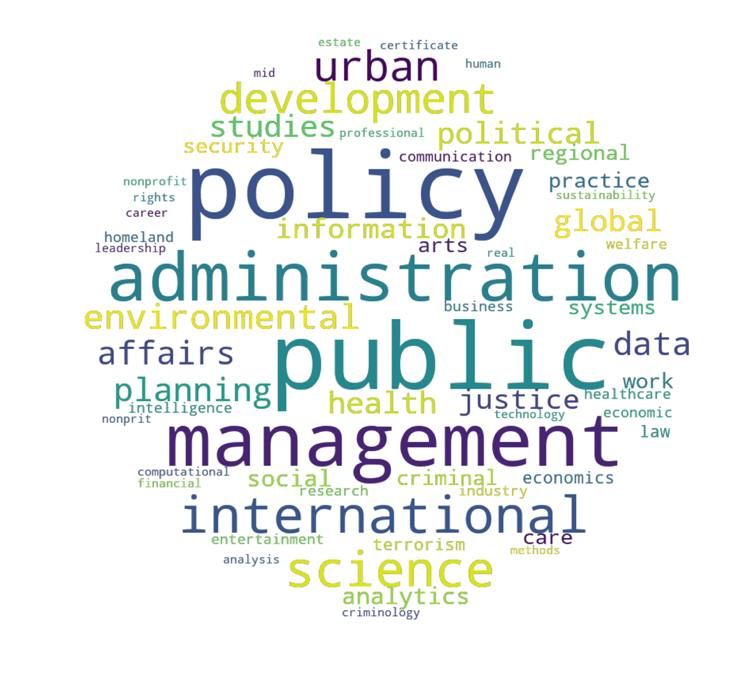
VI.   How does the learning progress?

       25. Average percentage with flexible (part-time) learning options
       26. Average number of master’s degree programs
       27. Average percentage of schools with advanced certificate programs
       28. Average percentage of schools with undergraduate programs
       29. Average percentage that offers at least some online coursework

 VII. What is the impact?

       30. Website coverage of covid-19
       31. Website coverage of social justice issues
       32. Overall current events coverage
       33. Average number and percentages of graduate degrees conferred
       34. Average percentage of first jobs in government, non-profit, or private sector
       35. Average median first-year earnings

CONCLUSION

                                                       3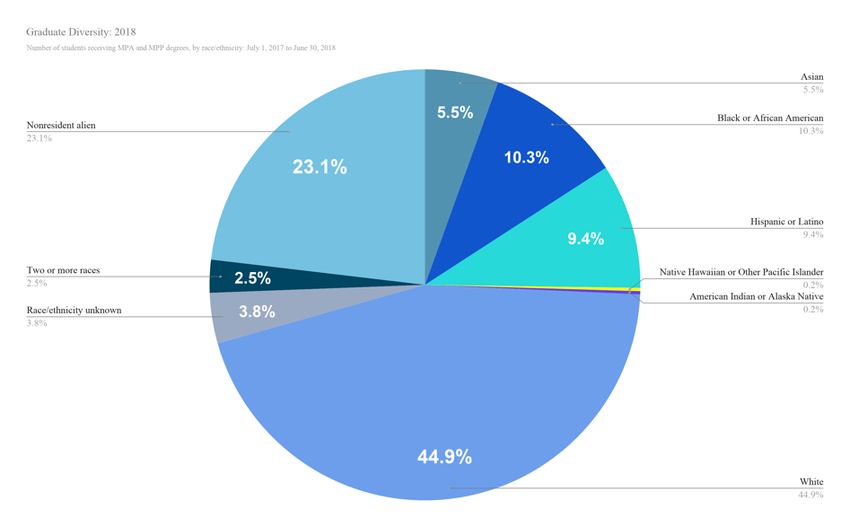
A. INTRODUCTION

This report provides a broad portrait of the state of public service education today. It is built upon data collected
from a range of sources described below, and provides an overview of basic questions about the nation’s top public
affairs schools as ranked by U.S. News & World Report in 2019. The project was supported by the Volcker
Alliance and NYU’s Robert F. Wagner School of Public Service. The project began in late 2019 with an early
analysis of the U.S. News top 25 schools and expanded to 77 schools in May 2020.

Readers should note that the list of top schools includes ties. In the 2020 rankings, for example, there were 12
schools in the top ten, with two schools ranked at number 1, three at number 2, two at number 6, two at 8, and three
at 10. Readers should note that the 77 schools covered in this report account for less than a third of the 275 schools
ranked in 2020, but almost half of the students who graduated in the class of 2018-2019. As the word clouds below
show, they also account for a remarkable range of degree names and certificate titles. Readers are encouraged to
benchmark their own schools as they wish by simply adding their own percentages and counts to the tables
presented below. Each table also contains a key finding highlighted in torquiose and summarized as a takeaway
after the table is presented.

This report provides data on seven questions about public service education:

      1. Where is the education occurring? Here, the research team focused on simple measures of location and
         status—east or west of the Mississippi, in a school named in honor of someone, and in a land grant
         university tasked under the law with a public-service purpose. (The data sources and topline variables
         used to build the topline tables are summarized in the text boxes below.)

      2. How are the schools ranked against their peers? Here, the research team created three roughly-equal tiers
         between the top and bottom of the rankings and a very simple indicator of the most recent rankings and

                                                          4
movement up and down the levels over the past decade. This analysis also includes an assessment of
   website usability based on a simple version of user-centered heuristics.

3. Who is doing the teaching? These data focus solely on tenure and tenure-track faculty, thereby excluding
   adjuncts, lecturers, visiting faculty, professors of practice, emeritus faculty, clinical, honorary, and part-
   time professors. The research team pursued three measures of diversity across the schools: (1) gender, (2)
   race, and (3) doctoral field of study. Information on all three measures of who is doing the teaching
   among the 2,500 faculty identified as tenured or tenure-track was collected through hand-coding of
   faculty biographies, website information, dictionaries of last names, photos, and pronoun use/preferences,
   and further internet searches as needed. Following the Network of Schools of Public Policy, Affairs, and
   Administration (NASPAA) benchmarking history, this study refers to faculty and student race as either
   white or “persons of diversity.”

4. Who is doing the learning? Here, the research team focused largely on student diversity with just one
   question on student borrowing. The student diversity data for the 77 schools comes from the National
   Center for Education Statistics database for the academic year 2018-2019, which included a nine-
   category racial diversity variable, while the Department of Education College Scorecard database
   provided the data on the number of “federally-aided students completing college.” This measure refers to
   students who borrowed from the federal government at some point in their college careers, either before
   and/or during graduate school. The data on the percentage of international students in each program also
   comes from the Center’s count of “non-resident aliens.”

5. How are students learning? Most of the data on the organization of learning across the 77 schools came
   from hand-coding of websites and program descriptions, including the number of required courses, the
   type of core curriculum (flex or fixed), number of MPA and MPP specializations across MPA. Additional
   information on the average percentages of econ/quant courses, graduation requirements, and joint
   curricular options came from the Atlas of Management database, while the number of schools with

                                                    5
significant curricular content and activity on social innovation was built on hand-coding of available
records.
6. How is learning organized? Data on learning options such as the number of masters programs, number of
certificate programs, undergraduate options, and online options were collected from websites. Additional
information on full-time and part-time learning came from the NASPAA database, which was
supplemented for the non-accredited programs through hand-coding.
7. What is the impact? The ultimate impact of public-service education is difficult to measure in the kind of
data fields presented here, but the project team narrowed the search to the number of graduates, first jobs,
first-year earnings. The data on the number of graduates and first-year earnings came from the National
Center for Education Statistics, while the first-job destinations came in part from the NASPAA database
of accredited schools, albeit heavily augmented by direct requests to deans and program directors. As the
final table in this topline report shows, almost one-third of the top 77 schools either could not or would
not provide data on where students started their post-graduate careers.
6WHAT’S IN A NAME: DEGREES AND CERTIFICATES
*Word clouds of 116 master’s degree titles (left) and 105 certificate titles (right) from the top 32 schools in
2019. These word clouds contain the names of all degrees and certificates such as social work, criminal
justice, and data analytics that are housed within the 32 schools but are not part of the analysis of the public
service degrees discussed in this analysis. As such, the clouds demonstrate the range of programs in many
of the nation's top-ranked public service programs.
7Readers are encouraged to consult Table 1 for recent trends in public service education. According to data from
the National Center for Educational Statistics, recent trends show a flattening of interest in public-service fields
such as public administration, public policy, and social work, a steep decline in law and a flattening in business
administration. As the table shows, enrollments surged in the lead up to the Great Recession and the arrival of
Obamacare, continued to rise from 2009-2013 and were beginning to stall before the Trump administration
arrived. The number of universities offering public administration and policy degrees has grown slightly in recent
years, but the number of degrees has dropped slightly.
Readers are also encouraged to review Table 2 for an inventory of the data sources used in this report and Table 3
for a brief introduction to the five variables used to structure the tables presented in this inventory. Much of the
work involved hand-coding of program websites, faculty biographies, and informal requests to the schools for
information on student destinations and copies of core syllabi. Readers are free to compare their own programs to
the different types of public service programs described in the tables by simply penciling in their own statistics to
the open row at the bottom of each data table presented below.
8B. TRENDS, SOURCES, AND TOPLINE MEASURES
TABLE 1: TRENDS IN PUBLIC-SERVICE EDUCATION, 2004-2018
Degrees
Degrees Degrees Degrees
conferred 2004- 2013- 2018-
conferred July conferred July conferred July 1,
Degree type Degree activity July 1, 2017 2013: 2018: 2020:
1, 2004 to 1, 2008 to 2012 to June 30,
to June 30, change change change
June 30, 2005 June 30, 2009 2013
2018
Master of # of Universities offering degree 280 304 368 388 31.4% 5.4%
Public # of degrees conferred 9,055 9,988 13,605 12,236 50.2% -10.1%
Administration Average # of degrees conferred 32 33 37 32 14.3% -14.7%
# of Universities offering degree 50 67 83 107 66.0% 28.9%
Master of
# of degrees conferred 1,866 2,209 2,990 2,935 60.2% -1.8%
Public Policy
Average # of degrees conferred 37 33 36 27 -3.5% -23.9%
Public Service # of Universities offering degree 311 344 431 446 38.6% 3.5%
Degrees Total # of degrees conferred 10,921 12,197 16,595 15,171 52.0% -8.6%
(MPA + MPP) Average # of degrees conferred 35 35 39 34 9.6% -11.7%
# of Universities offering degree 204 209 218 218 6.9% 0.0%
Juris Doctor # of degrees conferred 44,003 44,703 47,544 34,820 8.0% -26.8%
Average # of degrees conferred 216 214 218 160 1.1% -26.6%
Master of # of Universities offering degree 871 959 1,157 1,200 32.8% 3.7%
Business # of degrees conferred 88,975 105,617 126,035 125,137 41.7% -0.7%
Admin Average # of degrees conferred 102 110 109 104 6.6% -4.3%
Master of # of Universities offering degree 155 207 247 324 59.4% 31.2%
Health Admin, # of degrees conferred 3,443 5,305 7,497 10,166 117.7% 35.6%
etc. Average # of degrees conferred 22 26 30 31 36.6% 3.4%
# of Universities offering degree 175 212 276 367 57.7% 33.0%
Master of
# of degrees conferred 6,406 8,336 11,384 14,933 77.7% 31.2%
Public Health
Average # of degrees conferred 37 39 41 41 12.7% -1.4%
# of Universities offering degree 200 227 252 318 26.0% 26.2%
Master of
# of degrees conferred 17,024 19,388 23,675 29,700 39.1% 25.4%
Social Work
Average # of degrees conferred 85 85 94 93 10.4% -0.6%
9TABLE 2: DATA SOURCES
1. U.S. Department of Education, National Center for Education Statistics (NCES), 2018-2019 provisional
database from the Integrated Postsecondary Education Data System (IPEDS), including school status,
location, participation in federal student aid programs, degrees awarded, student race, and gender.
2. U.S. Department of Education College Scorecard database on student finances such as earnings, debt
load, and debt repayment for 2015-2016 and 2017-2018. The data used in this topline were accessed in
April 2020.
3. The Atlas of Public Management database for the core course distribution in leading MPP and MPA
programs for a multi-year research project published in 2015. The databases on course types were built
in a multi-year research project funded by the Government of Canada.
4. Occasional contacts with deans and program directors to collect information on first full-time job
destinations for the most recent graduate classes, core curriculum requirements, and fill in missing data
from other databases.
5. Publicly available data on accreditation, some student destinations, online learning options, and
program details from the National Association of Schools of Public Affairs and Administration
(NASPAA) Data Center.
6. Hand-coding of school websites to collect core-syllabi, specialization and degree names, learning
options, faculty names, race, gender, and Ph.D. field of study.
10TABLE 3: TOPLINE MEASURES
1. School status: Is the school part of a public or private institution?
2. School type: Does the school only offer a Masters of Public Administration (MPA) degree, only a
Masters of Public Policy (MPP) degree, or both (blended)?
3. NASPAA accredited: Does the school have a degree program accredited by the National Association
of Schools of Public Affairs and Administration (NASPAA)?
4. Top 25 ranking. Is the school ranked among the top 25 by U.S. News & World Report in its 2020 “Best
Graduate Public Affairs Programs” issue?
5. Percent of schools whose graduates have the heaviest debt loads (above average): Is the College
Scorecard mean federal loan debt for all MPA and/or MPP degree holders from the Academic Year
2015-2016 and Academic Year 2016-2017 cohort in each school above the mean for all 77 covered by
the analysis?
11C. CORE SPREADSHEETS
The spreadsheets used in this analysis were created through the data mining of the sources listed above. Some of
the data is fully public, others are confidential to the schools, and still others are the product of outreach to specific
schools. As a result, some of the data revealed in this topline report are fully anonymized to product the schools,
while other data are open for public review.
121. Organizational Demographics (not anonymized; some data only available for first 32 schools)
1314
2. Operations and Impact (schools are anonymized)

                       15
16
I.       WHERE IS THE EDUCATION OCCURRING?

       1) Named School or not (e.g., Kennedy School of Government, Robert F. Wagner School)

                                                                                                           Schools whose
                                                                            NASPAA                       graduates have the
                            Status                    School Type                         Top 25
   Named       Totals                                                      Accredited                    heaviest debt loads
   School     (N=77)                                                                                      (above average)
                        Public        Private   PA       PP     Blended    Yes    No    Yes    No       Yes      No      N/A
    No
               52%      59%            32%      65%     46%         37%    56%    40%   31%    67%     34%      59%      86%
 Namesake
   With
               48%      41%            68%      35%     54%         63%    44%    60%   69%    33%     66%      41%      14%
 Namesake
   Totals
               100%     75%            25%      48%     17%         35%    74%    26%   42%    58%     38%      53%      9%
  (N=77)

*Hand-coding of school websites
**The term “Schools whose graduates have the heaviest debt loads (above average)” is built off the U.S. News
“2021 Most Debt National Universities” report

One-third of schools that only offer an MPA had a namesake on their masthead, compared to much higher percentages of schools that
offered an MPP only or both MPA and MPP degrees (Blended).

Two-thirds of schools with mean federal student debt loads above average have namesakes, compared with 41 percent of schools with
mean federal student debt loads below average.

                                                                      17
2) Morrill Land-grant University or not (e.g., University of Minnesota, Cornell University)
18Schools whose
NASPAA graduates have the
Status School Type Top 25
Named Totals Accredited heaviest debt loads
School (N=77) (above average)
Public Private PA PP Blended Yes No Yes No Yes No N/A
Land-grant 23% 29% 5% 24% 23% 22% 25% 20% 22% 24% 10% 32% 29%
Non-land-
77% 71% 95% 76% 77% 78% 75% 80% 78% 76% 90% 68% 71%
grant
Totals
100% 75% 25% 48% 17% 35% 74% 26% 42% 58% 38% 53% 9%
(N=77)
*Data from National Center for Education Statistics and hand-coding for confirmation
One-tenth of schools with the mean student debt load above average was founded as land-grant institutions, while one-third with mean
federal student loan debt load below average are land-grant institutions.
193) East or West of the Mississippi River
Schools whose graduates
NASPAA
Status School Type Top 25 have the heaviest debt
Named Totals Accredited
loads (above average)
School (N=77)
Public Private PA PP Blended Yes No Yes No Yes No N/A
East 68% 67% 68% 78% 69% 52% 67% 70% 59% 73% 66% 68% 71%
West 32% 33% 32% 22% 31% 48% 33% 30% 41% 27% 34% 32% 29%
Totals
100% 75% 25% 48% 17% 35% 74% 26% 42% 58% 38% 53% 9%
(N=77)
*Data from National Center for Education Statistics and hand-coding for confirmation; main campus only
About half of the schools that offered both the MPA and MPP were located west of the Mississippi, compared to one-fifth that offered
the MPA only.
2021
II.   WHERE DO THE SCHOOLS RANK?

       1) U.S. News & World Report ranking, 2019

                                                                                                          Schools whose
                                                                       NASPAA                           graduates have the
                            Status               School Type                             Top 25
               Totals                                                 Accredited                        heaviest debt loads
  Ranking
              (N=77)                                                                                     (above average)
                        Public   Private   PA       PP    Blended     Yes     No      Yes      No      Yes      No      N/A

    Tier 1     42%      34%       63%      32%     46%         52%    42%    40%     100%      0%      66%     27%      29%

    Tier 2     31%      33%       26%      30%     31%         33%    32%    30%       0%     53%      10%     44%      43%

    Tier 3     27%      33%       11%      38%     23%         15%    26%    30%       0%     47%      24%     29%      29%
    Totals
               100%     75%       25%      48%     17%         35%    74%    26%      42%     58%      38%     53%      9%
   (N=77)

*Tier 1= programs rated at levels 1-25 (N=32); Tier 2= programs rated at 33- 49 (N=25); Tier 3= programs rated at
58-72 (N=20)

Half of the schools that offered both MPA and MPP degrees (Blended) were ranked in tier 1 by U.S. News, compared with one-third of
the schools offering only MPA degrees.

                                                                 22
23
2) Change in the U.S. News & World Report ranking levels, 2008 v. 2019

                                                                                                              Schools whose
                                                                         NASPAA                             graduates have the
                             Status               School Type                               Top 25
   Ranking      Totals                                                  Accredited                          heaviest debt loads
    Trend      (N=32)                                                                                        (above average)
                         Public   Private   PA       PP     Blended    Yes      No       Yes      No       Yes      No      N/A

  Increase      22%      35%       0%       33%      0%         21%    29%      0%       22%      0%      21%      27%      0%

   Steady       59%      50%       75%      58%     50%         64%    63%      50%      59%      N/A     68%      45%      50%

  Decrease      19%      15%       25%      8%      50%         14%     8%      50%      19%      0%      11%      27%      50%
    Totals
               100%      63%       38%      38%     19%         44%    75%      25%     100%      0%      59%      34%      6%
   (N=32)

*The rise and fall in ranking levels are calculated by comparing the 2008 U.S. News and 2020 results; an increase
or decrease is defined as up or down five levels/spots or more

Half of the schools that only offer the MPP fell more than five spots in the U.S. News rankings between 2008 and 2019, while the MPA
and blended schools generally held steady.

                                                                  24
3) Website usability heuristics score (3-way)
25Schools whose graduates
NASPAA
Status School Type Top 25 have the heaviest debt
Website Totals Accredited
loads (above average)
Usability (N=77)
Public Private PA PP Blended Yes No Yes No Yes No N/A
Greater than
14% 14% 17% 11% 8% 21% 14% 15% 24% 7% 14% 16% 0%
2
1 to 2 64% 64% 61% 61% 77% 61% 63% 65% 55% 70% 69% 56% 100%
Lower than 1 22% 22% 22% 28% 15% 18% 23% 20% 21% 23% 17% 28% 0%
Totals
100% 77% 23% 47% 17% 36% 74% 26% 43% 57% 38% 56% 6%
(N=77)
*Score runs from low to high based on an analysis of user-centered heuristics
There was relatively little variation in website usability scores across all 77 schools, but schools that offered the MPA only had the
lowest website scores, while schools that offered both the MPA and MPP (blended) had modestly higher scores.
Schools with the mean federal student loan debt above average and that offer only MPA degrees had somewhat lower website usability
scores.
2627
III. WHO IS DOING THE TEACHING?

       1) Average percentage of female and male faculty

                                                                                                         Schools whose
              Average
                                                                        NASPAA         Top 25 (32      graduates have the
              among           Status             School Type
    Faculty                                                            Accredited       schools)       heaviest debt loads
                all
    Gender                                                                                              (above average)
              schools
              (N=77)     Public Private     PA      PP     Blended    Yes      No      Yes     No      Yes     No      N/A

    Women       39%       42%      31%     43%     36%         36%    41%     35%     37%     40%     36%     43%     34%

     Men        61%       58%      69%     57%     64%         64%    59%     65%     63%     60%     64%     57%     66%

*Data from hand-coding of faculty profiles on school websites (faculty n=2,500 across the 77 schools)

Private schools and schools that offer the MPP only and the MPP and MPA (blended) had more male tenured and tenure-track faculty
members than their peers.

                                                                28
29
2) Average percentage of white faculty and faculty of diversity

                Average                                                                                           Schools whose
                among                                                          NASPAA             Top 25 (32    graduates have the
     Faculty                    Status               School Type
                  all                                                         Accredited           schools)    heaviest debt loads
    Diversity
                schools                                                                                          (above average)
                (N=77)     Public   Private     PA       PP     Blended      Yes       No         Yes    No    Yes     No      N/A
   Faculty of
                  24%       26%       19%      26%      22%        22%      26%       20%         24%   24%    24%    25%     21%
   Diversity
     White
                  76%       74%       81%      74%      78%        78%      74%       80%         76%   76%    76%    75%     79%
     Faculty

*Data from hand-coding of faculty profiles on school websites
**Data on faculty diversity come from faculty directories, LinkedIn, ResearchGate, Google Scholar profiles, and
personal websites that do not disclose nationalities.
***The term “faculty of diversity” extends the NASPAA Data Center’s use of the term “persons of diversity” to
describe all non-white students.

About one out of five tenured/tenure-track faculty in private schools are faculty of diversity.

                                                                    30
3) Field of doctoral study among tenured/tenure-track faculty
Average Schools whose
Faculty among NASPAA Top 25 (32 graduates have the
Status School Type
Educational all Accredited schools) heaviest debt loads
Background* schools (above average)
(N=77) Public Private PA PP Blended Yes No Yes No Yes No N/A
Political Science 21% 21% 23% 19% 22% 25% 19% 27% 19% 23% 22% 18% 41%
Public
22% 27% 6% 32% 5% 16% 28% 3% 15% 26% 12% 30% 8%
Administration
31Economics 16% 11% 31% 9% 28% 19% 11% 29% 24% 10% 22% 11% 15%
Public Policy 10% 12% 6% 11% 8% 11% 11% 7% 12% 9% 11% 10% 7%
*Hand-coding of tenure/tenure track faculty profiles on school websites, LinkedIn profiles, and faculty websites
*Additional fields of study across the 77 schools
Computer Science,
Relations/Affairs
Civil Engineering
Urban Planning
Other (Biology,
Public Health
International
Environment
Psychology
Geography
Education
Sociology
Business
History
etc.)
Law
7% 6% 5% 3% 3% 2% 2% 1% 1% 1% 1% 1% 1%
The ratio of tenured/tenure-track professors with a Ph.D. degree in economics versus a public administration is 6 to 1 in schools
offering only MPP degree, but drops to 1 to 4 in schools offering only MPA degrees.
The ratio of tenured/tenure-track professors with a Ph.D. in economics versus public administration is 10 to 1 in non-NASPAA
accredited schools, but 1 to 6 in NASPAA accredited schools.
The percentage of political scientists among tenured/tenure-track professors is similar across all types of schools.
The percentage of tenured/tenure-track professors with a Ph.D. degree in Public Administration is higher in schools with mean
student debt loads below average.
3233
IV. WHO IS DOING THE LEARNING?

       1) Average percentage of women and men graduates

                                                                                                              Schools whose
                                                                         NASPAA            Top 25           graduates have the
               Totals       Status               School Type
    Gender                                                              Accredited       (32 schools)       heaviest debt loads
              (N=77)                                                                                         (above average)
                        Public   Private   PA       PP     Blended     Yes      No       Yes      No       Yes      No       N/A

   Women       59%      60%       57%      60%     60%         59%     59%      59%      57%     61%      58%        60%   63%

     Men       41%      40%       43%      40%     40%         41%     41%      41%      43%     39%      42%        40%   37%

       *Data from the National Center for Education Statistics

The percentage of women graduates is consistent at about 60 percent among all types of public and private schools.

                                                                 34
35
36
37
2) Average percentage of white graduates and graduates of diversity

                                                                                                             Schools whose
                                                                           NASPAA            Top 25        graduates have the
                Totals        Status               School Type
    Race                                                                  Accredited       (32 schools)    heaviest debt loads
               (N=77)
                                                                                                            (above average)
                          Public   Private   PA       PP     Blended     Yes       No      Yes     No      Yes     No      N/A
 Graduates
    of          38%       37%       39%      40%      38%        35%     38%      39%     35%     38%      42%     35%     31%
 Diversity
   White
                62%       63%       61%      60%      62%        65%     62%      61%     65%     62%      58%     65%     69%
 graduates

   *Data from the National Center for Education Statistics, N=7,100 students across the 77 schools
   **Number of graduates excludes international students

Student diversity is at its highest in schools with mean federal student loan debt above average and schools that offer the PA degree,
and lower among schools that offer the MPA and MPP (blended), and among schools that have the lowest mean student loan debt.

                                                                  38
39
3) Average percentage of federal loan borrowers and non-borrowers

                                                                                                          Schools whose
  Federal                                                                NASPAA         Top 25          graduates have the
            Totals        Status               School Type
   Loan                                                                 Accredited    (32 schools)      heaviest debt loads
           (N=77)                                                                                        (above average)
 Borrowers
                      Public   Private   PA       PP     Blended        Yes    No     Yes      No      Yes      No      N/A
   Non-
              57%      56%      60%      53%     66%         57%        53%    68%    59%     55%      49%     56%      95%
 Borrower

 Borrower     43%      44%      40%      47%     34%         43%        47%    32%    41%     45%      51%     44%      5%

       *Data from the Department of Education College Scorecard

The percentage of federal loan borrowers is 47 percent in both NASPAA-accredited schools and schools that offer MPA degrees only,
which is higher than schools that offer MPP degrees only.

                                                                   40
41
4) Average mean loan debt in dollars

                                                                                                                        Schools whose
  Mean
                                                                                                                     graduates have the
 Federal    Totals        Status                    School Type             NASPAA Accredited       Top 25
                                                                                                                     heaviest debt loads
  Loan     (N=77)
                                                                                                                       (above average)
  Debt
                     Public     Private     PA         PP         Blended     Yes       No       Yes         No      Yes       No      N/A

 Average   $45,327   $40,107   $60,696    $42,120    $56,400      $45,516   $42,977   $52,792   $52,179   $35,437   $59,651   $35,366   N/A

       *Data from NCES and the Department of Education College Scorecard

The average mean federal student loan debt for private schools is 1.5 times higher than public schools. The average is also 1.2 times
higher in schools that offer the MPP only compared with schools that offer the MPA only and MPA/MPP (blended).

                                                                    42
43
5) Average percentage of schools with at least one-fourth of enrollment from international students

                                                                                                                   Schools whose
                                                                              NASPAA                            graduates have the
 International Totals          Status               School Type                                  Top 25
                                                                             Accredited                         heaviest debt loads
   Students    (N=77)                                                                                             (above average)
                          Public   Private     PA        PP     Blended     Yes       No       Yes      No      Yes     No      N/A
   25% and
                  25%      16%       53%      19%       38%       26%       19%      40%      31%      20%      41%     10%      43%
    above

  Below 25%       75%      84%       47%      81%       62%       74%       81%      60%      69%      80%      59%     90%      57%

     Totals
                 100%      75%       25%      48%       17%       35%       74%      26%      42%      58%      38%     53%      9%
    (N=77)

*Data from NASPAA website reporting

The percentage of schools with over one-fourth of international students is 53 percent in private schools, 3.3 times that of public schools.

                                                                    44
V. HOW ARE STUDENTS LEARNING?
1) Average percentage of schools with fixed core courses v. flex core courses
Schools whose
Type of NASPAA graduates have the
Totals Status School Type Top 25
Core Accredited heaviest debt loads
(N=77)
Curriculum (above average)
Public Private PA PP Blended Yes No Yes No Yes No N/A
Fixed 42% 45% 32% 57% 31% 26% 46% 30% 16% 60% 28% 49% 57%
Flex 58% 55% 68% 43% 69% 74% 54% 70% 84% 40% 72% 51% 43%
Totals
100% 75% 25% 48% 17% 35% 74% 26% 42% 58% 38% 53% 9%
(N=77)
*Data from hand-coding of school websites
Schools with student debt loads above average have a higher percentage of flex cores, while schools that offer the MPA have a lower
percentage.
4546
2) Average number of required courses

                                                                                                           Schools whose
                                                                      NASPAA            Top 25          graduates have the
    Core      Totals         Status             School Type
                                                                     Accredited       (32 schools)      heaviest debt loads
   Courses   (N=77)                                                                                      (above average)
                       Public    Private   PA      PP     Blended    Yes     No       Yes      No      Yes      No       N/A
  Average
                10       9            13   9       10         12     10       11      12       8       12       9        7
  Number

       *Data from hand-coding of school websites

Private schools, programs that offer MPP and MPA degrees, top-25 ranked schools, and schools with mean student debt loads above
average have a higher number of required courses.

                                                               47
3) Average number of specializations in MPA and MPP programs
Schools whose
NASPAA Top 25 graduates have the
Status School Type
Totals Accredited (32 schools) heaviest debt loads
Specialization
(N=32) (above average)
Public Private PA PP Blended Yes No Yes No Yes No N/A
MPA 2 2 1 3 0 2 2 2 2 N/A 1 2 4
MPP 2 1 3 1 3 2 2 1 2 N/A 2 1 0
*Data from hand-coding of school websites. Specializations embrace sub-program topics within the MPA or MPP
such as advocacy, international, public finance, policy, management, social innovation, etc.
The average number of specializations is higher at private schools and schools that offer the MPP or MPA degrees.
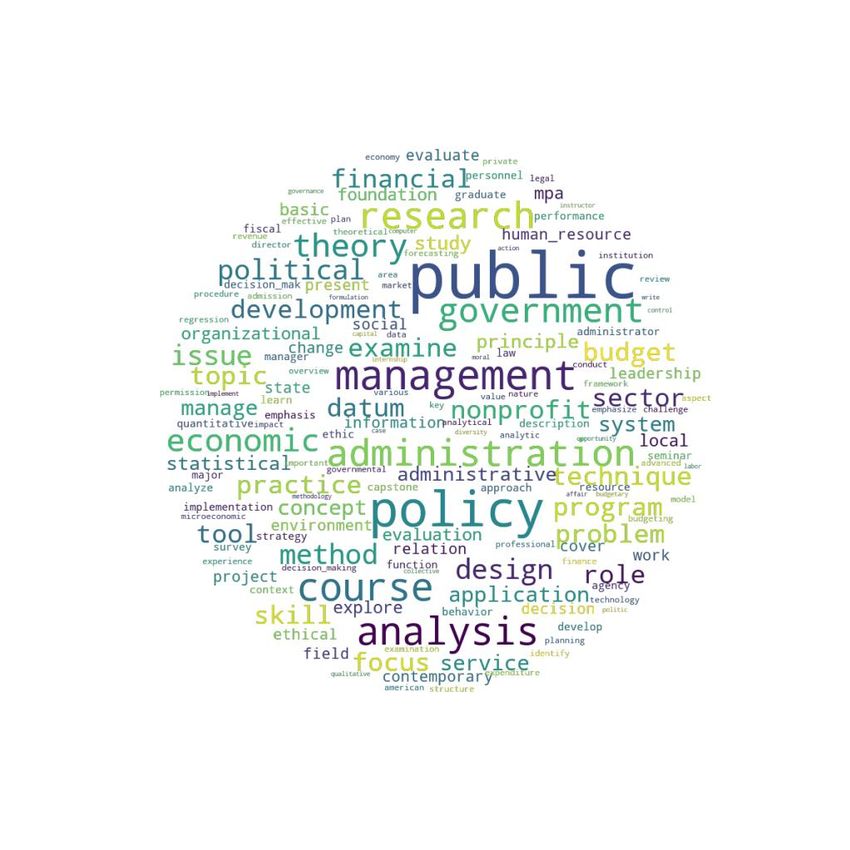
48*Word clouds from 436 core course descriptions from the 33-77
ranked schools. These schools were not asked for their core curricula
syllabi, but provided course descriptions on their websites.
494) Average percentage of schools with five core courses or more
Schools whose
Number NASPAA graduates have the
Totals Status School Type Top 25
of Core Accredited heaviest debt loads
(N=77) (above average)
Courses
Public Private PA PP Blended Yes No Yes No Yes No N/A
5 or less 10% 10% 11% 16% 0% 7% 12% 5% 9% 11% 7% 12% 14%
Above 5 90% 90% 89% 84% 100% 93% 88% 95% 91% 89% 93% 88% 86%
Totals
100% 75% 25% 48% 17% 35% 74% 26% 42% 58% 38% 53% 9%
(N=77)
*Data from hand-coding of school websites
There is little variation in the number of required courses across the schools.
5) Average percentage of Economics, Quantitative, and Management Science courses in MPA and MPP
programs
50Schools whose
% Economics,
NASPAA Top 25 graduates have the
Quantitative & Status School Type
Accredited (32 schools) heaviest debt loads
Mgmt Science
(above average)
Courses in program
Public Private PA PP Blended Yes No Yes No Yes No N/A
MPA 25% 25% 26% 23% N/A 27% 25% 24% 25% N/A 27% 21% 26%
MPP 30% 27% 33% N/A 26% 35% 31% 29% 30% N/A 35% 18% 14%
*Data from the Atlas of Public Management coding of core curricula (N=23 for MPA degree programs and 18 for
MPP degree programs)
The percentage of economics, quantitative, and management science courses in a school’s curriculum is higher in an MPP degree
program offered by a private school and in schools that offer both MPA and MPP degrees (blended). The percentage of economics, etc.,
courses is lower in public schools that offer the MPP.
5152
6) Average percentage of strategy + structure courses in MPA and MPP programs

                                                                                                      Schools whose
                                                                        NASPAA        Top 25        graduates have the
    % Strategy &         Status               School Type
                                                                       Accredited   (32 schools)    heaviest debt loads
 Structure Courses
                                                                                                     (above average)
                     Public   Private   PA       PP    Blended         Yes    No    Yes     No     Yes      No      N/A
   MPA       12%     13%       10%      12%      N/A        13%        11%    14%   12%     N/A    11%     13%        14%

   MPP       11%     13%       9%       N/A     12%         11%        9%     13%   11%     N/A    12%     8%         3%

*Data from the Atlas of Public Management coding of core curricula (N=23 for MPA degree programs and 18 for
MPP degree programs)

MPP degree programs in private schools and NASPAA-accredited schools offer much fewer Strategy & Structure courses.

                                                                  53
7) Average percentage of schools that require internships as a prerequisite for graduation
Schools whose
NASPAA graduates have the
Internship Totals Status School Type Top 25
Accredited heaviest debt loads
Required (N=32)
(above average)
Public Private PA PP Blended Yes No Yes No Yes No N/A
Yes 69% 75% 58% 67% 67% 71% 71% 63% 69% N/A 63% 73% 100%
No 31% 25% 42% 33% 33% 29% 29% 38% 31% N/A 37% 27% 0%
Totals
100% 63% 38% 38% 19% 44% 75% 25% 100% N/A 59% 34% 6%
(N=32)
*Data from hand-coding of school websites and the Atlas of Public Management
The percentage of private schools that do not require an internship is nearly twice that of public schools.
548) Average percentage of schools that require a thesis as a prerequisite for graduation
Schools whose
NASPAA graduates have the
Status School Type Top 25
Thesis Totals Accredited heaviest debt loads
Required (N=32) (above average)
Public Private PA PP Blended Yes No Yes No Yes No N/A
Yes 12% 29% 0% 0% 17% 10% 10% 14% 12% N/A 8% 33% 0%
No 88% 71% 100% 100% 83% 90% 90% 86% 88% N/A 92% 67% 100%
Totals
100% 41% 59% 6% 35% 59% 59% 41% 100% N/A 76% 18% 6%
(N=32)
*Data from hand-coding of school websites and the Atlas of Public Management
Less than one-third of public schools require a thesis, compared to none of the private schools as well as schools offering only an MPA
degree.
9) Average percentage of schools that offer a joint degree(s)
55Schools whose
NASPAA graduates have the
Joint Totals Status School Type Top 25
Accredited heaviest debt loads
Degree (N=32)
(above average)
Public Private PA PP Blended Yes No Yes No Yes No N/A
Yes 72% 70% 75% 75% 67% 71% 71% 75% 72% N/A 58% 91% 100%
No 28% 30% 25% 25% 33% 29% 29% 25% 28% N/A 42% 9% 0%
Totals
100% 63% 38% 38% 19% 44% 75% 25% 100% N/A 59% 34% 6%
(N=32)
*Data from hand-coding of school websites
About 70 percent of all types of schools offer joint degree programs.
Over 90 percent of schools with mean student debt load below average offer joint degrees, compared to 58 percent of schools with mean
student debt load above average.
5610) Average percentage of schools with a significant social innovation curriculum/activity score
Schools whose
Social NASPAA graduates have the
Totals Status School Type Top 25
Innovation Accredited heaviest debt loads
(N=77)
Activity (above average)
Public Private PA PP Blended Yes No Yes No Yes No N/A
Yes 30% 29% 32% 32% 31% 26% 30% 30% 31% 29% 34% 27% 29%
No 70% 71% 68% 68% 69% 74% 70% 70% 69% 71% 66% 73% 71%
Totals
100% 75% 25% 48% 17% 35% 74% 26% 42% 58% 38% 53% 9%
(N=77)
*Data from hand-coding of school websites
Less than a third of public and private schools offer courses and activities related to social innovation, with an even lower percentage
among blended schools.
57(a) Social Innovation website activity
Social
Innovation NASPAA Debt Load above
Totals Status School Type Top 25
featured Accredited Mean
(N=77)
on
websites Public Private PA PP Blended Yes No Yes No Yes No N/A
Yes 14% 10% 26% 16% 15% 11% 12% 20% 16% 13% 28% 7% 0%
No 86% 90% 74% 84% 85% 89% 88% 80% 84% 87% 72% 93% 100%
Totals
100% 75% 25% 48% 17% 35% 74% 26% 42% 58% 38% 53% 9%
(N=77)
(b) Social Innovation courses offered
Social NASPAA Debt Load above
Innovation Totals Status School Type Top 25
Accredited Mean
courses (N=77)
offered Public Private PA PP Blended Yes No Yes No Yes No N/A
Yes 21% 19% 26% 24% 15% 19% 21% 20% 28% 16% 31% 17% 0%
No 79% 81% 74% 76% 85% 81% 79% 80% 72% 84% 69% 83% 100%
Totals
100% 75% 25% 48% 17% 35% 74% 26% 42% 58% 38% 53% 9%
(N=77)
(c) Social Innovation specialization offered
Social
Innovation Totals NASPAA Debt Load above
Status School Type Top 25
Specialization (N=77) Accredited Mean
Offered
58Public Private PA PP Blended Yes No Yes No Yes No N/A
Yes 6% 5% 11% 11% 8% 0% 5% 10% 3% 9% 14% 2% 0%
No 94% 95% 89% 89% 92% 100% 95% 90% 97% 91% 86% 98% 100%
Totals
100% 75% 25% 48% 17% 35% 74% 26% 42% 58% 38% 53% 9%
(N=77)
(d) Social Innovation special programs offered (i.e., seminars, short-term programs, etc.)
Social NASPAA Debt Load above
Innovation Status School Type Top 25
Totals Accredited Mean
special
(N=77)
programs
offered Public Private PA PP Blended Yes No Yes No Yes No N/A
Yes 17% 14% 26% 16% 23% 15% 16% 20% 16% 18% 24% 10% 29%
No 83% 86% 74% 84% 77% 85% 84% 80% 84% 82% 76% 90% 71%
Totals
100% 75% 25% 48% 17% 35% 74% 26% 42% 58% 38% 53% 9%
(N=77)
(e) Social Innovation Certificate Offered
Social NASPAA Debt Load above
Status School Type Top 25
Innovation Totals Accredited Mean
Certificate (N=77)
Offered
Public Private PA PP Blended Yes No Yes No Yes No N/A
59Yes 8% 5% 16% 11% 0% 7% 9% 5% 16% 2% 10% 7% 0%
No 92% 95% 84% 89% 100% 93% 91% 95% 84% 98% 90% 93% 100%
Totals
100% 75% 25% 48% 17% 35% 74% 26% 42% 58% 38% 53% 9%
(N=77)
60VI. HOW IS LEARNING ORGANIZED?
REPORT ILLUSTRATION
*Word cloud of dean’s website messages to potential
students
611) Average percentage of schools with flexible (part-time) learning options
Schools whose
NASPAA graduates have the
Flexible Totals Status School Type Top 25
Accredited heaviest debt loads
Study (N=77)
(above average)
Options
Public Private PA PP Blended Yes No Yes No Yes No N/A
Part-time 85% 91% 65% 95% 40% 88% 93% 56% 83% 86% 74% 93% 80%
Full-time
15% 9% 35% 5% 60% 12% 7% 44% 17% 14% 26% 7% 20%
only
Totals
100% 77% 23% 51% 14% 36% 78% 22% 40% 60% 37% 56% 7%
(N=77)
*Data from the NASPAA data inventories and further hand-coding of school websites
The percentage of schools that offer part-time study varies significantly between public and private schools. It also varies between
schools that offer only MPA and MPP degrees.
6263
2) Average number of master’s degree programs

                                                                                                            Schools whose
                                                                         NASPAA           Top 25          graduates have the
    Master's    Totals         Status            School Type
                                                                        Accredited      (32 schools)      heaviest debt loads
    degree     (N=32)
                                                                                                           (above average)
                         Public   Private   PA      PP     Blended      Yes     No      Yes      No      Yes      No      N/A
    Average
                  4        3            5   3        3         4        4        3       4      N/A       4        3       3
    Number

*Data from hand-coding of school websites

On average, private schools offer five master’s degree programs, which are 60 percent more programs than public schools.

       3) Average percentage of schools with advanced certificate programs

                                                                   64
Schools whose
NASPAA graduates have the
Advanced Totals Status School Type Top 25
Accredited heaviest debt loads
Certificate (N=32) (above average)
Public Private PA PP Blended Yes No Yes No Yes No N/A
Yes 72% 70% 75% 75% 67% 71% 79% 50% 72% N/A 68% 82% 50%
No 28% 30% 25% 25% 33% 29% 21% 50% 28% N/A 32% 18% 50%
Totals
100% 63% 38% 38% 19% 44% 75% 25% 100% N/A 59% 34% 6%
(N=32)
*Data from hand-coding of school websites
NASPAA-accredited schools are more likely to offer an advanced certificate than non-accreddited schools.
654) Average percentage of schools that offer PA/PP undergraduate degree programs
Schools whose
NASPAA graduates have the
Undergraduate Totals Status School Type Top 25
Accredited heaviest debt loads
Degree (N=32)
(above average)
Public Private PA PP Blended Yes No Yes No Yes No N/A
Yes 63% 70% 50% 83% 50% 50% 75% 25% 63% N/A 63% 64% 50%
No 38% 30% 50% 17% 50% 50% 25% 75% 38% N/A 37% 36% 50%
Totals (N=32) 100% 63% 38% 38% 19% 44% 75% 25% 100% N/A 59% 34% 6%
*Data from hand-coding of school websites
The percentage of public schools offering undergraduate degrees is higher than private schools, and a much higher percentage of
schools awarding MPA only as a master’s degree offers an undergraduate degree either as a stand-alone or as part of a blended
approach.
6667
5) Average percentage of schools that offer at least some online coursework and/or stand-alone online
            degree programs

                                                                                                         Schools whose
  Online                                                                  NASPAA                       graduates have the
 courses      Totals       Status               School Type                             Top 25
                                                                         Accredited                    heaviest debt loads
   or        (N=77)                                                                                     (above average)
 degrees
                       Public   Private   PA       PP     Blended        Yes    No    Yes     No      Yes      No       N/A

   Yes        75%      81%       58%      92%     25%         74%        84%    47%   66%    82%      66%     83%      67%

    No        25%      19%       42%      8%      75%         26%        16%    53%   34%    18%      34%     17%      33%

   Totals
             100%      75%       25%      49%     16%         36%        75%    25%   42%    58%      38%     54%       8%
  (N=77)

*Data from hand-coding of school websites, completed before COVID-19.

Eighty-one percent of public schools offer online courses and degrees, as do 92 percent of schools that only award MPA degrees. In
contrast, only a quarter of schools that only award MPP degrees offer these online learning options.

                                                                    68
69
VII. WHAT IS THE IMPACT?

   1) Website coverage of COVID-19, April-June 2020

                                                                                                         Schools whose
                                                                        NASPAA                         graduates have the
 COVID-19 Totals          Status              School Type                               Top 25
                                                                       Accredited                      heaviest debt loads
  Content (N=77)                                                                                        (above average)
                     Public   Private   PA       PP     Blended        Yes    No     Yes      No      Yes      No       N/A

  Higher     60%      53%      79%      49%     92%         59%        49%    90%    72%     51%      76%     44%      86%

  Lower      40%      47%      21%      51%      8%         41%        51%    10%    28%     49%      24%     56%      14%

   Totals
             100%     75%      25%      48%     17%         35%        74%    26%    42%     58%      38%     53%      9%
  (N=77)

*Hand-coding of COVID-19 website coverage, April 13-June 20, 2020

Website coverage of COVID-19 was most highest among (1) private schools, (2) schools that award the MPP degree, (3) schools that
were not accredited by NASPAA, and (4) schools with mean student loan debt about average.

                                                                  70
2) Website coverage of social justice issues, June 2020
Schools whose graduates
Social NASPAA
Totals Status School Type Top 25 have the heaviest debt
Justice Accredited
(N=77) loads (above average)
Content
Public Private PA PP Blended Yes No Yes No Yes No N/A
Higher 49% 48% 53% 41% 62% 56% 51% 45% 63% 40% 59% 51% 0%
Lower 51% 52% 47% 59% 38% 44% 49% 55% 38% 60% 41% 49% 100%
Totals
100% 75% 25% 48% 17% 35% 74% 26% 42% 58% 38% 53% 9%
(N=77)
*Hand-coding of social justice website coverage, April 13-June 20, 2020
Website coverage of social justice issues was highest among schools offering only the MPP degrees, in top-25 schools, and in schools
with mean student loan debt above average, but just 41 percent in schools offering only the MPA degree.
713) Overall current events website coverage
Schools whose
NASPAA graduates have the
Social Status School Type Top 25
Totals Accredited heaviest debt loads
Issue
(N=77) (above average)
Coverage
Public Private PA PP Blended Yes No Yes No Yes No N/A
Major 29% 24% 42% 19% 54% 30% 25% 40% 47% 16% 48% 20% 0%
Minimal 52% 53% 47% 51% 46% 56% 51% 55% 41% 60% 38% 56% 86%
None 19% 22% 11% 30% 0% 15% 25% 5% 13% 24% 14% 24% 14%
Totals
100% 75% 25% 48% 17% 35% 74% 26% 42% 58% 38% 53% 9%
(N=77)
*Hand-coding of combined COVID-19 and social justice website coverage, April 13-June 20, 2020
Website coverage of COVID-19 and social justice issues combined was higher at schools that offered the MPP degree than at schools
that offered the MPA.
724) Average number and percentages of graduate degrees conferred
Schools whose
NASPAA Top 25 graduates have the
Totals Status School Type
Graduates Accredited (32 schools) heaviest debt loads
(N=77) (above average)
Public Private PA PP Blended Yes No Yes No Yes No N/A
Average 92 68 163 82 66 118 92 92 137 59 136 67 51
Total 100% 56% 44% 43% 12% 45% 74% 26% 62% 38% 56% 39% 5%
*Data from the National Center for Education Statistics; numbers apply only to MPA and MPP degrees
On average, private schools graduated more than twice as many students as public schools. Schools with mean student loan debt above
average also graduated twice as many students as those with lower debt.
735) Average percentage of first jobs in government, non-profit, or private sector
Schools whose
NASPAA Top 25 graduates have the
First- Totals Status School Type
Accredited (32 schools) heaviest debt loads
Destination (N=52) (above average)
Public Private PA PP Blended Yes No Yes No Yes No N/A
Government 38% 42% 28% 41% 26% 38% 40% 33% 32% 43% 31% 46% 32%
Non-profit 22% 20% 28% 20% 23% 24% 21% 24% 26% 19% 25% 19% 24%
Private 19% 16% 28% 14% 37% 20% 15% 32% 22% 17% 23% 16% 19%
*Data collected from NASPAA website and personal email requests to deans
On average, 37 percent of graduates from schools that only awarded an MPP went to the private sector for their first job, compared
with just 14 percent who graduated from schools that only awarded an MPA degree.
On average, 46 percent who graduated from schools with mean federal student loan debt below average went to the government, while
students who graduate from high debt load schools had a higher interest in non-profit and private sector first jobs.
7475
5) Average median first-year earnings of MPA and MPP graduates who were federally-aided students who
      completed college

                                                                                                                   Schools whose graduates
  Median                                                                      NASPAA               Top 25
               Totals        Status                   School Type                                                   have the heaviest debt
 first-year                                                                  Accredited          (32 schools)
              (N=77)                                                                                                loads (above average)
 Earnings
                        Public    Private     PA         PP      Blended    Yes        No       Yes        No       Yes        No       N/A

   MPP        $60,768   $58,825   $62,182    N/A       $61,778   $59,860   $57,363   $63,245   $61,893   $56,550   $61,420   $58,325    N/A

   MPA        $54,220   $50,503   $67,064   $51,003      N/A     $59,300   $53,133   $66,450   $57,675   $51,838   $60,279   $50,562   $45,200

*Data from the National Center for Education Statistics

The median first-year earnings of graduates from schools that only awarded MPP degrees was $10,775 higher than that of graduates
from schools offering only MPA degrees.

                                                                      76
77
CONCLUSION

This report provides a short list of benchmarking measures that public affairs educators can explore for insights on
future directions, but lacks a deep inventory of insights on how their schools are doing in preparing their students
for contemporary careers. Acknowledging that many schools survey their students on course delivery and overall
satisfaction with what they learned and how they were taught, graduates are hard to track over time, response rates
to further surveys appear to be low, and ongoing assessments are expensive. The result is a general dearth of
information on where graduates went, how they advanced, how they are changing the world, and how our teaching
and research is helping them make a difference.

The limited available evidence on our alums strongly suggests that public service is becoming more stressful as
political polarization, budget crises, and government breakdowns have increased. The nation and world have never
needed our best and brightest more. Yet, it also seems reasonable to argue that the “quiet crisis” that framed Paul
A. Volcker’s 1988 National Commission on the Public Service is growing louder as baby boomers approach their
final confrontations with careers and retirements. Volcker’s preface to the report is just as relevant today as it was
back then: “Simply put, too many of the best of the nation’s senior executives are ready to leave government, and
not enough of its most talented young people are willing to join. This erosion in the attractiveness of public service
at all levels—most specifically in the federal civil service—undermines the ability of government to respond
effectively to the needs and aspirations of the American, and ultimately damages the democratic process itself.”

Sadly, for our profession, Volcker's words still ring true as time works its will on our curricula, faculties, and
student debt. Yet, we know little about how our students are doing, where we did well, what we missed, and how
we might redesign our curricula and advocacy agendas to meet the current pressures. At the very least, it seems
reasonable to suggest a collective effort to survey several cohorts of students to see what has changed over time
and where they might recommend improvements and deepening. Some schools are no doubt already engaged in
regular alumni surveys, but perhaps it is time for the community to pool resources and graduate contact
information to create a regular assessment that can guide the community.

                                                          78
It has been twenty-six years since I last fielded an alumni random-sample survey of graduates of the top 20
schools. Perhaps it is time to try again. Surely our graduates have insights that might help us refine our curricula
and focus our advocacy as polarization persists.
79You can also read