Q2 2021 Earnings Conference Call - Ellington Financial
←
→
Page content transcription
If your browser does not render page correctly, please read the page content below

Earnings Conference Call   Q2
      August 6, 2021             2021
Q2 2021 EARNINGS
Important Notice

Forward-Looking Statements
This presentation contains forward-looking statements within the meaning of the safe harbor provisions of the Private Securities Litigation Reform Act of 1995. Forward-looking statements involve
numerous risks and uncertainties. Our actual results may differ from our beliefs, expectations, estimates, and projections and, consequently, you should not rely on these forward-looking statements as
predictions of future events. Forward-looking statements are not historical in nature and can be identified by words such as “believe,” “expect,” “anticipate,” “estimate,” “project,” “plan,” “continue,”
“intend,” “should,” “would,” “could,” “goal,” “objective,” “will,” “may,” “seek,” or similar expressions or their negative forms, or by references to strategy, plans, or intentions. Examples of forward-looking
statements in this presentation include statements regarding our portfolio composition, our ability to obtain financing, our expected dividend payment schedule, our potential share repurchases, our ability
to shift capital across different asset classes, our ability to hedge, our ability to grow our proprietary loan origination businesses, and our ability to maintain our earnings, among others.
The Company's results can fluctuate from month to month and from quarter to quarter depending on a variety of factors, some of which are beyond the Company's control and/or are difficult to predict,
including, without limitation, changes in interest rates and the market value of the Company's investments, changes in mortgage default rates and prepayment rates, the Company's ability to borrow to
finance its assets, changes in government regulations affecting the Company's business, the Company's ability to maintain its exclusion from registration under the Investment Company Act of 1940, the
Company’s ability to maintain its qualification as a real estate investment trust, or “REIT,” and other changes in market conditions and economic trends, including changes resulting from the economic
effects related to the novel coronavirus (COVID-19) pandemic, and associated responses to the pandemic. Furthermore, forward-looking statements are subject to risks and uncertainties, including, among
other things, those described under Item 1A of our Annual Report on Form 10-K filed on March 16, 2021, as amended, which can be accessed through the Company’s website at
www.ellingtonfinancial.com or at the SEC’s website (www.sec.gov). Other risks, uncertainties, and factors that could cause actual results to differ materially from those projected may be described from time
to time in reports we file with the SEC, including reports on Form 10-Q, 10-K and 8-K. We undertake no obligation to update or revise any forward-looking statements, whether as a result of new information,
future events, or otherwise.

Modeling
Some statements in this presentation may be derived from proprietary models developed by Ellington Management Group, L.L.C. (“Ellington”). Some examples provided may be based upon the hypothetical
performance of such models. Models, however, are inherently imperfect and subject to a number of risks, including that the underlying data used by the models is incorrect, inaccurate, or incomplete, or
that the models rely upon assumptions that may prove to be incorrect. The utility of model-based information is highly limited. The information is designed to illustrate Ellington’s current view and
expectations and is based on a number of assumptions and limitations, including those specified herein. Certain models make use of discretionary settings or parameters which can have a material effect
on the output of the model. Ellington exercises discretion as to which settings or parameters to use in different situations, including using different settings or parameters to model different securities.
Actual results and events may differ materially from those described by such models.

Example Analyses
The example analyses included herein are for illustrative purposes only and are intended to illustrate Ellington’s analytic approach. They are not and should not be considered a recommendation to
purchase or sell any security or a projection of the Company’s future results or performance. The example analyses are only as of the date specified and do not reflect changes since that time.

Projected Yields and Spreads
Projected yields and spreads discussed herein are based upon Ellington models and rely on a number of assumptions, including as to prepayment, default and interest rates and changes in home prices.
Such models are inherently imperfect and there is no assurance that any particular investment will perform as predicted by the models, or that any such investment will be profitable. Projected yields are
presented for the purposes of (i) providing insight into the strategy’s objectives, (ii) detailing anticipated risk and reward characteristics in order to facilitate comparisons with other investments, (iii)
illustrating Ellington’s current views and expectations, and (iv) aiding future evaluations of performance. They are not a guarantee of future performance. They are based upon assumptions regarding
current and future events and conditions, which may not prove to be accurate. There can be no assurance that the projected yields will be achieved. Investments involve risk of loss.

Financial Information
All financial information included in this presentation is as of June 30, 2021 unless otherwise indicated. We undertake no duty or obligation to update this presentation to reflect subsequent events or
developments.

Q2 2021 EARNINGS                                                                                                                                                                                                2

Second Quarter Highlights(1)

                        • Net income: $32.7 million or $0.75 per common share
     Overall Results    • Economic return(2) of 4.2% for the quarter, or 17.8% annualized
                        • Core Earnings(3) of $22.3 million or $0.51 per share

                        • Credit gross income: $55.3 million(4) or $1.25 per share
     Credit Strategy
                        • Long credit portfolio: $1.359 billion(5)(6), a 5% increase from the prior quarter

     Agency RMBS        • Agency gross loss: $(1.2) million(4) or $(0.03) per share
     Strategy           • Long Agency portfolio: $1.476 billion, a slight decrease from the prior quarter

                        • Total equity: $955.1 million
     Equity & BVPS
                        • Book value per common share: $18.47 after total dividends declared of $0.44 for the quarter

     Dividends          • Increased monthly common dividend by a cumulative 50% to $0.15 per common share during the quarter
                        • Annualized dividend yield of 9.9% based on the 8/4/2021 closing price of $18.12, and dividend of $0.15
                          per common share declared on 8/4/2021

                        • Debt-to-equity ratio: 3.2x(7)
     Leverage Below
     Sector Average     • Recourse debt-to-equity ratio: 1.9x(8)
                        • Includes $86 million of unsecured notes rated “A”(9)
                        • Cash and cash equivalents of $134.7 million, in addition to other unencumbered assets of $511.0 million

     Strong Alignment
                        • Management and directors own approximately 8% of EFC(10)
     of Interests

Q2 2021 EARNINGS                                                                                                                    3
Portfolio Summary as of June 30, 2021(1)

      Proprietary portfolio of high-yielding, short-duration loans, and opportunistic securities
                                                                   Allocated       Fair Value   Average Price                          WAVG Mkt
                                                                         (2)   ($ in $1,000s)            (3)(7)               (5)(7)                    Equity and Asset
      Strategy                                                     Equity                          (%)            WAVG Life            Yield(6)(7)
                                                                                                                                                     Allocation by Strategy
      Credit
      Residential Mortgage Loans and REO(8)(9)                                 $     464,218       100.0              2.5                7.1%
                                                         (9)(10)
      CMBS and Commercial Mortgage Loans and REO                                     361,882        89.2              1.6                8.8%
      Non-Agency RMBS                                                                158,798        78.0              5.2                6.8%
                                (11)                                                                 - (4)
      Consumer Loans and ABS                                                         138,471                          1.1               15.0%
      Debt and Equity Investments in Loan Origination Entities                       106,160        N/A               N/A                N/A
             (11)
      CLOs                                                                            69,053        73.3              3.3               16.1%
                                           (11)(12)
      Non-Dollar MBS, ABS, CLO and Other                                              32,714        74.4              1.6                8.5%
      Corporate Debt and Equity and Corporate Loans                                   27,939        54.0              2.4               16.0%
      Total - Credit                                                 80%       $ 1,359,235          88.8              2.5                9.1%

      Agency
      Fixed-Rate Specified Pools                                               $ 1,333,675         106.0              5.6                1.8%
      Reverse Mortgage Pools                                                          75,934       107.4              4.2                1.6%
      IOs                                                                             39,045        N/A               4.9                7.7%
      Floating-Rate Specified Pools                                                   27,093       105.1              4.6                2.0%
      Total - Agency                                                 20%       $ 1,475,747         106.1              5.5                1.9%

      Debt-to-Equity Ratio by Strategy and Overall
      Credit                                          2.2x (13)
      Agency                                          7.4x (13)
      Overall                                         3.2x (14)
      Overall Recourse                                1.9x (15)

       • Residential Mortgage Loans and REO(8)(9) consist of non-QM loans ($302.2mm), residential transition loans ($135.9mm), other residential loans
         ($24.5mm), and REO ($1.6mm)
       • Debt and Equity Investments in Loan Origination Entities consist of Longbridge ($71.9mm), LendSure ($21.2mm), and other loan originators
         ($13.1mm)
Q2 2021 EARNINGS                                                                                                                                                              4
Operating Results by Strategy
                                                                                                 Three-Month                      Three-Month
                                                                                                 Period Ended        Per          Period Ended         Per
          (In thousands, except per share amounts)                                              June 30, 2021       Share        March 31, 2021       Share
          Credit:
           Interest income and other income(1)                                              $        36,511     $   0.82     $         34,289     $   0.77
           Realized gain (loss), net                                                                  2,009         0.05                4,188         0.09
           Unrealized gain (loss), net                                                               12,791         0.29               17,575         0.40
                                       (2)
           Interest rate hedges, net                                                                 (1,202)        (0.03)              1,727         0.04
           Credit hedges and other activities, net(3)                                                 1,303         0.03                1,085         0.02
           Interest expense(4)                                                                       (9,856)        (0.22)             (9,944)        (0.22)
           Other investment related expenses                                                         (4,831)        (0.11)             (4,855)        (0.11)
           Earnings (losses) from investments in unconsolidated entities                             18,602         0.42                6,635         0.15
          Total Credit profit (loss)                                                        $        55,327     $   1.25     $         50,700     $   1.14
          Agency RMBS:
           Interest income                                                                           11,328         0.25                6,752         0.15
           Realized gain (loss), net                                                                 (3,982)        (0.09)                  2           -
           Unrealized gain (loss), net                                                               (2,815)        (0.06)            (21,974)        (0.49)
           Interest rate hedges and other activities, net(2)                                         (4,754)        (0.11)             16,199         0.36
           Interest expense(4)                                                                         (939)        (0.02)               (939)        (0.02)
          Total Agency RMBS profit (loss)                                                   $        (1,162)    $ (0.03)     $            40      $     -
          Total Credit and Agency RMBS profit (loss)                                        $        54,165     $   1.22     $         50,740     $   1.14
          Other interest income (expense), net                                                           38            -                    7           -
          Income tax (expense) benefit                                                               (3,140)        (0.07)             (2,017)        (0.05)
          Other expenses                                                                             (7,437)        (0.17)             (7,474)        (0.17)
          Net income (loss) (before incentive fee)                                                   43,626         0.98               41,256         0.92
          Incentive fee                                                                              (7,157)        (0.16)                  -               -
          Net income (loss)                                                                 $        36,469     $   0.82     $         41,256     $   0.92
          Less: Dividends on preferred stock                                                          1,940         0.04                1,941         0.04
          Less: Net income (loss) attributable to non-participating non-controlling
                                                                                                      1,369         0.03                 882          0.02
          interests
          Net income (loss) attributable to common stockholders and                                  33,160         0.75               38,433         0.86
          participating non-controlling interests
          Less: Net income (loss) attributable to participating non-controlling interests              505                               577
          Net income (loss) attributable to common stockholders                             $        32,655     $   0.75     $         37,856     $   0.86
                                                                             (5)
          Weighted average shares of common stock and convertible units
                                                                                                     44,460                           44,448
          outstanding
          Weighted average shares of common stock outstanding                                        43,782                           43,782

Q2 2021 EARNINGS                                                                                                                                                5
Long Credit Portfolio*

                                                                               A: CMBS & Commercial Loans & REO(3)(4)
                                                                               B: Consumer Loans & ABS(2)
                                                                               C: Residential Loans & REO(3)
                                                                               D: CLOs(2)
                                                                               E: Non-Agency RMBS
                                                                               F: Debt and Equity Investments in Loan Originators
                                                                               G: Non-Dollar MBS, ABS, CLOs & Other(2)(5)
                                                                               H: Corporate Debt & Equity & Corporate Loans

                         As of 6/30/2021(1)                                                                                                 As of 3/31/2021(1)

    Total size of long credit                         In Residential Loans & REO, new                     CMBS & Commercial Loans &         Equity Investments in Loan
    portfolio increased                               non-QM and residential                              REO, was roughly unchanged        Originators increased, while
    approximately 5% in the                           transition loan purchases more                      as a record volume of loan        CLOs and Non-Agency RMBS
    second quarter                                    than offset the impact of the                       originations was offset by loan   declined as a result of
                                                      non-QM loan securitization, and                     resolutions and as several        opportunistic sales; Consumer
                                                      drove significant growth of that                    loans converted to equity         was roughly unchanged for the
                                                      portfolio                                           method investments                quarter

*Excludes non-retained tranches of the Company’s consolidated non-QM securitization trusts

Q2 2021 EARNINGS                                                                                                                                                            6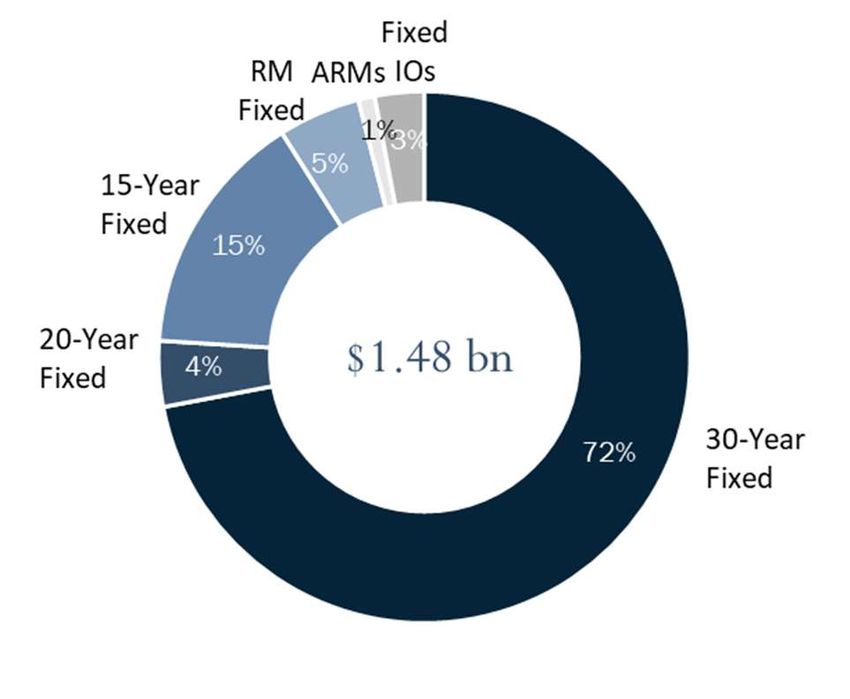
Long Agency Portfolio

                         As of 6/30/2021(1)                                                                     As of 3/31/2021(1)

                                              Fair         Wtd. Avg.                                                          Fair         Wtd. Avg.
                                                     (1)            (2)                                                              (1)            (2)
      Category                            Value            Coupon                        Category                            Value         Coupon
      30-Year Fixed                       $ 1,056.7         3.31%                        30-Year Fixed                      $ 1,099.9        3.32
      20-Year Fixed                             52.1        2.45%                        20-Year Fixed                           54.7        2.48
      15-Year Fixed                            224.8        2.71%                        15-Year Fixed                         185.8         2.64
      RM Fixed                                  75.9        3.46%                        RM Fixed                                92.4        3.66
      Subtotal - Fixed                    $ 1,409.5         3.19%                        Subtotal - Fixed                   $ 1,432.9        3.22
      ARMs                                      27.1                                     ARMs                                        5.8

      Fixed IOs                                 39.0                                     Fixed IOs                               49.1

      Total                               $ 1,475.6                                      Total                              $ 1,487.8

         • The Agency RMBS portfolio was $1.476 billion as of June 30, 2021, slightly smaller than the prior quarter

Q2 2021 EARNINGS                                                                                                                                          7
Summary of Borrowings

  ($ in thousands)                                                   As of 6/30/2021                    Three-Month Period Ended 6/30/21
                                                                                                          Average                  Average Cost
                                                            Outstanding      Weighted Average
  Collateral Type                                           Borrowings        Borrowing Rate            Borrowings                  of Funds
           (1)
  Credit                                                  $1,577,657              1.96%           $      1,426,056                    2.47%

  Agency RMBS                                              1,428,503              0.17%                  1,439,063                    0.20%

  Borrowings — Credit and Agency RMBS                 $ 3,006,160                 1.11%           $      2,865,119                    1.33%
  U.S. Treasury Securities                                       -                     -                        330                   0.01%

  Borrowings — including U.S. Treasury Securities     $ 3,006,160                 1.11%           $      2,865,449                    1.33%

  Senior Notes, at par                                       86,000               5.80%                      86,000                   5.80%

  Total Borrowings                                    $ 3,092,160                 1.24%           $      2,951,449                    1.46%

                                                    (2)
  Recourse and Non-Recourse Leverage Summary
  As of 6/30/2021
                                                                                                                             (3)
  Recourse Borrowings                                 $       1,834,522                    Recourse Debt-to-Equity Ratio              1.9:1
  Non-Recourse Borrowings                             $       1,257,638
                                                                                                                             (4)
  Total Borrowings                                    $       3,092,160                         Total Debt-to-Equity Ratio            3.2:1
  Total Equity                                        $        955,104

Q2 2021 EARNINGS                                                                                                                                  8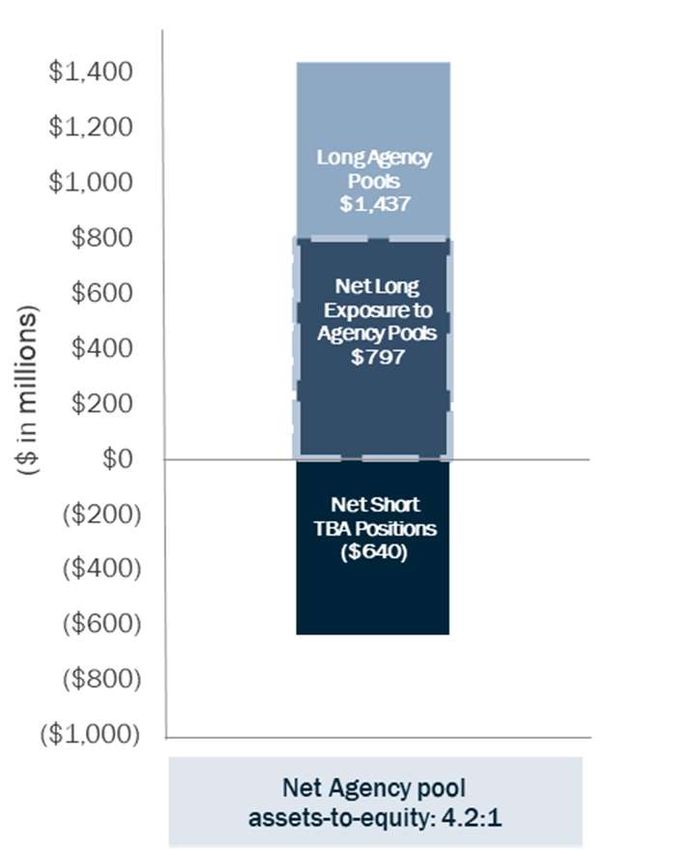
Diversified Credit Portfolio

  Diversified sources of return to perform over market cycles

                                                                                             Other

              Residential Mortgages
               •   Non-QM Loans
               •   Residential Transition Loans
               •   NPL / RPL
               •   Non-Agency / Non-Conforming
               •   Reverse Mortgages                                                                             Commercial Mortgages
               •   REO                                                                                           •   NPLs
               •   Single-Family Rental MBS                                                                      •   Bridge Loans
                                                                                                                 •   CMBS, B-Pieces & Credit Bonds
                                                                                                                 •   REO

                                                               Consumer Loans
                                                               • Installment Loans
                                                               • Auto Loans
                                                               • ABS

    • Our flexible approach allocates capital to the sectors where we see the best relative value as market conditions change(1)
    • We believe that our analytical expertise, research and systems provide an edge that will generate attractive risk-adjusted returns over market cycles

Note: Percentages shown reflect share of total fair market value of credit portfolio(2)(3)

Q2 2021 EARNINGS                                                                                                                                              9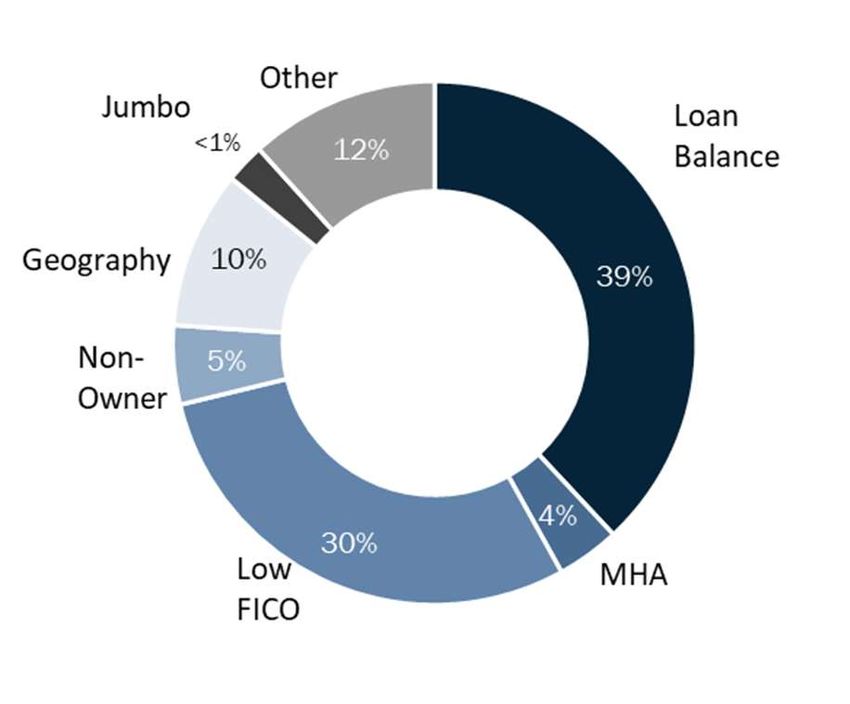
Small Balance Commercial Mortgage Loan Portfolio – Detail(1)(2)

                                      Property Type                                                          Geography

                                                                                                                Interest
                                        Seniority                                                              RateType

  • Small balance commercial mortgage loan portfolio is well diversified geographically and across property types
  • All investments are first liens
  • Vast majority of investments are floating rate loans that benefit from interest rate floors

Q2 2021 EARNINGS                                                                                                           10
Proprietary Loan Origination Businesses
Ellington Financial’s vertically integrated, proprietary loan origination businesses are designed to:
• Lock in a steady flow of high-quality loan originations
• Leverage Ellington’s core strengths of data analysis and modeling to help shape the underwriting criteria of the loans
• Generate highly attractive ROE profiles
• Represent significant potential upside to book value
• Fill lending void left by banks facing strict post-global financial crisis regulations
1 2 3 4 5
Non-QM Small Balance Residential Consumer Reverse
Loans(1) Commercial Transition Loans Loans Mortgage Loans
Loans(2)
Strategic Originator
Investment(s) √ - √ √ √
Joint Ventures and/or
Flow Agreements √ √ √ √ -
In-House
Origination Team - √ √ - -
Total
Loans Acquired During
$259.4 $87.2 $67.8 $30.8 - $445.2
Quarter ($mm)
Total Loan Fair Value at
$302.2 $336.6 $135.9 $121.0 - $895.7
Quarter-End ($mm)
Q2 2021 EARNINGS 11Stable Economic Return
Standard Deviation of Quarterly Economic Returns of Hybrid REITs, Q1-2011 – Q1-2021(1)(2)
Standard
Company
Deviation
EFC 3.8%
Hybrid REIT #02 5.6%
Hybrid REIT #03 5.8%
Hybrid REIT #04 6.5%
Hybrid REIT #05 7.7%
Hybrid REIT #06 9.9%
Hybrid REIT #07 13.4%
Hybrid REIT #08 13.7%
Hybrid REIT #09 14.0%
Hybrid REIT #10 16.1%
• EFC has produced the most consistent quarterly returns among its peer group with significantly lower earnings volatility, thanks to EFC’s dynamic hedging
strategies, diversification and active portfolio management
Q2 2021 EARNINGS 12Interest Rate Sensitivity Analysis(1)
Estimated Change in Fair Value
50 Basis Point Decline in Interest Rates 50 Basis Point Increase in Interest Rates
($ in thousands) ∆ Fair Value % of Total Equity ∆ Fair Value % of Total Equity
Agency RMBS – Fixed Pools and IOs, excluding TBAs $ 15,555 1.63% $ (24,295) -2.54%
TBAs and Other Mortgage-Related Derivatives (2,565) -0.27% 5,113 0.54%
Agency RMBS – ARM Pools 410 0.04% (390) -0.04%
Non-Agency RMBS, CMBS, Other ABS, and Mortgage Loans 7,363 0.77% (9,483) -0.99%
Interest Rate Swaps (12,176) -1.27% 11,779 1.23%
U.S. Treasury Securities (3,752) -0.39% 3,598 0.38%
Eurodollar and Treasury Futures (4,028) -0.42% 3,955 0.41%
Corporate Securities and Derivatives on Corporate Securities 2 - (3) -
Repurchase Agreements, Reverse Repurchase Agreements, (1,140) -0.12% 3,103 0.32%
and Senior Notes Outstanding
Total $ (331) -0.03% $ (6,623) -0.69%
Less: Estimated Change in Fair Value attributable to Preferred Stock (1,855) 1,822
Estimated Change in Fair Value attributable to Common Stock $ (2,186) $ (4,801)
As % of Common Equity -0.26% -0.57%
• EFC’s dynamic interest rate hedging, along with the short duration of many of its loan portfolios, reduces its exposure to fluctuations in interest rates
• Diversified fixed income portfolio, after taking into account hedges, borrowings, and the interest rate sensitivity of preferred stock outstanding, results
in an effective duration to the common stock of less than one year
Q2 2021 EARNINGS 13Commitment to ESG
Ellington is committed to corporate social responsibility. We recognize the importance of environmental, social and governance (“ESG”)
factors, and believe that the implementation of ESG policies will benefit our employees, support long-term shareholder performance, and
make a positive impact on the environment and society as a whole. Our Manager has a standing ESG Committee to address a variety of
issues, including its impact on the environment, increasing the diversity of its workforce, employee engagement, and community
involvement.
Environmental Social Governance
• Our office is conveniently located near mass • We invest in home mortgage loans, which • Our Manager has a Responsible Investment
transportation. support homeownership and stability within policy incorporating ESG factors into its
communities. investment processes for applicable strategies.
• We provide financial support and incentives to
our employees who use public transit. • Ellington and senior members of management • We operate under a Code of Business Conduct
sponsor numerous charitable causes, and Ethics.
• To reduce energy usage, we use Energy Star®
including several devoted to diversity and
certified desktops, monitors and printers; and • EFC has a separate independent Chairman,
children in need. We also support employee
utilize motion sensor lighting and cooling to and the majority of Board members are
charitable contributions with matching gift
reduce energy usage in non-peak hours. independent.
programs.
• To reduce waste and promote a cleaner • We hold annual elections of Directors.
• Our employees have access to robust health
environment, we use green cleaning supplies
and wellness programs. Ellington also • We are committed to significant disclosure and
and kitchen products; recycle electronics, ink
supports various events that support health transparency, including an established monthly
cartridges, and packaging; provide recycling
and wellness. book value disclosure and dividend policy.
containers to employees; and use water
coolers to reduce waste. • We provide opportunities for personal growth • We foster regular employee engagement, and
with training and education support, including have an established Whistleblower policy.
reimbursement for continuing education. We
also provide mentorship programs, and • Robust process for shareholder engagement.
internship opportunities. • Strong alignment through 8% co-investment(1)
• We are committed to enhancing gender,
racial, and ethnic diversity throughout
our organization, as stated in our Manager’s
Diversity and Inclusion Policy.
• We are in compliance with applicable
employment codes and guidelines, including
ADA, Equal Opportunity Employment, Non-
Discrimination, Anti-Harassment and Non-
Retaliation codes.
Q2 2021 EARNINGS 14Supplemental
Slides
Q2 2021 EARNINGS 15Second Quarter Market Update
Quarter Ended 6/30/2021 Q2/Q1 3/31/2021 Q1/Q4 12/31/2020 Q4/Q3 9/30/2020 Q3/Q2 6/30/2020
(1)
UST (%)
3M UST 0.04 -0.04 0.02 -0.04 0.06 -0.03 0.09 -0.04 0.13
2Y UST 0.25 -0.25 0.16 +0.04 0.12 -0.01 0.13 -0.02 0.15
5Y UST 0.89 -0.89 0.94 +0.58 0.36 +0.08 0.28 -0.01 0.29
10Y UST 1.47 -1.47 1.74 +0.83 0.91 +0.23 0.68 +0.03 0.66
30Y UST 2.09 -2.09 2.41 +0.77 1.64 +0.19 1.46 +0.04 1.41
3M10Y Spread 1.43 -1.43 1.73 +0.87 0.85 +0.26 0.59 +0.06 0.53
2Y10Y Spread 1.22 -1.22 1.58 +0.79 0.79 +0.23 0.56 +0.05 0.51
(1)
US Dollar Swaps (%)
2Y SWAP 0.33 -0.33 0.29 +0.09 0.20 -0.02 0.22 -0.00 0.22
5Y SWAP 0.97 -0.97 1.06 +0.63 0.43 +0.08 0.35 +0.02 0.33
10Y SWAP 1.44 -1.44 1.78 +0.86 0.93 +0.22 0.71 +0.07 0.64
(1)
LIBOR (%)
1M 0.10 -0.10 0.11 -0.03 0.14 -0.00 0.15 -0.01 0.16
3M 0.15 -0.15 0.19 -0.04 0.24 +0.00 0.23 -0.07 0.30
1M3M Spread 0.05 -0.05 0.08 -0.01 0.09 +0.01 0.09 -0.05 0.14
(2)
Mortgage Rates (%)
15Y 2.56 -2.56 2.71 +0.29 2.42 -0.23 2.65 -0.16 2.81
30Y 2.98 -2.98 3.17 +0.50 2.67 -0.23 2.9 -0.23 3.13
(1)
FNMA Pass-Thrus
30Y2.5 $103.41 -103.41 $102.51 -2.95 $105.45 +$0.56 $104.89 +$0.66 $104.23
30Y3.5 $105.27 -105.27 $105.61 -0.13 $105.73 +$0.25 $105.48 +$0.31 $105.17
30Y4.5 $107.63 -107.63 $108.87 +$0.48 $108.39 +$0.22 $108.17 +$0.72 $107.45
(3)(4)
Libor-based OAS (bps)
FNMA30Y2.5 OAS 3.5 -3.50 -2.6 +29.2 -31.8 -29.5 -2.3 -1.4 -0.9
FNMA30Y3.5 OAS 17.5 -17.50 5.5 +6.0 -0.5 -4.4 3.9 +11.8 -7.9
FNMA30Y4.5 OAS 5 -5.00 -24.9 -3.1 -21.8 -6.7 -15.1 -8.1 -7.0
(3)(5)
Libor-based ZSpread (bps)
FNMA30Y2.5 ZSpread 59 -59.00 39.2 +19.8 19.4 -31.5 50.9 +6.2 44.7
FNMA30Y3.5 ZSpread 62.8 -62.80 57.6 +35.9 21.7 -1.5 23.2 +19.0 4.2
FNMA30Y4.5 ZSpread 26.1 -26.10 5.9 +19.9 -14.0 -5.4 -8.6 -2.5 -6.1
Q2 2021 EARNINGS 16Derivatives Summary as of June 30, 2021(1)
Long Short Net
($ in thousands) Notional Notional Notional Fair Value
Mortgage-Related Derivatives:
CDS on MBS and MBS Indices $ 705 $ (8,335) $ (7,630) $ 1,569
Total Net Mortgage-Related Derivatives $ 1,569
Corporate-Related Derivatives:
CDS on Corporate Bonds and Corporate Bond Indices 2,256 (32,559) (30,303) (2,800)
Total Return Swaps on Corporate Bond Indices and Corporate Debt(2) 4,201 - 4,201 464
Options 30,000 - 30,000 294
Warrants(3) 1,897 - 1,897 2
Total Net Corporate-Related Derivatives $(2,040)
Interest Rate-Related Derivatives:
TBAs 217,773 (785,621) (567,848) 1,699
Interest Rate Swaps 255,258 (985,130) (729,872) (3,320)
U.S. Treasury Futures(4) 1,900 (178,500) (176,600) 504
Total Interest Rate-Related Derivatives $(1,117)
Other Derivatives:
Foreign Currency Forwards(5) - (16,922) (16,922) 445
Total Net Other Derivatives 445
Net Total $(1,143)
Q2 2021 EARNINGS 17Credit Hedging Portfolio(1)(2) Instrument Corporate CDS Indices/ Tranches/ Single Name ABS CDS European Category Options/ Single Names and ABX Indices Sovereign Debt CMBX Units HY CDX OTR Bond Equivalent Value(3)(4) Bond Equivalent Value(4) Market Value Bond Equivalent Value(4) • EFC’s dynamic credit hedging strategy seeks to reduce book value volatility Q2 2021 EARNINGS 18
Agency Interest Rate Hedging Portfolio(1)

 We deploy a dynamic and adaptive hedging strategy to preserve book value

                             As of 6/30/2021                                                                                  As of 3/31/2021
                     Short $398.5mm 10-yr equivalents(1)                                                              Short $491.5mm 10-yr equivalents(1)

  • We hedge along the entire yield curve to protect against volatility, defend book value and more thoroughly control interest rate risk
  • Shorting “generic” pools (or TBAs) allows EFC to significantly reduce interest rate risk and basis risk in its Agency portfolio
          • For those Agency pools hedged with comparable TBAs, the biggest risk is a drop in “pay-ups”
          • Average pay-ups on our specified pools increased to 1.10% as of 6/30/2021, as compared to 1.02% as of 3/31/2021, driven by increases in
            projected prepayments as a result of declining mortgage rates
          • During the quarter, we reduced the size of our net short TBA positions
  • We also hedge interest rate risk with swaps, U.S. Treasury securities, and other instruments

Q2 2021 EARNINGS                                                                                                                                            19
Agency Interest Rate Hedging Portfolio (continued)
Net Agency Pool Exposure Based on Fair Value(1)
As of 6/30/2021 As of 3/31/2021
• EFC often carries significantly lower net effective mortgage • Use of TBA short positions as hedges helps drive outperformance
exposure than our “headline” Agency leverage suggests in volatile quarters
• Our net long exposure to Agency pools increased to 4.2:1 from • When interest rates spike, TBA short positions not only extend with
3.1:1, quarter over quarter, as we increased the size of our long specified pool assets, but they tend to extend more than specified
TBA portfolio and reduced the size of our TBA short position during pool assets, which dynamically and automatically hedges a
the quarter correspondingly larger portion of our specified pool portfolio
Q2 2021 EARNINGS 20CPR Breakout of Agency Fixed Long Portfolio
Average for Quarter Ended 6/30/2021(1) Average for Quarter Ended 3/31/2021(1)
Collateral Characteristics and Historical 3-Mo CPR Collateral Characteristics and Historical 3-Mo CPR
Q2 2021 EARNINGS 21Repo Borrowings(1)
Borrowings by Days to Maturity
($ in thousands) Repo Borrowings as of June 30, 2021
% of Total
Remaining Days to Maturity Credit Agency U.S. Treasury Total
Borrowings
30 Days or Less $ 15,906 $ 256,205 $ - $ 272,111 14.2%
31-90 Days 170,161 602,143 - 772,304 40.3%
91-180 Days 143,945 128,330 - 272,275 14.2%
181-360 Days 133,234 441,825 - 575,059 30.0%
>360 Days 25,000 - - 25,000 1.3%
Total Borrowings $ 488,246 $1,428,503 $ - $ 1,916,749 100.0%
Weighted Average Remaining Days to
185 121 - 137
Maturity
• Repo borrowings with 24 counterparties, with the largest representing approximately 21% of total repo borrowings
• Weighted average remaining days to maturity of 137 days
• Added a new commercial mortgage loan financing facility during the quarter
• Maturities are staggered to mitigate liquidity risk
Q2 2021 EARNINGS 22Resilient Profit Generation Over Market Cycles(1)
Generated a Gross Profit Every Year Since Inception
Six-Month COVID
($ in thousands) Period Ended Pandemic Years Ended
June 30
2021 2020 2019 2018 2017 2016 2015
Long: Credit $103,114 12.6% $63,052 8.4% $73,919 11.6% $61,201 10.0% $61,136 9.6% $36,203 5.3% $46,892 6.1%
Credit Hedge and Other 2,388 0.3% (1,289) -0.2% (11,237) -1.8% 8,020 1.3% (11,997) -1.9% (40,548) -5.9% 10,671 1.4%
Interest Rate Hedge: Credit 525 0.1% (7,938) -1.1% (1,345) -0.2% 115 0.0% (851) -0.1% (371) -0.1% (4,899) -0.6%
Long: Agency (12,567) -1.5% 45,957 6.1% 48,175 7.5% (5,979) -1.0% 10,246 1.6% 17,166 2.5% 23,629 3.1%
Interest Rate Hedge and Other: Agency 11,445 1.4% (33,672) -4.5% (25,309) -4.0% 3,144 0.5% (5,218) -0.8% (8,226) -1.2% (17,166) -2.2%
Gross Profit (Loss) $104,905 12.8% $66,110 8.8% $84,203 13.2% $66,501 10.9% $53,316 8.4% $4,224 0.6% $59,127 7.7%
($ in thousands) Years Ended
2014 2013 2012 2011 2010 2009 2008
Long: Credit $77,636 11.4% $109,536 18.5% $129,830 30.0% $1,505 0.4% $70,840 21.9% $101,748 36.3% (64,565) -26.2%
Credit Hedge and Other (1,197) -0.2% (19,286) -3.3% (14,642) -3.4% 19,895 5.2% (7,958) -2.5% 10,133 3.6% 78,373 31.8%
Interest Rate Hedge: Credit (9,479) -1.4% 8,674 1.5% (3,851) -0.9% (8,171) -2.1% (12,150) -3.8% (1,407) -0.5% (3,446) -1.4%
Long: Agency 61,126 9.0% (14,044) -2.4% 37,701 8.7% 63,558 16.5% 21,552 6.7% 22,171 7.9% 4,763 1.9%
Interest Rate Hedge and Other: Agency (47,634) -7.0% 19,110 3.2% (20,040) -4.6% (54,173) -14.0% (14,524) -4.5% (8,351) -3.0% (6,414) -2.6%
Gross Profit (Loss) $80,452 11.8% $103,990 17.6% $128,998 29.8% $22,614 5.9% $57,760 17.8% $124,294 44.4% $8,711 3.5%
Note: Percentages of average equity during period
Taper Tantrum
Credit
Q2 2021 EARNINGS Crisis 23Total Return Since Inception
EFC has successfully preserved book value over market cycles, while producing strong results for investors
• EFC life-to-date diluted net asset value-based total return from inception in August 2007 through Q2 2021 is approximately 260%, or 9.7% annualized(1)
Diluted BVPS Plus Cumulative Dividends
Q2 2021 EARNINGS 24Capital, Leverage & Portfolio Composition Capital Usage Across Entire Portfolio(1) Leverage by Strategy (Debt-to-Equity)(1) Credit and Agency Portfolios by Fair Value(3) Average Price – Credit and Agency(2)(3) $ in Millions Q2 2021 EARNINGS 25
Condensed Consolidated Balance Sheet (Unaudited)

     (in thousands, except share and per share amounts)                                                                          June 30, 2021          March 31, 2021
     Assets
       Cash and cash equivalents                                                                                             $             134,695 $              149,350
       Restricted cash                                                                                                                         175                    175
       Securities, at fair value                                                                                                         1,860,990              1,909,127
       Loans, at fair value                                                                                                              1,742,701              1,582,516
       Investments in unconsolidated entities, at fair value                                                                               178,979                147,684
       Real estate owned                                                                                                                    35,295                 35,557
       Financial derivatives – assets, at fair value                                                                                        13,028                 23,082
       Reverse repurchase agreements                                                                                                       160,412                 96,783
       Due from brokers                                                                                                                     76,396                 91,814
       Investment related receivables                                                                                                       75,781                 67,338
       Other assets                                                                                                                          4,229                  3,499
     Total Assets                                                                                                            $           4,282,681 $            4,106,925
     Liabilities
       Securities sold short, at fair value                                                                                                145,374                 96,398
       Repurchase agreements                                                                                                             1,916,749              1,909,511
       Financial derivatives – liabilities, at fair value                                                                                   14,171                 19,438
       Due to brokers                                                                                                                        2,130                  5,337
       Investment related payables                                                                                                          29,457                 40,836
       Other secured borrowings                                                                                                             86,374                 64,506
       Other secured borrowings, at fair value                                                                                           1,003,037                911,256
       Senior notes, net                                                                                                                    85,693                 85,627
       Base management fee payable to affiliate                                                                                              3,355                  3,277
       Incentive fee payable to affiliate                                                                                                    7,157                       -
       Dividend payable                                                                                                                      7,963                  5,740
       Interest payable                                                                                                                      3,000                  1,915
       Accrued expenses and other liabilities                                                                                               23,117                 19,708
     Total Liabilities                                                                                                       $           3,327,577 $            3,163,549
     Equity
       Preferred stock, par value $0.001 per share, 100,000,000 shares authorized; 6.750% Series A Fixed-to-Floating
       Rate Cumulative Redeemable; 4,600,000 shares issued and outstanding, respectively ($115,000 liquidation preference)   $            111,034   $             111,034
       Common stock, par value $0.001 per share, 100,000,000 shares authorized;
       (43,781,684 and 43,781,684 shares issued and outstanding, respectively)                                                                  44                      44
       Additional paid-in-capital                                                                                                          915,817                 915,577
       Retained earnings (accumulated deficit)                                                                                           (103,409)               (116,799)
     Total Stockholders’ Equity                                                                                              $            923,486 $               909,856
       Non-controlling interests                                                                                                            31,618                  33,520
     Total Equity                                                                                                            $            955,104 $               943,376
       Total Liabilities and Equity                                                                                          $          4,282,681 $             4,106,925
     Supplemental Per Share Information:
       Book Value Per Common Share(1)                                                                                        $              18.47 $                 18.16

Q2 2021 EARNINGS                                                                                                                                                             26
Condensed Consolidated Statement of Operations (Unaudited)
Three-Month Period Ended
(In thousands, except per share amounts) June 30, 2021 March 31, 2021
Net Interest Income
Interest income $ 45,890 $ 40,079
Interest expense (11,166) (11,342)
Total net interest income $ 34,724 $ 28,737
Other Income (Loss)
Realized gains (losses) on securities and loans, net (2,009) 4,276
Realized gains (losses) on financial derivatives, net 425 5,795
Realized gains (losses) on real estate owned, net (74) 61
Unrealized gains (losses) on securities and loans, net 10,000 (1,781)
Unrealized gains (losses) on financial derivatives, net (5,683) 10,711
Unrealized gains (losses) on real estate owned, net (1,314) (792)
Other, net 4,363 1,960
Total other income (loss) 5,708 20,230
Expenses
Base management fee to affiliate (Net of fee rebates of $195 and $194, respectively) 3,355 3,277
Incentive fee to affiliate 7,157 -
Investment related expenses:
Servicing expense 974 986
Debt insurance costs related to Other secured borrowings, at fair value 2,039 1,665
Other 1,818 2,204
Professional fees 1,037 1,198
Compensation expense 1,412 1,420
Other expenses 1,633 1,579
Total expenses 19,425 12,329
Net Income (Loss) before Income Tax Expense (Benefit) and Earnings from Investments
in Unconsolidated Entities 21,007 36,638
Income tax expense (benefit) 3,140 2,017
Earnings (losses) from investments in unconsolidated entities 18,602 6,635
Net Income (Loss) $ 36,469 $ 41,256
Net Income (Loss) Attributable to Non-Controlling Interests 1,874 1,459
Dividends on Preferred Stock 1,940 1,941
Net Income (Loss) Attributable to Common Stockholders $ 32,655 $ 37,856
Net Income (Loss) per Common Share
Basic and Diluted $ 0.75 $ 0.86
Weighted average shares of common stock outstanding 43,782 43,782
Weighted average shares of common stock and convertible units outstanding 44,460 44,448
Q2 2021 EARNINGS 27Reconciliation of Net Income (Loss) to Core Earnings(1)
Three-Month Period Ended
(in thousands, except per share amounts) June 30, 2021 March 31, 2021
Net Income (Loss) $ 36,469 $ 41,256
Income tax expense (benefit) 3,140 2,017
Net income (loss) before income tax expense $ 39,609 $ 43,273
Adjustments:
Realized (gains) losses on securities and loans, net 2,009 (4,276)
Realized (gains) losses on financial derivatives, net (425) (5,795)
Realized (gains) losses on real estate owned, net 74 (61)
Unrealized (gains) losses on securities and loans, net (10,000) 1,781
Unrealized (gains) losses on financial derivatives, net 5,683 (10,711)
Unrealized (gains) losses on real estate owned, net 1,314 792
(2)
Other realized and unrealized (gains) losses, net (2,166) (602)
Net realized gains (losses) on periodic settlements of interest rate swaps 77 (816)
Net unrealized gains (losses) on accrued periodic settlements of interest rate swaps (709) 410
Incentive fee to affiliate 7,157 -
Non-cash equity compensation expense 244 229
Negative (positive) component of interest income represented by
Catch-up Premium Amortization Adjustment (3,041) 87
Debt issuance costs related to Oher secured borrowings, at fair value 2,039 1,665
Non-recurring expenses 248 -
(3)
(Earnings) losses from investments in unconsolidated entities (16,313) (4,178)
Total Core Earnings $ 25,800 $ 21,798
Dividends on preferred stock 1,940 1,941
Core Earnings attributable to non-controlling interests 1,609 1,045
Core Earnings Attributable to Common Stockholders $ 22,251 $ 18,812
Core Earnings Attributable to Common Stockholders, per share $ 0.51 $ 0.43
Q2 2021 EARNINGS 28About Ellington Management Group
Ellington and its Affiliated Management Companies
Ellington Profile
As of 6/30/2021
• Our external manager Ellington Financial Management LLC is part of the
Ellington family of SEC-registered investment advisors(4). Ellington
Founded: 1994 Management Group and its affiliates manage Ellington Financial Inc. (EFC),
Employees: >150 Ellington Residential Mortgage REIT (EARN), multi-investor hedge funds,
Investment Professionals: 68 separately managed accounts, and opportunistic private funds
Global offices: 3 • Time-tested infrastructure and proprietary resources in trading, research,
risk management, and operational support
• Founding partners each have advanced academic training in mathematics
and engineering, including among them several Ph.D.’s and Master’s
$12.7 14 degrees
Billion in Employee-partners
assets under own
management as of the firm(2)
6/30/2021(1) Industry-Leading Research & Trading Expertise
• Sophisticated proprietary models for prepayment and credit analysis
• Approximately 25% of employees dedicated to research and technology
26 8% • Structured credit trading experience and analytical skills developed since
the firm’s founding 26 years ago
Years of average Management’s
industry experience ownership of EFC, • Ellington’s portfolio managers are among the most experienced in the MBS
of senior portfolio representing sector and the firm’s analytics have been developed over its 26-year history
managers strong alignment(3)
Q2 2021 EARNINGS 29Investment Highlights of EFC
Diversified investment Proprietary portfolio of high- Dynamic interest-rate and
portfolio across residential yielding, short-duration loans credit hedging designed to
mortgage, commercial reduce volatility of book value
mortgage, consumer loan, and earnings
and corporate loan sectors
Supplement earnings with Diversified sources of Strong alignment with
book value accretion via share financing, including long term 8% co-investment(1)
repurchases when stock price non mark-to-market financing
is deeply discounted facilities and securitizations
Q2 2021 EARNINGS 30Endnotes
Slide 3 – Second Quarter Highlights
(1) Holdings, leverage, equity and book value amounts are as of June 30, 2021.
(2) Economic return is based on book value per share.
(3) Core Earnings is a non-GAAP financial measure. See slide 28 for a reconciliation of Core Earnings to Net Income (Loss).
(4) Gross income (loss) includes interest income and other income, net realized and change in net unrealized gains (losses), net interest rate hedges, net credit hedges and other activities, interest expense, other
investment related expenses, and earnings (losses) from investments in unconsolidated entities, if applicable. It excludes other interest income (expense), management fees, income tax (expense) and other
expenses.
(5) Includes REO at the lower of cost or fair value. Excludes hedges and other derivative positions.
(6) For our consolidated non-QM securitization trusts, excludes tranches that were sold to third parties, but that are consolidated for GAAP purposes. Including such tranches, the Company’s total long credit portfolio
was $2.342 billion as of June 30, 2021.
(7) Overall debt-to-equity ratio is computed by dividing EFC’s total debt by EFC’s total equity. The debt-to-equity ratio does not account for liabilities other than debt financings. Excludes repo borrowings on U.S.
Treasury securities.
(8) Excludes repo borrowings on U.S. Treasury securities and borrowings at certain unconsolidated entities that are recourse to us. Including such borrowings, our debt-to-equity ratio based on total recourse
borrowings is 2.0:1 as of June 30, 2021.
(9) Rated by Egan-Jones Rating Company. A rating is not a recommendation to buy, sell or hold securities. Ratings may be subject to revision or withdrawal at any time by the assigning rating organization. Each rating
should be evaluated independently of any other rating.
(10) Management and directors’ ownership includes common shares, operating partnership units, and LTIP units held by officers and directors of EFC, and partners and affiliates of Ellington (including families and
family trusts of the foregoing). Based on share price.
Slide 4 – Portfolio Summary as of June 30, 2021
(1) See endnote (5) on slide 3.
(2) Of deployed capital, 80% allocated to credit and 20% to agency.
(3) Average price excludes interest only, principal only, equity tranches and other similar securities and non-exchange traded corporate equity. All averages in this table are weighted averages using fair value, except
for average price which uses current principal balance.
(4) Average price of consumer loans and ABS is proprietary.
(5) Weighted average life assumes “projected” cashflows using Ellington’s proprietary models. Excludes interest only, principal only, equity tranches.
(6) Estimated yields at market prices are management’s estimates derived from Ellington’s proprietary models based on prices and market environment as of June 30, 2021 and include the effects of future
estimated losses. The above analysis should not be considered a recommendation to purchase or sell any security or class of securities. Results are based on forward-looking models, which are inherently
imperfect, and incorporate various simplifying assumptions. Therefore, the table is for illustrative purposes only and the actual performance of our portfolio may differ from the data presented, and such
differences might be significant and adverse.
(7) REO and equity investments in loan origination entities are excluded from total average calculations.
(8) For our consolidated non-QM securitization trusts, excludes tranches that were sold to third parties, but that are consolidated for GAAP purposes.
(9) REO is not considered a financial instrument and as a result is included at the lower of cost or fair value.
(10) Includes equity investments in unconsolidated entities holding small balance commercial mortgage loans and REO. Including our allocable portion of the fair value of small-balance commercial loans and REO of
the equity investments in unconsolidated entities, our total CMBS and Commercial Mortgage Loans and REO was $424.5 million.
(11) Includes equity investments in securitization-related vehicles.
(12) Includes an equity investment in an unconsolidated entity holding European RMBS.
(13) Excludes repo borrowings on U.S. Treasury securities and borrowings at certain unconsolidated entities that are recourse to us. In determining the debt-to-equity ratio for an individual strategy, equity usage for
such strategy is based on an internal calculation that reflects the actual amount of capital posted to counterparties in connection with such strategy’s positions (whether in the form of haircut, initial margin, prime
brokerage requirements, or otherwise) plus additional capital allocated to support such strategy’s positions, net of adjustments for readily financeable assets and securities that may be sold to increase liquidity on
short notice. The Company refers to the excess of its total equity over the total risk capital of its strategies as its “risk capital buffer”. If the debt-to-equity ratios for individual strategies were computed solely based
on the actual amount of capital posted to counterparties, such ratios would typically be higher. The debt-to-equity ratio does not account for liabilities other than debt financings.
(14) See endnote (7) on slide 3.
(15) See endnote (8) on slide 3.
Slide 5 – Operating Results by Strategy
(1) Other income primarily consists of rental income on real estate owned and loan origination fees.
(2) Includes U.S. Treasury securities, if applicable.
(3) Other activities include certain equity and other trading strategies and related hedges, and net realized and unrealized gains (losses) on foreign currency.
(4) Includes allocable portion of interest expense on the Company's Senior Notes.
(5) Convertible units include Operating Partnership units attributable to non-controlling interests.
Q2 2021 EARNINGS 31Endnotes
Slide 6 – Long Credit Portfolio
(1) See endnote (5) on slide 3. For our consolidated non-QM securitization trusts, excludes tranches that were sold to third parties, but that are consolidated for GAAP purposes. Including such tranches, the
Company’s total long credit portfolio was $2.342 billion as of June 30, 2021 and $2.187 billion as of March 31, 2021 .
(2) Includes equity investments in securitization-related vehicles.
(3) REO is not considered a financial instrument and as a result is included at the lower of cost or fair value.
(4) Includes equity investments in unconsolidated entities holding small balance commercial mortgage loans and REO. Including our allocable portion of the fair value of small-balance commercial loans and REO of
the equity investments in unconsolidated entities, our total CMBS and Commercial Mortgage Loans and REO were $424.5 million as of June 30, 2021 and $371.5 million as of March 31, 2021.
(5) Includes an equity investment in an unconsolidated entity holding European RMBS.
Slide 7 – Long Agency Portfolio
(1) Agency long portfolio includes $1.437 billion of long Agency securities and $39.0 million of interest only securities as of June 30, 2021 and $ 1.439 billion of long Agency securities and $49.1 million of interest
only securities as of March 31, 2021.
(2) Represents weighted average net pass-through rate. Excludes interest only securities.
Slide 8 – Summary of Borrowings
(1) Includes Other secured borrowings and Other secured borrowings, at fair value.
(2) All of our non-recourse borrowings are secured by collateral. In the event of default under a non-recourse borrowing, the lender has a claim against the collateral but not any of the Operating Partnership’s other
assets. In the event of default under a recourse borrowing, the lender's claim is not limited to the collateral (if any).
(3) See endnote (8) on slide 3.
(4) See endnote (7) on slide 3.
Slide 9 – Diversified Credit Portfolio
(1) Subject to maintaining our qualification as a REIT.
(2) Excludes hedges and other derivative positions.
(3) For our consolidated non-QM securitization trusts, only retained tranches are included (i.e., excludes tranches sold to third parties).
Slide 10- Small Balance Commercial Mortgage Loan Portfolio – Detail
(1) Percentages are of unpaid principal balance.
(2) Includes our allocable portion of certain small-balance commercial loans, based on our ownership percentage, held in entities in which we and certain affiliates of Ellington have equity interests. Our equity
investments in such entities are included in Investments in unconsolidated entities, at fair value on the Condensed Consolidated Balance Sheet.
Slide 11- Proprietary Loan Origination Businesses
(1) For our consolidated non-QM securitization trusts, excludes tranches that were sold to third parties, but that are consolidated for GAAP purposes.
(2) Includes our allocable portion of the fair value of certain small-balance commercial loans, based on our ownership percentage, held in entities in which we and certain affiliates of Ellington have equity interests.
Our equity investments in such entities are included in Investments in unconsolidated entities, at fair value on the Condensed Consolidated Balance Sheet.
Slide 12 – Stable Economic Return
(1) Source: Company filings.
(2) Economic return is computed by adding back dividends to ending book value per share, and comparing that amount to book value per share as of the beginning of the quarter.
Slide 13 – Interest Rate Sensitivity Analysis
(1) The table reflects the estimated effects on the value of our portfolio, both overall and by category, of hypothetical, immediate, 50 basis point downward and upward parallel shifts in interest rates, based on the
market environment as of June 30, 2021. The preceding analysis does not include sensitivities to changes in interest rates for instruments which we believe that the effect of a change in interest rates is not
material to the value of the overall portfolio and/or cannot be accurately estimated. In particular, this analysis excludes certain corporate securities and derivatives on corporate securities, and reflects only
sensitivity to U.S. interest rates. Results are based on forward-looking models, which are inherently imperfect, and incorporate various simplifying assumptions. Therefore, the table is for illustrative purposes only
and actual changes in interest rates would likely cause changes in the actual value of our portfolio that would differ from those presented, and such differences might be significant and adverse.
Slide 14 – Commitment to ESG
(1) See endnote (10) on slide 3.
Q2 2021 EARNINGS 32Endnotes
Slide 16 – Second Quarter Market Update
(1) Source: Bloomberg
(2) Source: Mortgage Bankers Association via Bloomberg
(3) Source: J.P. Morgan Markets
(4) LIBOR-based OAS measures the additional yield spread over LIBOR that an asset provides at its current market price after taking into account any interest rate options embedded in the asset.
(5) LIBOR-based Zero-volatility spread (Z-spread) measures the additional yield spread over LIBOR that the projected cash flows of an asset provide at the current market price of the asset.
Slide 17– Derivatives Summary
(1) In the table, fair value of certain derivative transactions are shown on a net basis. The accompanying financial statements separate derivative transactions as either assets or liabilities. As of June 30, 2021,
derivative assets and derivative liabilities were $13.0 million and $(14.2) million, respectively, for a net fair value of $(1.1) million, as reflected in "Net Total".
(2) Notional value represents the face amount of the underlying asset.
(3) Notional value represents the maximum number of shares available to be purchased upon exercise.
(4) Notional value represents the total face amount of U.S. Treasury securities underlying all contracts held. As of June 30, 2021 a total of 19 long and 1,558 short U.S. Treasury futures contracts were held.
(5) Short notional value represents U.S. Dollars to be received by us at the maturity of the forward contract.
Slide 18 – Credit Hedging Portfolio
(1) The Credit Hedging Portfolio excludes both legs of certain relative value trades which we believe do not affect the overall hedging position of the portfolio. Consequently, the amounts shown here may differ
materially (i) from those that would be shown were all positions in the included instruments displayed and (ii) from that presented on the Derivatives Summary shown on slide 17.
(2) There can be no assurance that instruments in the Credit Hedging Portfolio will be effective portfolio hedges.
(3) Corporate derivatives displayed in HY CDX OTR Equivalents represent the net, on-the-run notional equivalents of Markit CDX North American High Yield Index (the “HY Index”) of those derivatives converted to
equivalents based on techniques used by the Company for estimating the price relationships between them and the HY Index. These include estimations of the relationships between different credits and even
different sectors (such as the US high yield, European high yield, and US investment grade debt markets). The Company's estimations of price relationships between instruments may change over time. Actual price
relationships experienced may differ from those previously estimated.
(4) Bond Equivalent Value represents the investment amount of a corresponding position in the reference obligation or index constituents, calculated assuming a price equal to the difference between (i) par and (ii)
the tear up price. Corporate CDS Indices, Tranches, Options and Single Names are converted to HY CDX OTR Equivalents prior to being displayed as Bond Equivalent Values.
Slide 19 – Agency Interest Rate Hedging Portfolio
(1) Agency interest rate hedges are shown in normalized units of risk, with each group of positions measured in “10-year equivalents; “10-year equivalents” for a group of positions represent the amount of 10-year
U.S. Treasury securities that would be expected to experience a similar change in market value under a standard parallel move in interest rates.
Slide 20 – Agency Interest Rate Hedging Portfolio (continued)
(1) We define our net Agency pool assets-to-equity ratio as the net aggregate market value of our Agency pools of $1.437 billion and our long and short TBA positions of $(640) million, divided by the equity allocated
to our Agency strategy of $192 million, as of June 30, 2021. As of March 31, 2021, our net Agency pool assets-to-equity ratio was the net aggregate market value of our Agency pools of $1.439 billion and our long
and short TBA positions of $(817) million, divided by the equity allocated to our Agency strategy of $201 million. In determining the debt-to-equity ratio for an individual strategy, equity usage for such strategy is
based on an internal calculation that reflects the actual amount of capital posted to counterparties in connection with such strategy’s positions (whether in the form of haircut, initial margin, prime brokerage
requirements, or otherwise) plus additional capital allocated to support such strategy’s positions, net of adjustments for readily financeable assets and securities that may be sold to increase liquidity on short
notice. The Company refers to the excess of its total equity over the total risk capital of its strategies as its “risk capital buffer”. If the debt-to-equity ratios for individual strategies were computed solely based on
the actual amount of capital posted to counterparties, such ratios would typically be higher. The debt-to-equity ratio does not account for liabilities other than debt financings.
Slide 21 – CPR Breakout of Agency Fixed Long Portfolio
(1) Does not include long TBA positions, reverse mortgage pools, or fixed rate IOs.
(2) Classification methodology may change over time as market practices change.
(3) Fair value shown in millions.
(4) “MHA” indicates those pools where underlying borrowers have participated in the Making Homes Affordable program.
Slide 22 – Repo Borrowings
(1) Included in the table, using the original maturity dates, are any repos involving underlying investments we sold prior to June 30, 2021 for settlement following June 30, 2021 even though we may expect to
terminate such repos early. Not included are any repos that we may have entered into prior to June 30, 2021, for which delivery of the borrowed funds is not scheduled until after June 30, 2021. Remaining
maturity for a repo is based on the contractual maturity date in effect as of June 30, 2021. Some repos have floating interest rates, which may reset before maturity.
Q2 2021 EARNINGS 33Endnotes
Slide 23 – Resilient Profit Generation Over Market Cycles
(1) Gross profit excludes expenses other than interest expense and other investment related expenses. Figures in “%” columns are as a percentage of average equity for the period.
Slide 24 – Total Return Since Inception
(1) Total return is based on $18.61 net diluted book value per share at inception in August 2007 and is calculated assuming the reinvestment of dividends at diluted book value per share and assumes all convertible
units were converted into common shares at their issuance dates.
Slide 25 – Capital, Leverage & Portfolio Composition
(1) Excludes U.S. Treasury securities. In determining the debt-to-equity ratio for an individual strategy, equity usage for such strategy is based on an internal calculation that reflects the actual amount of capital posted
to counterparties in connection with such strategy’s positions (whether in the form of haircut, initial margin, prime brokerage requirements, or otherwise) plus additional capital allocated to support such strategy’s
positions, net of adjustments for readily financeable assets and securities that may be sold to increase liquidity on short notice. The Company refers to the excess of its total equity over the total risk capital of its
strategies as its “risk capital buffer”. If the debt-to-equity ratios for individual strategies were computed solely based on the actual amount of capital posted to counterparties, such ratios would typically be higher.
The debt-to-equity ratio does not account for liabilities other than debt financings.
(2) Excludes interest only, principal only, equity tranches and other similar investments and REO.
(3) See endnote (5) on slide 3. Excludes tranches of our non-QM securitization trusts, that were sold to third parties, but that are consolidated for GAAP purposes.
Slide 26 – Condensed Consolidated Balance Sheet (Unaudited)
(1) Based on total stockholders’ equity less the aggregate liquidation preference of our preferred stock outstanding.
Slide 28 – Reconciliation of Net Income (Loss) to Core Earnings
(1) We calculate Core Earnings as U.S. GAAP net income (loss) as adjusted for: (i) realized and unrealized gain (loss) on securities and loans, REO, financial derivatives (excluding periodic settlements on interest rate
swaps), other secured borrowings, at fair value, and foreign currency transactions; (ii) incentive fee to affiliate; (iii) Catch-up Premium Amortization Adjustment (as defined below); (iv) non-cash equity compensation
expense; (v) provision for income taxes and (vi) certain other income or loss items that are of a non-recurring nature. For certain investments in unconsolidated entities, we include the relevant components of net
operating income in Core Earnings. The Catch-up Premium Amortization Adjustment is a quarterly adjustment to premium amortization triggered by changes in actual and projected prepayments on our agency
RMBS (accompanied by a corresponding offsetting adjustment to realized and unrealized gains and losses). The adjustment is calculated as of the beginning of each quarter based on our then-current
assumptions about cashflows and prepayments, and can vary significantly from quarter to quarter. Core Earnings is a supplemental non-GAAP financial measure. We believe that the presentation of Core Earnings
provides a consistent measure of operating performance by excluding the impact of gains and losses and other adjustments listed above from operating results. We believe that Core Earnings provides information
useful to investors because it is a metric that we use to assess our performance and to evaluate the effective net yield provided by the portfolio. In addition, we believe that presenting Core Earnings enables our
investors to measure, evaluate, and compare our operating performance to that of our peers. However, because Core Earnings is an incomplete measure of our financial results and differs from net income (loss)
computed in accordance with U.S. GAAP, it should be considered as supplementary to, and not as a substitute for, net income (loss) computed in accordance with U.S. GAAP. The table above reconciles, for the
three-month period and year ended June 30, 2021 and the three-month period ended March 31, 2021, our Core Earnings to the line on the Consolidated Statement of Operations entitled Net Income (Loss),
which we believe is the most directly comparable U.S. GAAP measure.
(2) Includes realized and unrealized gains (losses) on foreign currency and unrealized gain (loss) on other secured borrowings, at fair value included in Other, net, on the Condensed Consolidated Statement of
Operations.
(3) Adjustment represents, for certain investments in unconsolidated entities, the net realized and unrealized gains and losses of the underlying investments of such entities.
Slide 29 – About Ellington Management Group
(1) $12.7 billion in assets under management includes approximately $1.3 billion in Ellington-managed CLOs. For these purposes, the Ellington-managed CLO figure represents the aggregate outstanding balance of
CLO notes and market value of CLO equity, excluding any notes and equity held by other Ellington-managed funds and accounts.
(2) Does not include partners formerly employed by Ellington who may have residual capital balances but who no longer have voting rights in the partnership.
(3) See endnote (10) on slide 3.
(4) Registration with the SEC does not imply that the firm or any of its principals or employees possess a particular level of skill or training in the investment advisory or any other business.
Slide 30 – Investment Highlights of EFC
(1) See endnote (10) on slide 3.
Q2 2021 EARNINGS 34You can also read