Supplemental Information Package and Non-GAAP Reconciliations - First Quarter March 31, 2022 - Investors | Crown Castle
←
→
Page content transcription
If your browser does not render page correctly, please read the page content below

Supplemental Information Package
 and Non-GAAP Reconciliations
     First Quarter • March 31, 2022

                                      The pathway to possible.
                                              CrownCastle.com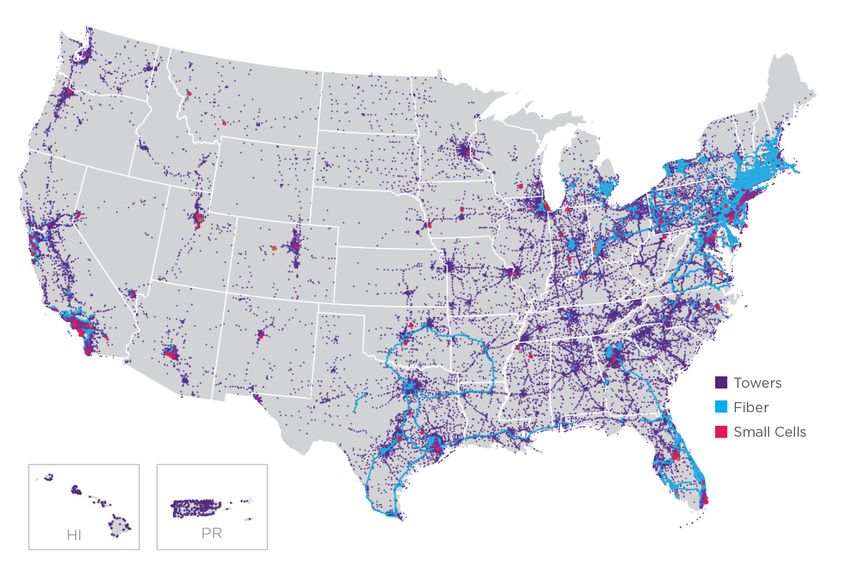
Crown Castle International Corp.
                                                        First Quarter 2022

                                                TABLE OF CONTENTS
                                                                                            Page
Company Overview
    Company Profile                                                                          3
    Strategy                                                                                 3
    AFFO per Share                                                                           5
    Asset Portfolio Footprint                                                                5
    General Company Information, Executive Management Team and Board of Directors            6
    Research Coverage                                                                        7
    Summary Historical Common Stock Data                                                     7
    Portfolio and Financial Highlights                                                       8
    Outlook                                                                                  9
Financials & Metrics
    Condensed Consolidated Balance Sheet                                                     12
    Condensed Consolidated Statement of Operations                                           13
    Segment Operating Results                                                                14
    Fiber Segment Site Rental Revenues Summary                                               14
    FFO and AFFO Reconciliations                                                             15
    Condensed Consolidated Statement of Cash Flows                                           16
    Components of Changes in Site Rental Revenues                                            16
    Summary of Site Rental Straight-Lined Revenues and Expenses and Prepaid Rent Activity    17
    Summary of Capital Expenditures                                                          18
    Projected Revenues from Tenant Contracts                                                 18
    Projected Expenses from Existing Ground Leases and Fiber Access Agreements               18
    Annualized Rental Cash Payments at Time of Renewal                                       18
    Consolidated Tenant Overview                                                             19
    Fiber Solutions Revenue Mix                                                              19
    Segment Cash Yields on Invested Capital                                                  20
    Consolidated Return on Invested Capital                                                  20
Asset Portfolio Overview
    Summary of Tower Portfolio by Vintage                                                    21
    Tower Portfolio Overview                                                                 22
    Distribution of Tower Tenancy                                                            23
    Ground Interest Overview                                                                 24
    Ground Interest Activity                                                                 24
Capitalization Overview
    Capitalization Overview                                                                  25
    Debt Maturity Overview                                                                   26
    Liquidity Overview                                                                       27
    Summary of Maintenance and Financial Covenants                                           27
    Interest Rate Sensitivity                                                                28
Appendix                                                                                     29

                                                                 1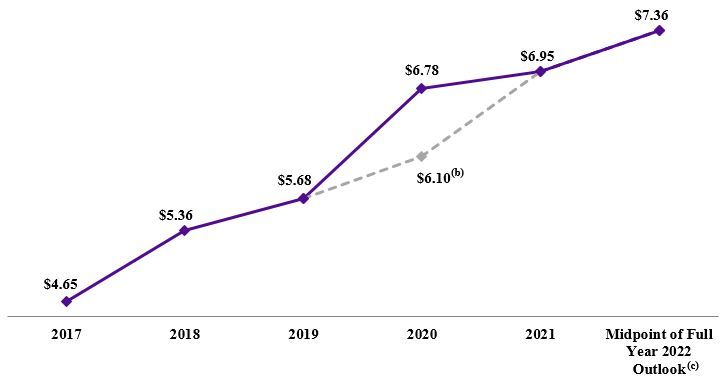
Crown Castle International Corp.
                                                            First Quarter 2022

Cautionary Language Regarding Forward-Looking Statements
This supplemental information package ("Supplement") contains forward-looking statements and information that are based on our
management's current expectations as of the date of this Supplement. Statements that are not historical facts are hereby identified as
forward-looking statements. Words such as "Outlook," "guide," "forecast," "estimate," "anticipate," "project," "plan," "intend,"
"believe," "expect," "likely," "predicted," "positioned," and any variations of these words and similar expressions are intended to
identify such forward looking statements. Such statements include plans, projections and estimates regarding (1) demand for data and
our communications infrastructure, and benefits derived therefrom, (2) cash flow growth, (3) tenant additions, (4) our Outlook for full
year 2022, (5) our business and strategy and the potential benefits derived therefrom, (6) strategic position of our assets, (7) revenues
from tenant contracts, (8) expenses from existing ground leases and fiber access agreements, (9) the recurrence and impact of
Nontypical Items, (10) availability under our 2016 Revolver and (11) the utility of certain financial measures, including non-GAAP
financial measures.

Such forward-looking statements are subject to certain risks, uncertainties and assumptions, including, but not limited to, prevailing
market conditions. Should one or more of these or other risks or uncertainties materialize, or should underlying assumptions prove
incorrect, actual results may vary materially from those expected. Crown Castle assumes no obligation to update publicly any forward-
looking statements, whether as a result of new information, future events or otherwise. More information about potential risk factors
which could affect our results is included in our filings with the Securities and Exchange Commission ("SEC"). Our filings with the
SEC are available through the SEC website at www.sec.gov or through our investor relations website at investor.crowncastle.com. We
use our investor relations website to disclose information about us that may be deemed to be material. We encourage investors, the
media and others interested in us to visit our investor relations website from time to time to review up-to-date information or to sign
up for e-mail alerts to be notified when new or updated information is posted on the site.

This Supplement contains certain figures, projections and calculations based in part on management's underlying assumptions.
Management believes these assumptions are reasonable; however, other reasonable assumptions could provide differing outputs.

The components of financial information presented herein, both historical and forward looking, may not sum due to rounding.
Definitions and reconciliations of non-GAAP financial measures, segment measures and other calculations are provided in the
Appendix to this Supplement.

As used herein, the term "including" and any variation thereof, means "including without limitation." The use of the word "or" herein
is not exclusive.

                                                                     2
Crown Castle International Corp.
First Quarter 2022
COMPANY ASSET PORTFOLIO CAPITALIZATION
FINANCIALS & METRICS APPENDIX
OVERVIEW OVERVIEW OVERVIEW
COMPANY PROFILE
Crown Castle International Corp. (to which the terms "Crown Castle," "CCIC," "we," "our," "the Company" or "us" as used herein
refer) owns, operates and leases shared communications infrastructure that is geographically dispersed throughout the U.S., including
more than (1) 40,000 towers and other structures, such as rooftops (collectively, "towers"), and (2) 80,000 route miles of fiber
primarily supporting small cell networks ("small cells") and fiber solutions. We refer to our towers, fiber and small cell assets
collectively as "communications infrastructure," and to our customers on our communications infrastructure as "tenants." Our towers
have a significant presence in each of the top 100 basic trading areas, and the majority of our small cells and fiber are located in major
metropolitan areas, including a presence within every major U.S. market.
Our operating segments consist of (1) Towers and (2) Fiber, which includes both small cells and fiber solutions. Our core business is
providing access, including space or capacity, to our shared communications infrastructure via long-term contracts in various forms,
including lease, license, sublease and service agreements (collectively, "tenant contracts"). We seek to increase our site rental revenues
by adding more tenants on our shared communications infrastructure, which we expect to result in significant incremental cash flows
due to our low incremental operating costs.
We operate as a Real Estate Investment Trust ("REIT") for U.S. federal income tax purposes.
STRATEGY
As a leading provider of shared communications infrastructure in the U.S., our strategy is to create long-term stockholder value via a
combination of (1) growing cash flows generated from our existing portfolio of communications infrastructure, (2) returning a
meaningful portion of our cash generated by operating activities to our common stockholders in the form of dividends and (3)
investing capital efficiently to grow cash flows and long-term dividends per share. Our strategy is based, in part, on our belief that the
U.S. is the most attractive market for shared communications infrastructure investment with the greatest long-term growth potential.
We measure our efforts to create "long-term stockholder value" by the combined payment of dividends to stockholders and growth in
our per-share results. The key elements of our strategy are to:
• Grow cash flows from our existing communications infrastructure. We are focused on maximizing the recurring site rental
cash flows generated from providing our tenants with long-term access to our shared infrastructure assets, which we
believe is the core driver of value for our stockholders. Tenant additions or modifications of existing tenant equipment
(collectively, "tenant additions") enable our tenants to expand coverage and capacity in order to meet increasing demand
for data, while generating high incremental returns for our business. We believe our product offerings of towers and small
cells provide a comprehensive solution to our wireless tenants' growing network needs through our shared communications
infrastructure model, which is an efficient and cost-effective way to serve our tenants. Additionally, we believe our ability
to share our fiber assets across multiple tenants to deploy both small cells and offer fiber solutions allows us to generate
cash flows and increase stockholder return.
• Return cash generated by operating activities to common stockholders in the form of dividends. We believe that
distributing a meaningful portion of our cash generated by operating activities appropriately provides common
stockholders with increased certainty for a portion of expected long-term stockholder value while still allowing us to retain
sufficient flexibility to invest in our business and deliver growth. We believe this decision reflects the translation of the
high-quality, long-term contractual cash flows of our business into stable capital returns to common stockholders.
• Invest capital efficiently to grow cash flows and long-term dividends per share. In addition to adding tenants to existing
communications infrastructure, we seek to invest our available capital, including the net cash generated by our operating
activities and external financing sources, in a manner that will increase long-term stockholder value on a risk-adjusted
basis. These investments include constructing and acquiring new communications infrastructure that we expect will
generate future cash flow growth and attractive long-term returns by adding tenants to those assets over time. Our historical
investments have included the following (in no particular order):
◦ construction of towers, fiber and small cells;
◦ acquisitions of towers, fiber and small cells;
◦ acquisitions of land interests (which primarily relate to land assets under towers);
◦ improvements and structural enhancements to our existing communications infrastructure;
◦ purchases of shares of our common stock from time to time; and
◦ purchases, repayments or redemptions of our debt.
3Crown Castle International Corp.
First Quarter 2022
COMPANY ASSET PORTFOLIO CAPITALIZATION
FINANCIALS & METRICS APPENDIX
OVERVIEW OVERVIEW OVERVIEW
Our strategy to create long-term stockholder value is based on our belief that there will be considerable future demand for our
communications infrastructure based on the location of our assets and the rapid growth in the demand for data. We believe that such
demand for our communications infrastructure will continue, will result in growth of our cash flows due to tenant additions on our
existing communications infrastructure, and will create other growth opportunities for us, such as demand for newly constructed or
acquired communications infrastructure, as described above. Further, we seek to augment the long-term value creation associated with
growing our recurring site rental cash flows by offering certain ancillary site development and installation services within our Towers
segment.
4Crown Castle International Corp.
First Quarter 2022
COMPANY ASSET PORTFOLIO CAPITALIZATION
FINANCIALS & METRICS APPENDIX
OVERVIEW OVERVIEW OVERVIEW
AFFO PER SHARE(a)
ASSET PORTFOLIO FOOTPRINT
(a) See "Non-GAAP Financial Measures, Segment Measures and Other Calculations" for further information and reconciliation of non-GAAP financial measures to
income (loss) from continuing operations, as computed in accordance with GAAP.
(b) Excludes the impact of nontypical items that were completed in fourth quarter 2020 ("Nontypical Items"), as described in our press release dated January 27, 2021
and reconciled in "Non-GAAP Financial Measures, Segment Measures and Other Calculations" herein.
(c) Calculated based on midpoint of full year 2022 Outlook as issued on April 20, 2022.
5Crown Castle International Corp.
First Quarter 2022
COMPANY ASSET PORTFOLIO CAPITALIZATION
FINANCIALS & METRICS APPENDIX
OVERVIEW OVERVIEW OVERVIEW
GENERAL COMPANY INFORMATION
Principal executive offices 8020 Katy Freeway, Houston, TX 77024
Common shares trading symbol CCI
Stock exchange listing New York Stock Exchange
Fiscal year ending date December 31
Fitch - Long Term Issuer Default Rating BBB+
Moody’s - Long Term Corporate Family Rating Baa3
Standard & Poor’s - Long Term Local Issuer Credit Rating BBB-
Note: These credit ratings may not reflect the potential risks relating to the structure or trading of the Company’s securities and are provided solely
for informational purposes. Credit ratings are not recommendations to buy, sell or hold any security, and may be revised or withdrawn at any time
by the issuing organization in its sole discretion. The Company does not undertake any obligation to maintain the ratings or to advise of any change
in the ratings. Each agency’s rating should be evaluated independently of any other agency’s rating. An explanation of the significances of the
ratings can be obtained from each of the ratings agencies.
EXECUTIVE MANAGEMENT TEAM
Years with
Name Age Company Position
Jay A. Brown 49 22 President and Chief Executive Officer
Daniel K. Schlanger 48 6 Executive Vice President and Chief Financial Officer
Catherine Piche 51 11 Executive Vice President and Chief Operating Officer - Towers
Christopher D. Levendos 54 3 Executive Vice President and Chief Operating Officer - Fiber
Kenneth J. Simon 61 6 Executive Vice President and General Counsel
Michael J. Kavanagh 53 11 Executive Vice President and Chief Commercial Officer
Philip M. Kelley 49 24 Executive Vice President - Corporate Development and Strategy
Laura B. Nichol 61 7 Executive Vice President - Business Support
BOARD OF DIRECTORS
Name Position Committees Age Years as Director
(a)
J. Landis Martin Chair NESG 76 26
P. Robert Bartolo Director Audit, Compensation 50 8
Cindy Christy Director Compensation, NESG(a), Strategy 56 14
Ari Q. Fitzgerald Director Compensation, NESG(a), Strategy 59 19
Anthony J. Melone Director Audit, NESG(a), Strategy 61 6
Jay A. Brown Director 49 5
Andrea J. Goldsmith Director NESG(a), Strategy 57 4
Lee W. Hogan Director Audit, Compensation, Strategy 77 21
Tammy K. Jones Director Audit, NESG(a) 56 1
W. Benjamin Moreland Director Strategy 58 15
Kevin A. Stephens Director Audit, Strategy 60 1
Matthew Thornton III Director Compensation, Strategy 63 1
(a) Nominating, Environmental, Social and Governance Committee
6Crown Castle International Corp.
First Quarter 2022
COMPANY ASSET PORTFOLIO CAPITALIZATION
FINANCIALS & METRICS APPENDIX
OVERVIEW OVERVIEW OVERVIEW
RESEARCH COVERAGE
Equity Research
Bank of America Barclays Citigroup
David Barden Tim Long Michael Rollins
(646) 855-1320 (212) 526-4043 (212) 816-1116
Cowen and Company Credit Suisse Deutsche Bank
Colby Synesael Sami Badri Matthew Niknam
(646) 562-1355 (212) 538-1727 (212) 250-4711
Goldman Sachs Green Street Jefferies
Brett Feldman David Guarino Jonathan Petersen
(212) 902-8156 (949) 640-8780 (212) 284-1705
JPMorgan KeyBanc LightShed Partners
Philip Cusick Brandon Nispel Walter Piecyk
(212) 622-1444 (503) 821-3871 (646) 450-9258
MoffettNathanson Morgan Stanley New Street Research
Nick Del Deo Simon Flannery Jonathan Chaplin
(212) 519-0025 (212) 761-6432 (212) 921-9876
Raymond James RBC Capital Markets Truist Securities
Ric Prentiss Jonathan Atkin Greg Miller
(727) 567-2567 (415) 633-8589 (212) 303-4169
UBS Wells Fargo Securities, LLC Wolfe Research
Batya Levi Eric Luebchow Andrew Rosivach
(212) 713-8824 (312) 630-2386 (646) 582-9350
Rating Agencies
Fitch Moody’s Standard & Poor’s
John Culver Lori Marks Ryan Gilmore
(312) 368-3216 (212) 553-1098 (212) 438-0602
HISTORICAL COMMON STOCK DATA
Three Months Ended
(in millions, except per share amounts) 3/31/22 12/31/21 9/30/21 6/30/21 3/31/21
High price(a) $ 207.24 $ 208.10 $ 200.01 $ 194.75 $ 170.23
Low price(a) $ 155.76 $ 163.63 $ 170.40 $ 166.59 $ 140.52
Period end closing price(b) $ 184.60 $ 206.97 $ 170.58 $ 190.67 $ 167.11
Dividends paid per common share $ 1.47 $ 1.47 $ 1.33 $ 1.33 $ 1.33
Volume weighted average price for the period(a) $ 176.02 $ 180.84 $ 188.41 $ 181.77 $ 154.16
Common shares outstanding, at period end 433 432 432 432 432
Market value of outstanding common shares, at period end(c) $ 79,937 $ 89,456 $ 73,725 $ 82,407 $ 72,221
(a) Based on the sales price, adjusted for common stock dividends, as reported by Bloomberg.
(b) Based on the period end closing price, adjusted for common stock dividends, as reported by Bloomberg.
(c) Period end market value of outstanding common shares is calculated as the product of (1) shares of common stock outstanding at period end and (2) closing share
price at period end, adjusted for common stock dividends, as reported by Bloomberg.
7Crown Castle International Corp.
First Quarter 2022
COMPANY ASSET PORTFOLIO CAPITALIZATION
FINANCIALS & METRICS APPENDIX
OVERVIEW OVERVIEW OVERVIEW
SUMMARY PORTFOLIO HIGHLIGHTS
(as of March 31, 2022)
Towers
Number of towers (in thousands)(a) 40
Average number of tenants per tower 2.4
Remaining contracted tenant receivables ($ in billions)(b) $ 37
Weighted average remaining tenant contract term (years)(b)(c) 7
Percent of towers in the Top 50 / 100 Basic Trading Areas 56% / 71%
Percent of ground leased / owned(d) 59% / 41%
Weighted average maturity of ground leases (years)(d)(e) 36
Fiber
Number of route miles of fiber (in thousands) 80
Remaining contracted tenant receivables ($ in billions)(b) $ 5
Weighted average remaining tenant contract term (years)(b)(c) 4
SUMMARY FINANCIAL HIGHLIGHTS
Three Months Ended March 31,
(in millions, except per share amounts) 2022 2021
Operating Data:
Net revenues
Site rental $ 1,576 $ 1,369
Services and other 166 116
Net revenues $ 1,742 $ 1,485
Costs of operations (exclusive of depreciation, amortization and accretion)
Site rental $ 396 $ 381
Services and other 113 81
Total costs of operations $ 509 $ 462
Net income (loss) $ 421 $ 58
Net income (loss) per share—diluted(f) $ 0.97 $ 0.13
Non-GAAP Data:(g)
Adjusted EBITDA $ 1,095 $ 897
FFO 843 519
AFFO 812 738
AFFO per share(f) $ 1.87 $ 1.71
(a) Excludes third-party land interests.
(b) Excludes renewal terms at tenants' option.
(c) Weighted by site rental revenues.
(d) Weighted by Towers segment site rental gross margin exclusive of straight-lined revenues, amortization of prepaid rent and straight-lined expenses.
(e) Includes all renewal terms at the Company's option.
(f) Based on diluted weighted-average common shares outstanding of 434 million and 433 million for the three months ended March 31, 2022 and 2021, respectively.
(g) See "Non-GAAP Financial Measures, Segment Measures and Other Calculations" for further information and reconciliation of non-GAAP financial measures to
income (loss) from continuing operations, as computed in accordance with GAAP.
8Crown Castle International Corp.
First Quarter 2022
COMPANY ASSET PORTFOLIO CAPITALIZATION
FINANCIALS & METRICS APPENDIX
OVERVIEW OVERVIEW OVERVIEW
SUMMARY FINANCIAL HIGHLIGHTS (CONTINUED)
Three Months Ended March 31,
(in millions) 2022 2021
Summary Cash Flow Data:(a)
Net cash provided by (used for) operating activities $ 558 $ 584
Net cash provided by (used for) investing activities(b) (289) (311)
Net cash provided by (used for) financing activities (253) (217)
(in millions) March 31, 2022 December 31, 2021
Balance Sheet Data (at period end):
Cash and cash equivalents $ 312 $ 292
Property and equipment, net 15,226 15,269
Total assets 39,071 39,040
Total debt and other long-term obligations 21,126 20,629
Total CCIC stockholders' equity 8,036 8,258
Three Months Ended
March 31, 2022
Other Data:
Net debt to last quarter annualized Adjusted EBITDA(c) 4.8 x
Dividend per common share $ 1.47
OUTLOOK FOR FULL YEAR 2022
(in millions, except per share amounts) Full Year 2022(d)
Site rental revenues $6,242 to $6,287
Site rental costs of operations(e) $1,548 to $1,593
Income (loss) from continuing operations $1,674 to $1,754
Income (loss) from continuing operations per share—diluted(f) $3.85 to $4.03
Adjusted EBITDA(g) $4,309 to $4,354
Interest expense and amortization of deferred financing costs(h) $635 to $680
FFO(g) $3,358 to $3,403
AFFO(g) $3,178 to $3,223
AFFO per share(f)(g) $7.31 to $7.41
(a) Includes impacts of restricted cash. See the condensed consolidated statement of cash flows for further information.
(b) Includes net cash used for acquisitions of approximately $3 million and $4 million for the three months ended March 31, 2022 and 2021, respectively.
(c) See the "Net Debt to Last Quarter Annualized Adjusted EBITDA Calculation" in the Appendix.
(d) As issued on April 20, 2022.
(e) Exclusive of depreciation, amortization and accretion.
(f) The assumption for diluted weighted-average common shares outstanding for full year 2022 Outlook is based on the diluted common shares outstanding as of
March 31, 2022.
(g) See "Non-GAAP Financial Measures, Segment Measures and Other Calculations" for further information and reconciliation of non-GAAP financial measures to
income (loss) from continuing operations, as computed in accordance with GAAP.
(h) See reconciliation of "Components of Outlook for Interest Expense and Amortization of Deferred Financing Costs" for a discussion of non-cash interest expense.
9Crown Castle International Corp.
First Quarter 2022
COMPANY ASSET PORTFOLIO CAPITALIZATION
FINANCIALS & METRICS APPENDIX
OVERVIEW OVERVIEW OVERVIEW
NEW PRESENTATION OF ACTUAL RESULTS FOR FULL YEAR 2019, 2020 AND 2021 AND OUTLOOK FOR FULL YEAR 2022
COMPONENTS OF CHANGES IN SITE RENTAL REVENUES(a)
Full Year Full Year Full Year Current Full Year Previous Full Year
(dollars in millions) 2019 2020 2021 2022 Outlook(b) 2022 Outlook(c)
Components of changes in site rental revenues:
Prior year site rental billings(d) $4,315 $4,556 $4,779 $5,048 $5,048
Core leasing activity(d) 335 314 343 $320 to $350 $320 to $350
Escalators 86 90 93 $95 to $105 $95 to $105
Non-renewals(d) (181) (183) (170) $(195) to $(175) $(195) to $(175)
Organic Contribution to Site Rental Billings(d) 240 221 266 $230 to $270 $230 to $270
Impact from straight-lined revenues associated
with fixed escalators 81 22 111 $399 to $419 $359 to $379
Impact from prepaid rent amortization 457 519 560 $560 to $570 $560 to $570
Acquisitions(e) — 2 3 — —
Other — — — — —
Total GAAP site rental revenues $5,093 $5,320 $5,719 $6,242 to $6,287 $6,202 to $6,247
Year-over-year changes in revenues:
Reported GAAP site rental revenues 6.2% 4.5% 7.5% 9.5%(h) 8.8%(h)
Contribution from core leasing and escalators(d)(f) 9.8% 8.9% 9.1% 8.6%(h) 8.6%(h)
Organic Contribution to Site Rental Billings(d)(g) 5.6% 4.9% 5.6% 5.0%(h) 5.0%(h)
(a) Beginning in the first quarter of 2022, we have revised our presentation of "Components of Changes in Site Rental Revenues" (most notably, by removing the
concept of the impact of prepaid amortization from Organic Contribution to Site Rental Billings) in order to increase the usefulness of the table for investors or
other interested parties. See "Non-GAAP Financial Measures, Segment Measures and Other Calculations" for further information.
(b) As issued on April 20, 2022.
(c) As issued on January 26, 2022.
(d) See "Non-GAAP Financial Measures, Segment Measures and Other Calculations" for our definitions of site rental billings, core leasing activity, non-renewals and
Organic Contribution to Site Rental Billings.
(e) Represents the contribution from recent acquisitions. The financial impact of recent acquisitions is excluded from Organic Contribution to Site Rental Billings
until the one-year anniversary of such acquisitions.
(f) Calculated as the percentage change from prior year site rental billings compared to the sum of core leasing and escalators for the current period.
(g) Calculated as the percentage change from prior year site rental billings compared to Organic Contribution to Site Rental Billings for the current period.
(h) Calculated based on midpoint of respective full year 2022 Outlook.
10Crown Castle International Corp.
First Quarter 2022
COMPANY ASSET PORTFOLIO CAPITALIZATION
FINANCIALS & METRICS APPENDIX
OVERVIEW OVERVIEW OVERVIEW
HISTORICAL PRESENTATION OF ACTUAL RESULTS FOR FULL YEAR 2019, 2020 AND 2021 AND OUTLOOK FOR FULL YEAR
2022 COMPONENTS OF CHANGES IN SITE RENTAL REVENUES(a)
Full Year Full Year Full Year Current Full Year Previous Full Year
(dollars in millions) 2019 2020 2021 2022 Outlook(b) 2022 Outlook(c)
Components of changes in site rental revenues:
Prior year site rental revenues exclusive of straight-
lined revenues associated with fixed
escalators(d)(e) $4,724 $5,013 $5,298 $5,608 $5,608
New leasing activity(d)(e) 383 376 384 $325 to $355 $325 to $355
Escalators 86 90 93 $95 to $105 $95 to $105
Non-renewals (181) (183) (170) $(195) to $(175) $(195) to $(175)
Organic Contribution to Site Revenues(f) 288 283 307 $235 to $275 $235 to $275
Impact from straight-lined revenues associated
with fixed escalators 81 22 111 $399 to $419 $359 to $379
Acquisitions(g) — 2 3 — —
Other — — — — —
Total GAAP site rental revenues $5,093 $5,320 $5,719 $6,242 to $6,287 $6,202 to $6,247
Year-over-year changes in revenues:
Reported GAAP site rental revenues 6.2% 4.5% 7.5% 9.5%(i) 8.8%(i)
Organic Contribution to Site Rental Revenues(f)(h) 6.1% 5.6% 5.8% 4.5%(i) 4.5%(i)
(a) The above reconciliation is included for comparative purposes. Beginning in the first quarter of 2022, we have revised our presentation of "Components of
Changes in Site Rental Revenues" (most notably, by removing the concept of the impact of prepaid amortization from Organic Contribution to Site Rental
Billings) in order to increase the usefulness of the table for investors or other interested parties. See "Non-GAAP Financial Measures, Segment Measures and
Other Calculations" for further information.
(b) As issued on April 20, 2022.
(c) As issued on January 26, 2022.
(d) Includes revenues from amortization of prepaid rent in accordance with GAAP.
(e) Includes revenues from the construction of new small cell nodes, exclusive of straight-lined revenues associated with fixed escalators.
(f) See "Non-GAAP Financial Measures, Segment Measures and Other Calculations" in our Q4 2021 Supplemental Information Package for a discussion of our
definition of Organic Contribution to Site Rental Revenues.
(g) Represents the contribution from recent acquisitions. The financial impact of recent acquisitions is excluded from Organic Contribution to Site Rental Revenues
until the one-year anniversary of such acquisitions.
(h) Calculated as the percentage change from prior year site rental revenues, exclusive of straight-lined revenues associated with fixed escalators, compared to
Organic Contribution to Site Rental Revenues for the current period.
(i) Calculated based on midpoint of respective full year 2022 Outlook.
11Crown Castle International Corp.
First Quarter 2022
COMPANY ASSET PORTFOLIO CAPITALIZATION
FINANCIALS & METRICS APPENDIX
OVERVIEW OVERVIEW OVERVIEW
CONDENSED CONSOLIDATED BALANCE SHEET (Unaudited)
(in millions, except par values) March 31, 2022 December 31, 2021
ASSETS
Current assets:
Cash and cash equivalents $ 312 $ 292
Restricted cash 165 169
Receivables, net 503 543
Prepaid expenses 119 105
Other current assets 162 145
Total current assets 1,261 1,254
Deferred site rental receivables 1,682 1,588
Property and equipment, net 15,226 15,269
Operating lease right-of-use assets 6,759 6,682
Goodwill 10,078 10,078
Other intangible assets, net 3,935 4,046
Other assets, net 130 123
Total assets $ 39,071 $ 39,040
LIABILITIES AND EQUITY
Current liabilities:
Accounts payable $ 224 $ 246
Accrued interest 117 182
Deferred revenues 721 776
Other accrued liabilities 288 401
Current maturities of debt and other obligations 71 72
Current portion of operating lease liabilities 355 349
Total current liabilities 1,776 2,026
Debt and other long-term obligations 21,055 20,557
Operating lease liabilities 6,098 6,031
Other long-term liabilities 2,106 2,168
Total liabilities 31,035 30,782
Commitments and contingencies
CCIC stockholders' equity:
Common stock, $0.01 par value; 600 shares authorized; shares issued and outstanding: March
31, 2022—433 and December 31, 2021—432 4 4
Additional paid-in capital 18,006 18,011
Accumulated other comprehensive income (loss) (3) (4)
Dividends/distributions in excess of earnings (9,971) (9,753)
Total equity 8,036 8,258
Total liabilities and equity $ 39,071 $ 39,040
12Crown Castle International Corp.
First Quarter 2022
COMPANY ASSET PORTFOLIO CAPITALIZATION
FINANCIALS & METRICS APPENDIX
OVERVIEW OVERVIEW OVERVIEW
CONDENSED CONSOLIDATED STATEMENT OF OPERATIONS (Unaudited)
Three Months Ended March 31,
(in millions, except per share amounts) 2022 2021
Net revenues:
Site rental $ 1,576 $ 1,369
Services and other 166 116
Net revenues 1,742 1,485
Operating expenses:
Costs of operations:(a)
Site rental 396 381
Services and other 113 81
Selling, general and administrative 181 164
Asset write-down charges 14 3
Acquisition and integration costs — —
Depreciation, amortization and accretion 420 408
Total operating expenses 1,124 1,037
Operating income (loss) 618 448
Interest expense and amortization of deferred financing costs (164) (170)
Gains (losses) on retirement of long-term obligations (26) (143)
Interest income — 1
Other income (expense) (1) (8)
Income (loss) before income taxes 427 128
Benefit (provision) for income taxes (6) (7)
Income (loss) from continuing operations 421 121
Discontinued operations:
Net gain (loss) from disposal of discontinued operations, net of tax — (63)
Income (loss) from discontinued operations, net of tax — (63)
Net income (loss) $ 421 $ 58
Net income (loss), per common share:
Income (loss) from continuing operations, basic $ 0.97 $ 0.28
Income (loss) from discontinued operations, basic — (0.15)
Net income (loss), basic $ 0.97 $ 0.13
Income (loss) from continuing operations, diluted $ 0.97 $ 0.28
Income (loss) from discontinued operations, diluted — (0.15)
Net income (loss), diluted $ 0.97 $ 0.13
Weighted-average common shares outstanding:
Basic 433 432
Diluted 434 433
(a) Exclusive of depreciation, amortization and accretion shown separately.
13Crown Castle International Corp.
First Quarter 2022
COMPANY FINANCIALS & METRICS ASSET PORTFOLIO OVERVIEW CAPITALIZATION OVERVIEW APPENDIX
OVERVIEW
SEGMENT OPERATING RESULTS
Three Months Ended March 31, 2022 Three Months Ended March 31, 2021
Consolidated Consolidated
(in millions) Towers Fiber Other Total Towers Fiber Other Total
Segment site rental revenues $ 1,075 $ 501 $ 1,576 $ 895 $ 474 $ 1,369
Segment services and other revenues 163 3 166 111 5 116
Segment revenues 1,238 504 1,742 1,006 479 1,485
Segment site rental costs of operations 225 162 387 212 161 373
Segment services and other costs of operations 109 2 111 76 3 79
Segment costs of operations(a)(b) 334 164 498 288 164 452
Segment site rental gross margin(c) 850 339 1,189 683 313 996
Segment services and other gross margin(c) 54 1 55 35 2 37
Segment selling, general and administrative expenses(b) 28 47 75 25 45 70
Segment operating profit(c) 876 293 1,169 693 270 963
Other selling, general and administrative expenses(b) $ 74 74 $ 66 66
Stock-based compensation expense 39 39 33 33
Depreciation, amortization and accretion 420 420 408 408
Interest expense and amortization of deferred financing costs 164 164 170 170
Other (income) expenses to reconcile to income (loss) before
income taxes(d) 45 45 158 158
Income (loss) before income taxes $ 427 $ 128
FIBER SEGMENT SITE RENTAL REVENUES SUMMARY
Three Months Ended March 31,
2022 2021
(in millions) Fiber Solutions Small Cells Total Fiber Solutions Small Cells Total
Site rental revenues $ 346 $ 155 $ 501 $ 331 $ 143 $ 474
(a) Exclusive of depreciation, amortization and accretion shown separately.
(b) Segment costs of operations exclude (1) stock-based compensation expense of $7 million and $5 million for the three months ended March 31, 2022 and 2021, respectively, and (2) prepaid lease purchase price
adjustments of $4 million and $5 million for the three months ended March 31, 2022 and 2021, respectively. Selling, general and administrative expenses exclude stock-based compensation expense of $32 million and
$28 million for the three months ended March 31, 2022 and 2021, respectively.
(c) See "Non-GAAP Financial Measures, Segment Measures and Other Calculations" for a discussion of our definitions of segment site rental gross margin, segment services and other gross margin and segment operating
profit.
(d) See condensed consolidated statement of operations for further information.
14Crown Castle International Corp.
First Quarter 2022
COMPANY ASSET PORTFOLIO CAPITALIZATION
FINANCIALS & METRICS APPENDIX
OVERVIEW OVERVIEW OVERVIEW
FFO AND AFFO RECONCILIATIONS
Three Months Ended March 31,
(in millions, except per share amounts) 2022 2021
(a)
Income (loss) from continuing operations $ 421 $ 121
Real estate related depreciation, amortization and accretion 408 395
Asset write-down charges 14 3
FFO(b)(c) $ 843 $ 519
Weighted-average common shares outstanding—diluted 434 433
FFO per share(b)(c) $ 1.94 $ 1.20
FFO (from above) $ 843 $ 519
Adjustments to increase (decrease) FFO:
Straight-lined revenues (116) 10
Straight-lined expenses 19 19
Stock-based compensation expense 39 33
Non-cash portion of tax provision 5 7
Non-real estate related depreciation, amortization and accretion 12 13
Amortization of non-cash interest expense 4 3
Other (income) expense 1 8
(Gains) losses on retirement of long-term obligations 26 143
Acquisition and integration costs — —
Sustaining capital expenditures (21) (17)
AFFO(b)(c) $ 812 $ 738
Weighted-average common shares outstanding—diluted 434 433
AFFO per share(b)(c) $ 1.87 $ 1.71
(a) Does not reflect the impact related to the ATO Settlement (as defined in the Form 8-K filed with the SEC on April 26, 2021 ("April 2021 8-K"), which is
attributable to discontinued operations in the first quarter of 2021 as discussed in the April 2021 8-K.
(b) See "Non-GAAP Financial Measures, Segment Measures and Other Calculations" for a discussion of our definitions of FFO and AFFO, including per share
amounts.
(c) The above reconciliation excludes line items included in our definition which are not applicable for the periods shown.
15Crown Castle International Corp.
First Quarter 2022
COMPANY ASSET PORTFOLIO CAPITALIZATION
FINANCIALS & METRICS APPENDIX
OVERVIEW OVERVIEW OVERVIEW
CONDENSED CONSOLIDATED STATEMENT OF CASH FLOWS (Unaudited)
Three Months Ended March 31,
(in millions) 2022 2021
Cash flows from operating activities:
Income (loss) from continuing operations $ 421 $ 121
Adjustments to reconcile income (loss) from continuing operations to net cash provided by (used for)
operating activities:
Depreciation, amortization and accretion 420 408
(Gains) losses on retirement of long-term obligations 26 143
Amortization of deferred financing costs and other non-cash interest, net 4 3
Stock-based compensation expense 38 33
Asset write-down charges 14 3
Deferred income tax (benefit) provision 1 1
Other non-cash adjustments, net 1 10
Changes in assets and liabilities, excluding the effects of acquisitions:
Increase (decrease) in liabilities (274) (146)
Decrease (increase) in assets (93) 8
Net cash provided by (used for) operating activities 558 584
Cash flows from investing activities:
Capital expenditures (281) (302)
Payments for acquisitions, net of cash acquired (3) (4)
Other investing activities, net (5) (5)
Net cash provided by (used for) investing activities (289) (311)
Cash flows from financing activities:
Proceeds from issuance of long-term debt 748 3,237
Principal payments on debt and other long-term obligations (18) (1,026)
Purchases and redemptions of long-term debt (1,274) (1,789)
Borrowings under revolving credit facility 900 580
Payments under revolving credit facility (665) (290)
Net borrowings (repayments) under commercial paper program 777 (245)
Payments for financing costs (8) (29)
Purchases of common stock (63) (67)
Dividends/distributions paid on common stock (650) (588)
Net cash provided by (used for) financing activities (253) (217)
Net increase (decrease) in cash, cash equivalents, and restricted cash 16 56
Effect of exchange rate changes on cash — 1
Cash, cash equivalents, and restricted cash at beginning of period 466 381
Cash, cash equivalents, and restricted cash at end of period $ 482 $ 438
Supplemental disclosure of cash flow information:
Interest paid 225 259
Income taxes paid — —
16Crown Castle International Corp.
First Quarter 2022
COMPANY ASSET PORTFOLIO CAPITALIZATION
FINANCIALS & METRICS APPENDIX
OVERVIEW OVERVIEW OVERVIEW
COMPONENTS OF CHANGES IN SITE RENTAL REVENUES(a)
Three Months Ended March 31,
(dollars in millions) 2022 2021
Components of changes in site rental revenues:
Prior year site rental billings(b) $ 1,243 $ 1,170
Core leasing activity(b) 92 89
Escalators 25 23
Non-renewals(b) (42) (40)
Organic Contribution to Site Rental Billings(b) 75 72
Impact from straight-lined revenues associated with fixed escalators 116 (10)
Impact from prepaid rent amortization 141 136
Acquisitions(c) 1 1
Other — —
Total GAAP site rental revenues $ 1,576 $ 1,369
Year-over-year changes in revenues:
Reported GAAP site rental revenues 15.1 %
Contribution from core leasing and escalators(b)(d) 9.4 %
Organic Contribution to Site Rental Billings(b)(e) 6.0 %
SUMMARY OF SITE RENTAL STRAIGHT-LINED REVENUES AND EXPENSES ASSOCIATED WITH FIXED
ESCALATORS(f)
Three Months Ended March 31,
2022 2021
(in millions) Towers Fiber Total Towers Fiber Total
Site rental straight-lined revenues $ 116 $ — $ 116 $ (11) $ 1 $ (10)
Site rental straight-lined expenses 19 — 19 19 — 19
SUMMARY OF PREPAID RENT ACTIVITY(g)
Three Months Ended March 31,
2022 2021
(in millions) Towers Fiber Total Towers Fiber Total
Prepaid rent additions $ 22 $ 50 $ 72 $ 26 $ 59 $ 85
Amortization of prepaid rent 79 62 141 79 57 136
(a) Beginning in the first quarter of 2022, we have revised our presentation of "Components of Changes in Site Rental Revenues" (most notably, by removing the
concept of the impact of prepaid amortization from Organic Contribution to Site Rental Billings) in order to increase the usefulness of the table for investors or
other interested parties. See "Non-GAAP Financial Measures, Segment Measures and Other Calculations" for further information.
(b) See "Non-GAAP Financial Measures, Segment Measures and Other Calculations" for our definitions of site rental billings, core leasing activity, non-renewals and
Organic Contribution to Site Rental Billings.
(c) Represents the contribution from recent acquisitions. The financial impact of recent acquisitions is excluded from Organic Contribution to Site Rental Billings
until the one-year anniversary of such acquisitions.
(d) Calculated as the percentage change from prior year site rental billings compared to the sum of core leasing and escalators for the current period.
(e) Calculated as the percentage change from prior year site rental billings compared to Organic Contribution to Site Rental Billings for the current period.
(f) In accordance with GAAP accounting, if payment terms call for fixed escalations or rent free periods, the revenues are recognized on a straight-line basis over the
fixed, non-cancelable term of the contract. Since the Company recognizes revenues on a straight-line basis, a portion of the site rental revenues in a given period
represents cash collected or contractually collectible in other periods.
(g) Reflects up-front consideration from long-term tenants and other deferred credits (commonly referred to as prepaid rent), and the amortization thereof for GAAP
revenue recognition purposes.
17Crown Castle International Corp.
First Quarter 2022
COMPANY ASSET PORTFOLIO CAPITALIZATION
FINANCIALS & METRICS APPENDIX
OVERVIEW OVERVIEW OVERVIEW
SUMMARY OF CAPITAL EXPENDITURES
Three Months Ended March 31,
2022 2021
(in millions) Towers Fiber Other Total Towers Fiber Other Total
Discretionary:
Purchases of land interests $ 10 $ — $ — $ 10 $ 14 $ — $ — $ 14
Communications infrastructure
improvements and other capital
projects 35 209 6 250 35 225 11 271
Sustaining 2 13 6 21 2 12 3 17
Total $ 47 $ 222 $ 12 $ 281 $ 51 $ 237 $ 14 $ 302
PROJECTED REVENUES FROM TENANT CONTRACTS(a)
Remaining
Nine Months Years Ending December 31,
(as of March 31, 2022; in millions) 2022 2023 2024 2025 2026
Components of site rental revenues:
Site rental billings(b) $ 3,952 $ 5,428 $ 5,585 $ 5,518 $ 5,631
Amortization of prepaid rent 408 452 323 247 205
Straight-lined site rental revenues associated with fixed
escalators 280 233 142 36 (61)
GAAP site rental revenues $ 4,640 $ 6,113 $ 6,050 $ 5,801 $ 5,775
PROJECTED EXPENSES FROM EXISTING GROUND LEASES AND FIBER ACCESS AGREEMENTS(c)
Remaining
Nine Months Years Ending December 31,
(as of March 31, 2022; in millions) 2022 2023 2024 2025 2026
Components of ground lease and fiber access agreement
expenses:
Ground lease and fiber access agreement expenses
exclusive of straight-line associated with fixed escalators $ 709 $ 963 $ 982 $ 1,002 $ 1,023
Straight-lined site rental lease expenses associated with
fixed escalators 50 57 46 34 23
GAAP ground lease and fiber access agreement expenses $ 759 $ 1,020 $ 1,028 $ 1,036 $ 1,046
ANNUALIZED RENTAL CASH PAYMENTS AT TIME OF RENEWAL(d)
Remaining
Nine Months Years Ending December 31,
(as of March 31, 2022; in millions) 2022 2023 2024 2025 2026
T-Mobile $ 18 $ 50 $ 39 $ 240 $ 53
AT&T 24 329 18 20 31
Verizon 13 17 20 30 36
All Others Combined 138 215 172 103 98
Total $ 193 $ 611 $ 249 $ 393 $ 218
(a) Based on tenant licenses in-place as of March 31, 2022. All tenant licenses are assumed to renew for a new term no later than the respective current term end date,
and as such, projected revenues do not reflect the impact of estimated annual churn. CPI-linked tenant contracts are assumed to escalate at 3% per annum.
(b) See "Non-GAAP Financial Measures, Segment Measures and Other Calculations" for our definition of site rental billings.
(c) Based on existing ground leases and fiber access agreements as of March 31, 2022. CPI-linked leases are assumed to escalate at 3% per annum.
(d) Reflects lease renewals by year by tenant; dollar amounts represent annualized cash site rental revenues from assumed renewals or extensions as reflected in
"Projected Revenues from Tenant Contracts" above.
18Crown Castle International Corp.
First Quarter 2022
COMPANY ASSET PORTFOLIO CAPITALIZATION
FINANCIALS & METRICS APPENDIX
OVERVIEW OVERVIEW OVERVIEW
CONSOLIDATED TENANT OVERVIEW
Percentage of Q1 2022 Weighted Average Long-Term Credit
LQA Site Current Rating
(as of March 31, 2022) Rental Revenues Term Remaining(a) (S&P / Moody’s)
T-Mobile 37% 9 BB+ / Ba1
AT&T 19% 5 BBB / Baa2
Verizon 19% 9 BBB+ / Baa1
All Others Combined 25% 3 N/A
Total / Weighted Average 100% 7
FIBER SOLUTIONS REVENUE MIX
Percentage of Q1 2022
LQA Site
(as of March 31, 2022) Rental Revenues
Carrier(b) 38%
Education 13%
Healthcare 11%
Financial Services 9%
Other 29%
Total 100%
(a) Weighted by site rental revenues and excludes renewals at the tenants' option.
(b) Includes revenues derived from both wireless carriers and wholesale carriers.
19Crown Castle International Corp.
First Quarter 2022
COMPANY ASSET PORTFOLIO CAPITALIZATION
FINANCIALS & METRICS APPENDIX
OVERVIEW OVERVIEW OVERVIEW
SEGMENT CASH YIELDS ON INVESTED CAPITAL(a)
Q1 2022 LQA
(as of March 31, 2022; dollars in millions) Towers Fiber
Segment site rental gross margin(b) $ 3,400 $ 1,356
Less: Amortization of prepaid rent (316) (248)
Less: Site rental straight-lined revenues (464) —
Add: Site rental straight-lined expenses 76 —
Add: Indirect labor costs(c) — 100
Numerator $ 2,696 $ 1,208
Segment net investment in property and equipment(d) $ 13,142 $ 8,163
Segment investment in site rental contracts and tenant relationships 4,568 3,287
Segment investment in goodwill(e) 5,351 4,073
Segment Net Invested Capital(a) $ 23,061 $ 15,523
Segment Cash Yield on Invested Capital(a) 11.7 % 7.8 %
CONSOLIDATED RETURN ON INVESTED CAPITAL(a)
(as of March 31, 2022; dollars in millions) Q1 2022 LQA
(f)
Adjusted EBITDA $ 4,380
Cash taxes refunded (paid) (1)
Numerator $ 4,379
Historical gross investment in property and equipment(g) $ 26,504
Historical gross investment in site rental contracts and tenant relationships 7,855
Historical gross investment in goodwill 10,078
Consolidated Invested Capital(a) $ 44,437
Consolidated Return on Invested Capital(a) 9.9 %
(a) See "Non-GAAP Financial Measures, Segment Measures and Other Calculations" for further information on, and our definitions and calculations of, Segment
Cash Yield on Invested Capital, Segment Net Invested Capital, Consolidated Return on Invested Capital and Consolidated Invested Capital.
(b) See "Segment Operating Results" and "Non-GAAP Financial Measures, Segment Measures and Other Calculations" for further information on, and our definition
and calculation of, segment site rental gross margin.
(c) This adjustment represents indirect labor costs in the Fiber segment that are not capitalized, but that primarily support the Company's ongoing expansion of its
small cells and fiber networks that management expects to generate future revenues for the Company. Removal of these indirect labor costs presents Segment
Cash Yield on Invested Capital on a direct cost basis, consistent with the methodology used by management when evaluating project-level investment
opportunities.
(d) Segment net investment in property and equipment excludes the impact of construction in process and non-productive assets (such as information technology
assets and buildings) and is reduced by the amount of prepaid rent received from tenants (excluding any deferred credits recorded in connection with acquisitions).
(e) Segment investment in goodwill excludes the impact of certain assets and liabilities recorded in connection with acquisitions (primarily deferred credits).
(f) See "Non-GAAP Financial Measures, Segment Measures and Other Calculations" for further information and reconciliation of Adjusted EBITDA to income
(loss) from continuing operations, as computed in accordance with GAAP.
(g) Historical gross investment in property and equipment excludes the impact of construction in process.
20Crown Castle International Corp.
First Quarter 2022
ASSET PORTFOLIO CAPITALIZATION
COMPANY OVERVIEW FINANCIALS & METRICS APPENDIX
OVERVIEW OVERVIEW
SUMMARY OF TOWER PORTFOLIO BY VINTAGE(a)
(as of March 31, 2022; dollars in thousands)
CASH YIELD(b) NUMBER OF TENANTS PER TOWER
20%
2.9
2.2
9%
Acquired and built Acquired and built Acquired and built Acquired and built
2006 and prior 2007 to present 2006 and prior 2007 to present
LQA TOWERS SEGMENT SITE RENTAL GROSS CASH
LQA CASH SITE RENTAL REVENUES PER TOWER(c) MARGIN PER TOWER(d)
$125
$107
$73
$51
Acquired and built Acquired and built Acquired and built Acquired and built
2006 and prior 2007 to present 2006 and prior 2007 to present
NET INVESTED CAPITAL PER TOWER(e) NUMBER OF TOWERS
$546 $571
28,921
11,238
Acquired and built Acquired and built Acquired and built Acquired and built
2006 and prior 2007 to present 2006 and prior 2007 to present
(a) All tower portfolio figures are calculated exclusively for the Company’s towers and rooftops and do not give effect to other activities within the Company’s
Towers segment.
(b) Cash yield is calculated as LQA Towers segment site rental gross margin, exclusive of straight-lined revenues and amortization of prepaid rent, divided by
invested capital net of the amount of prepaid rent received from tenants.
(c) Exclusive of straight-lined revenues and amortization of prepaid rent.
(d) Exclusive of straight-lined revenues, amortization of prepaid rent and straight-lined expenses.
(e) Reflects gross total assets (including incremental capital invested by the Company since time of acquisition or construction completion), less any prepaid rent.
Inclusive of invested capital related to land at the tower site.
21Crown Castle International Corp.
First Quarter 2022
COMPANY FINANCIALS & METRICS ASSET PORTFOLIO OVERVIEW CAPITALIZATION OVERVIEW APPENDIX
OVERVIEW
TOWER PORTFOLIO OVERVIEW(a)
(as of March 31, 2022; dollars in thousands)
LQA CASH SITE RENTAL REVENUES PER
NUMBER OF TOWERS TENANTS PER TOWER TOWER(b)
3.0 $128
7,994
2.2
$74
2.8 $120
20,927 2.1
3,621
$72
7,617
Acquired and built Acquired and built Acquired and built Acquired and built Acquired and built Acquired and built
2006 and prior 2007 to present 2006 and prior 2007 to present 2006 and prior 2007 to present
Top 100 BTA Top 100 BTA Top 100 BTA
Outside Top 100 BTA Outside Top 100 BTA Outside Top 100 BTA
(a) All tower portfolio figures are calculated exclusively for the Company’s towers and rooftops and do not give effect to other activities within the Company’s Towers segment.
(b) Exclusive of straight-lined revenues and amortization of prepaid rent.
22Crown Castle International Corp.
First Quarter 2022
COMPANY FINANCIALS & METRICS ASSET PORTFOLIO OVERVIEW CAPITALIZATION OVERVIEW APPENDIX
OVERVIEW
DISTRIBUTION OF TOWER TENANCY (as of March 31, 2022)(a)
PERCENTAGE OF TOWERS BY TENANTS PER TOWER
SITES ACQUIRED AND BUILT 2006 AND PRIOR SITES ACQUIRED AND BUILT 2007 TO PRESENT
3 tenants: 17%
3 tenants: 22% 4 tenants: 16%
2 tenants: 28% 4 tenants: 9%
5 tenants: 10% 5 tenants: 4%
Greater than 5 tenants: 2%
2 tenants: 23% Greater than 5 tenants: 7%
Less than 2 tenants: 22% Less than 2 tenants: 40%
Average: 2.9 Average: 2.2
GEOGRAPHIC TOWER DISTRIBUTION (as of March 31, 2022)(a)
PERCENTAGE OF LQA CASH SITE RENTAL REVENUES BY GEOGRAPHIC
PERCENTAGE OF TOWERS BY GEOGRAPHIC LOCATION LOCATION(b)
NY: 3% Other US: 46% IN: 3% Other US: 47%
NC: 4% OH: 3%
NY: 4%
TN: 4%
PA: 5%
GA: 4%
TN: 5%
PA: 4%
GA: 5%
IL: 4%
CA: 11% TX: 9%
NC: 5%
OH: 4%
TX: 11% CA: 7%
FL: 7%
FL: 5%
(a) All tower portfolio figures are calculated exclusively for the Company’s towers and rooftops and do not give effect to other activities within the Company’s Towers segment.
(b) Exclusive of straight-lined revenues and amortization of prepaid rent.
23Crown Castle International Corp.
First Quarter 2022
COMPANY ASSET PORTFOLIO CAPITALIZATION
FINANCIALS & METRICS APPENDIX
OVERVIEW OVERVIEW OVERVIEW
GROUND INTEREST OVERVIEW
Percentage of
LQA Towers LQA Towers
Percentage of Segment Site Segment Site Weighted
LQA Cash LQA Cash Rental Gross Rental Gross Average Term
(as of March 31, 2022; Site Rental Site Rental Cash Cash Number of Percentage of Remaining (by
dollars in millions) Revenues(a) Revenues(a) Margin(b) Margin(b) Towers(c) Towers years)(d)
Less than 10 years $ 380 11 %$ 202 8 % 5,377 13 %
10 to 20 years 466 13 % 279 10 % 5,909 15 %
Greater than 20 years 1,504 43 % 1,089 41 % 17,611 44 %
Total leased $ 2,350 67 %$ 1,570 59 % 28,897 72 % 36
Owned $ 1,169 33 % $ 1,098 41 % 11,262 28 %
Total / Average $ 3,519 100 % $ 2,668 100 % 40,159 100 %
GROUND INTEREST ACTIVITY
Three Months Ended
(dollars in millions) March 31, 2022
Ground Extensions Under Crown Castle Towers:
Number of ground leases extended 129
Average number of years extended 26
Percentage increase in consolidated cash ground lease expense due to extension activities(e) —%
Ground Purchases Under Crown Castle Towers:
Number of ground leases purchased 39
Ground lease purchases (including capital expenditures, acquisitions and installment purchases) $ 14
Percentage of Towers segment site rental gross margin from towers on purchased landCrown Castle International Corp.
First Quarter 2022
COMPANY ASSET PORTFOLIO CAPITALIZATION
FINANCIALS & METRICS APPENDIX
OVERVIEW OVERVIEW OVERVIEW
CAPITALIZATION OVERVIEW
Net Debt to LQA
Fixed vs. Interest Adjusted
(as of March 31, 2022; dollars in millions) Face Value Variable Rate(a) EBITDA(b) Maturity
Cash, cash equivalents and restricted cash $ 482
Senior Secured Notes, Series 2009-1, Class A-2(c) 52 Fixed 9.0% 2029
Senior Secured Tower Revenue Notes, Series 2015-2(d) 700 Fixed 3.7% 2045
Senior Secured Tower Revenue Notes, Series 2018-2(d) 750 Fixed 4.2% 2048
Finance leases and other obligations 236 Various Various Various
Total secured debt $ 1,738 4.1% 0.4x
2016 Revolver(e) 900 Variable 1.5% 2026
2016 Term Loan A 1,215 Variable 1.5% 2026
Commercial Paper Notes(f) 1,042 Variable 1.2% 2022
3.150% Senior Notes 750 Fixed 3.2% 2023
3.200% Senior Notes 750 Fixed 3.2% 2024
1.350% Senior Notes 500 Fixed 1.4% 2025
4.450% Senior Notes 900 Fixed 4.5% 2026
3.700% Senior Notes 750 Fixed 3.7% 2026
1.050% Senior Notes 1,000 Fixed 1.1% 2026
2.900% Senior Notes 750 Fixed 2.9% 2027
4.000% Senior Notes 500 Fixed 4.0% 2027
3.650% Senior Notes 1,000 Fixed 3.7% 2027
3.800% Senior Notes 1,000 Fixed 3.8% 2028
4.300% Senior Notes 600 Fixed 4.3% 2029
3.100% Senior Notes 550 Fixed 3.1% 2029
3.300% Senior Notes 750 Fixed 3.3% 2030
2.250% Senior Notes 1,100 Fixed 2.3% 2031
2.100% Senior Notes 1,000 Fixed 2.1% 2031
2.500% Senior Notes 750 Fixed 2.5% 2031
2.900% Senior Notes 1,250 Fixed 2.9% 2041
4.750% Senior Notes 350 Fixed 4.8% 2047
5.200% Senior Notes 400 Fixed 5.2% 2049
4.000% Senior Notes 350 Fixed 4.0% 2049
4.150% Senior Notes 500 Fixed 4.2% 2050
3.250% Senior Notes 900 Fixed 3.3% 2051
Total unsecured debt $ 19,557 2.9% 4.5x
Total net debt $ 20,813 3.0% 4.8x
Market Capitalization(g) 79,937
Firm Value(h) $ 100,750
(a) Represents the weighted-average stated interest rate, as applicable.
(b) Represents the applicable amount of debt divided by LQA consolidated Adjusted EBITDA. See the "Net Debt to Last Quarter Annualized Adjusted EBITDA
Calculation" in the Appendix.
(c) The Senior Secured Notes, 2009-1, Class A-2 principal amortizes over a period ending in August 2029.
(d) If the respective series of such debt is not paid in full on or prior to an applicable anticipated repayment date, then the Excess Cash Flow (as defined in the
indenture) of the issuers of such notes will be used to repay principal of the applicable series, and additional interest (of an additional approximately 5% per
annum) will accrue on the respective series. The Senior Secured Tower Revenue Notes, 2015-2 and 2018-2 have anticipated repayment dates in 2025 and 2028,
respectively. Notes are prepayable at par if voluntarily repaid within eighteen months of maturity; earlier prepayment may require additional consideration.
(e) As of March 31, 2022, the undrawn availability under the $5.0 billion 2016 Revolver was $4.1 billion.
(f) As of March 31, 2022, the Company had $958 million available for issuance under the $2.0 billion unsecured commercial paper program ("CP Program"). The
maturities of the Commercial Paper Notes, when outstanding, may vary but may not exceed 397 days from the date of issue.
(g) Market capitalization calculated based on $184.60 closing price and 433 million shares outstanding as of March 31, 2022.
(h) Represents the sum of net debt and market capitalization.
25Crown Castle International Corp.
First Quarter 2022
COMPANY OVERVIEW FINANCIALS & METRICS ASSET PORTFOLIO OVERVIEW CAPITALIZATION OVERVIEW APPENDIX
DEBT MATURITY OVERVIEW(a)(b)
% of Debt Outstanding
Fixed
Variable 11%
89%
(as of March 31, 2022; dollars in millions)
$3,750
$3,522
$2,100
$1,253
$1,004 $1,004 $1,004
$784 $784 $750 $754 $750 $750
$566 $603 $551
$10 $18 $26 $34 $0 $0
1H 2H 1H 2H 1H 2H 1H 2H 1H 2H 1H 2H 1H 2H 1H 2H 1H 2H 1H 2H 1H Thereafter
2022 2022 2023 2023 2024 2024 2025 2025 2026 2026 2027 2027 2028 2028 2029 2029 2030 2030 2031 2031 2032
(a) Where applicable, maturities reflect the Anticipated Repayment Date, as defined in the respective debt agreement; excludes finance leases and other obligations; amounts presented at face value, net of repurchases held at CCIC.
(b) The $1.0 billion outstanding in commercial paper notes ("CP Notes") have been excluded from this table. Amounts available under the CP Program may be borrowed, repaid and re-borrowed from time to time. We intend to maintain available
commitments under our 2016 Revolver in an amount at least equal to the amount of CP Notes outstanding at any point in time.
26You can also read