Everi Holdings Inc. Investor Presentation - NYSE: EVRI
←
→
Page content transcription
If your browser does not render page correctly, please read the page content below

Everi Holdings Inc.
  Investor Presentation

 Results of Operations for the period
         ended June 30, 2020

                                        NYSE: EVRI
       © 2020 Everi Holdings Inc.
SAFE HARBOR DISCLAIMER

Forward-Looking Statements

This presentation contains “forward-looking” statements within the meaning of Section 27A of the Securities Act of 1933, as
amended (the “Securities Act”), Section 21E of the Securities Exchange Act of 1934, as amended (the “Exchange Act”), and the
Private Securities Litigation Reform Act of 1995. From time to time, we also provide forward-looking statements in other materials
we release to the public, as well as oral forward-looking statements. We have tried, wherever possible, to identify such statements
by using words such as “anticipate,” “believe,” “expect,” “intend,” “estimate,” “project,” “may,” “should,” “will,” “likely,” “will likely
result,” “will continue,” “future,” “plan,” “target,” “forecast,” “goal,” “observe,” “seek,” “strategy” and other words and terms of similar
meaning. Examples of forward-looking statements include, among others, statements we make regarding (a) opportunities for
expansion into new markets and categories; (b) our ability to maintain growth; (c) our ability to grow from new customer wins, new
property openings and the entrance into new markets combined with new product extensions like QuikTicket; (d) our ability to
integrate the products and platforms acquired from Atrient and Micro Gaming Technologies; (e) our positioning for the future; (f)
the recurring nature of our revenues; (g) expected key improvements in free cash flow; (h) our expansion into new product
categories; (i) our ability to successfully complete and integrate recently acquired businesses and anticipated acquisitions; (j)
guidance related to 2020 financial and operational metrics, including Adjusted EBITDA, Free Cash Flow, unit sales of Games units
and FinTech equipment, the installed base size and placements, Daily Win per Unit, revenues, the contribution from acquisitions,
and anticipated levels of capital expenditures and placement fees, depreciation expense, amortization expense, interest expense,
and income tax benefit, including cash tax payments, cash interest payments, non-cash stock compensation expense, accretion of
contract rights and net income.

                                                                                                                                         2
SAFE HARBOR DISCLAIMER
Forward-looking statements are neither historical facts nor assurances of future performance. Instead, they are based only on our
current beliefs, expectations and assumptions regarding the future of our business, future plans and strategies, projections, anticipated
events and trends, the economy and other future conditions. Because forward-looking statements relate to the future, they are subject
to inherent risks, uncertainties and changes in circumstances that are often difficult to predict and many of which are beyond our
control. Our actual results and financial condition may differ materially from those indicated in forward-looking statements. Important
factors that could cause our actual results and financial condition to differ materially from those indicated in the forward-looking
statements include, without limitation, our history of net losses and our ability to generate profits in the future; our substantial leverage
and the related covenants that restrict our operations; our ability to generate sufficient cash to service all of our indebtedness, fund
working capital, and capital expenditures; our ability to withstand unanticipated impacts of a pandemic outbreak of uncertain duration;
our ability to withstand the loss of revenue during the closure of our customers’ facilities; our ability to maintain our current customers;
our ability to compete in the gaming industry; our ability to execute on mergers, acquisitions and/or strategic alliances, including the
timing and closing of acquisitions and our ability to integrate and operate such acquisitions consistent with our forecasts; our ability to
access the capital markets to raise funds; expectations regarding our existing and future installed base and win per day; expectations
regarding development and placement fee arrangements; inaccuracies in underlying operating assumptions; expectations regarding
customers’ preferences and demands for future gaming offerings; expectations regarding our product portfolio; the overall growth of
the gaming industry, if any; our ability to replace revenue associated with terminated contracts; margin degradation from contract
renewals; technological obsolescence; our ability to comply with the Europay, MasterCard and Visa global standard for cards equipped
with security chip technology; our ability to introduce new products and services, including third-party licensed content; gaming
establishment and patron preferences; our ability to prevent, mitigate or timely recover from cybersecurity breaches, attacks and
compromises; the level of our capital expenditures and product development; anticipated sales performance; employee turnover;
national and international economic conditions; changes in gaming regulatory, card association and statutory requirements; regulatory
and licensing difficulties that we may face; competitive pressures in the gaming and financial technology sectors; the impact of changes
to tax laws; uncertainty of litigation outcomes; interest rate fluctuations; unanticipated expenses or capital needs and those other risks
and uncertainties discussed in our most recent Annual Report on Form 10-K filed with the U.S. Securities and Exchange Commission on
March 2, 2020. Given these risks and uncertainties, there can be no assurance that the forward-looking information contained in this
presentation will in fact transpire or prove to be accurate. Readers are cautioned not to place undue reliance on the forward-looking
statements contained herein, which are based only on information currently available to us and speak only as of the date hereof.
                                                                                                                                     3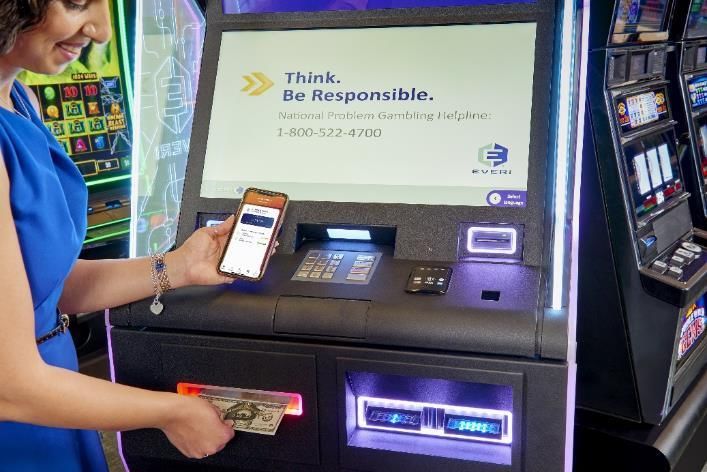
EVERI: WHO WE ARE
         ➢ Innovative gaming technology supplier, operating
           through two high-value product segments
         ➢ Focused on restoring pre-COVID growth momentum
  Games: A leading developer of imaginative, player-                                        FinTech: The gaming industry’s preeminent provider of
  popular, differentiated, and entertaining games, and                                      integrated financial products, information and regulatory
  other gaming services                                                                     compliance software, and player loyalty tools

 Full Year Snapshot - 2019:                                                                 Full Year Snapshot - 2019:
 ▪ Adjusted EBITDA(1) : $137.8 million, up 9%                                               ▪ Adjusted EBITDA(1) : $115.4 million, up 11%
 ▪ Revenue: $283.1 million, up 9%                                                           ▪ Revenue: $250.1 million, up 19%
 ▪ Installed Footprint(2): 14,711; with DWPU of $34.52, up 16%                              ▪ Number of Transactions Processed: 115.6 million, up 7%
 ▪ Gaming Equipment Unit Sales: up 9% in 2019                                               ▪ Value of Transactions Processed: $30.6 billion, up 10%

DWPU = Daily Win Per Unit

 1) Adjusted EBITDA is a non-GAAP measure. Reconciliations to the most directly comparable GAAP measure can be found in the appendix to this presentation.
    Reconciliations for additional quarterly and annual periods can be found in applicable earnings releases located on Everi’s website at ir.everi.com.     4
 2) Footprint as of December 31, 2019 and DWPU is for the fourth quarter ended December 31, 2019.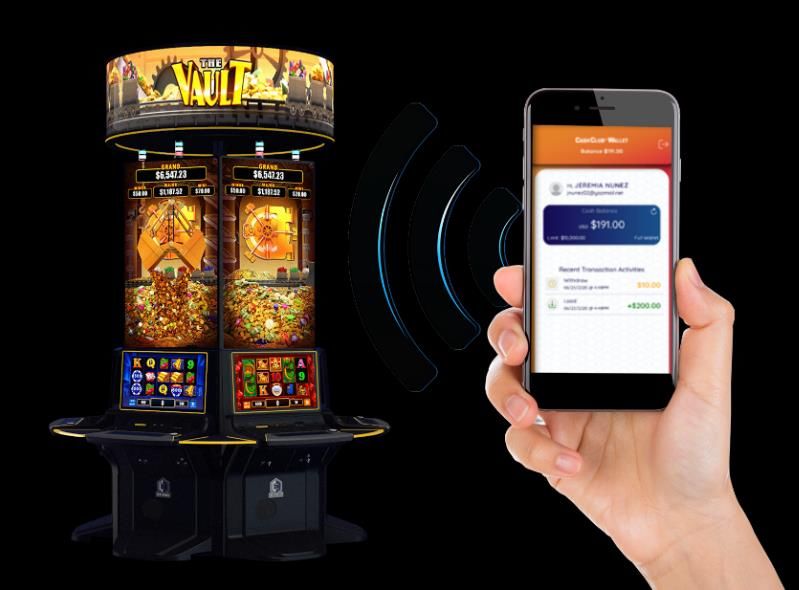
HISTORICAL RECURRING(1) REVENUE BASE
       Approximately 75% of 2019 revenues were of a recurring(1) nature

                                                              Gaming Operations: Leased gaming machines
                                 Revenue                      generally placed on a shared-revenue basis with
                                                              casino operators; approximately 30% of the total
 FinTech Equipment sales
                                                              installed base are units under a multi-year
                               5.9%                           placement contract; all other standard and
                                                              premium participation units generally remain on
                                                              casino floors for as long as in-casino performance
                                                              is acceptable, with periodic game theme updates
               Gaming                                         provided to refresh in-casino performance.
             Equipment,                           Gaming
           Systems & Other                       Operations
                18.4%
                                                              Cash Access Services:         Revenue earned on
                                                   35.4%
                                                              transactional activity under multi-year service
                                                              contracts (typically 3-5 years) with generally sticky
       Information                                            long-lasting relationships; average length of
       Services & Other
       8.2%
                                                              Everi’s Top 30 customer relationships is 11 years.

                                        Cash                  Information Services & Other:         Regulatory
                                       Access                 compliance, intelligence and player loyalty
                                      Services
                                       32.1%                  software and maintenance services are integrated
                                                              into casinos’ daily operations; and generally
                                                              provided under annual or multi-year agreements.

(1) When                                                                                                  5
           casinos are open.
LONG-TERM GROWTH DRIVERS
▪ New product roadmap leverages Game Development and FinTech Network
  » Grow Gaming Operations leased footprint as well as ship share of for-sale units by expanding
    portfolio of games and cabinets, and pipeline strength of new differentiated game content
  » Integrated FinTech product suite features productivity-enhancing cash and cashless patron funding
    capabilities, loyalty services, self-service Kiosks, and back-of-house compliance software and
    services that drive casino efficiencies

▪ Building a “Digital Neighborhood” with potential to transform gaming experience
  » Mobile CashClubWallet® app combines cashless funding with player loyalty tracking; facilitates
    seamless enterprise-wide player use between land-based and online amenities (including iGaming
    and sportsbook); integrates self-service player use with back-of-house operator processes (e.g.
    anti-money laundering, know-your-customer and other compliance needs) to enable 360-degree
    loyalty tracking of player spend, while driving casino operator cost efficiencies
▪ iGaming
  » Leverage land-based game portfolio and future pipeline with one of industry’s newest Remote
    Game Server (“RGS”) platforms to grow Digital gaming revenues from iGaming industry expansion

▪ Tuck-in acquisitions
  » Complementary businesses that can be scaled by leveraging existing resources to
    generate accretive earnings and cash flow

▪ Geographic expansion opportunities
  » Majority of business today is derived from the U.S. and Canada

                                                                                             6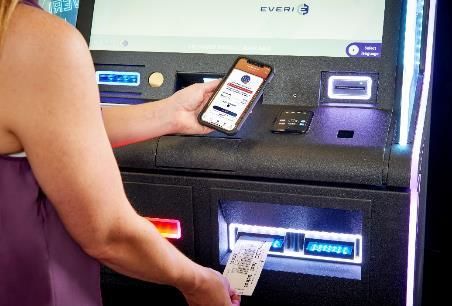
CONSISTENT LONG-TERM GROWTH
          Consistent operating execution, robust product pipeline and strong
            margins drive steady revenue and Adjusted EBITDA(1) growth

                              Revenue                                                                          Adjusted EBITDA (1)
($ in millions)                                                                         ($ in millions)
   $600                                                                                     $275.0

                                                                                                                                                                   $253.2
   $550                                                             $533.2                   $250.0

   $500                                                                                                                                          $230.4
                                                   $469.5                                    $225.0
                                                                                                                               $212.8
   $450
                                                                                                                $198.0
                                 $410.7                                                      $200.0
   $400         $383.1

                                                                                             $175.0
   $350

   $300                                                                                      $150.0
                2016              2017             2018             2019                                        2016            2017             2018              2019

                          2019 growth of 14% (2)                                                                            2019 growth of 10% (3)

       1) Adjusted EBITDA is a non-GAAP measure. Reconciliations to the most directly comparable GAAP measure can be found in the appendix to this presentation.
          Reconciliations for additional quarterly and annual periods can be found in applicable earnings releases located on Everi’s website at ir.everi.com.
       2) Acquisition of accretive player loyalty businesses contributed ~3% of revenue growth in 2019.                                                               7
       3) Margin compression in 2019 reflects business mix of more equipment revenues and higher operating expenses due to acquisitions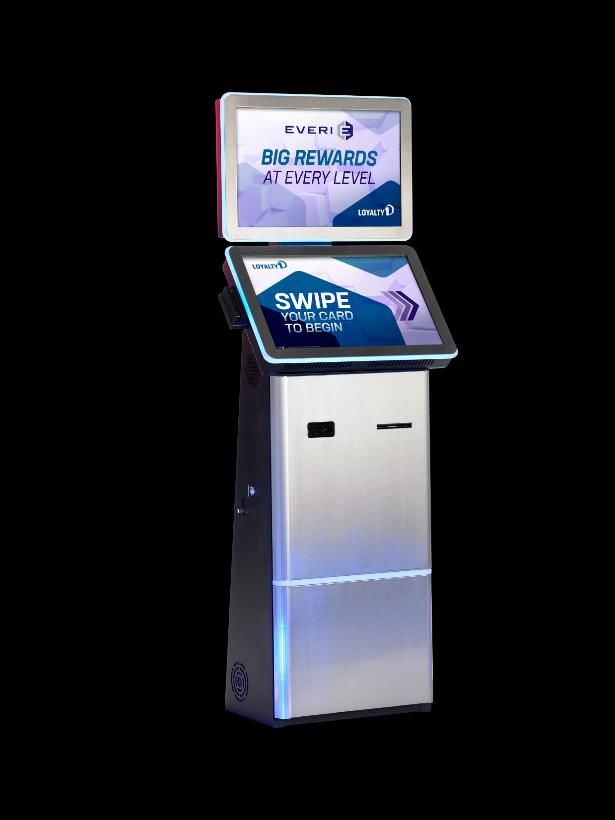
(1)
                         IMPROVED FREE CASH FLOW
                      Over 3.0x Free Cash Flow growth from 2016 to 2019

                $45

                                                                                                                               $43.8

                $30
$ in millions

                                                                                             $24.8

                $15
                                                            $13.8
                           $11.1

                 $0
                           2016                             2017                             2018                              2019

1) Free Cash Flow (‘FCF”) is a metric used by the Company to estimate the amount of cash generated from the recurring business operations.
   FCF is a non-GAAP measure. FCF is computed as Adjusted EBITDA less cash interest, cash paid for capital expenditures and placement fees,
   and cash taxes. A reconciliation of FCF for 2016, 2017, 2018 & 2019 to the most directly comparable GAAP measure for historical periods can   8
   be found in the appendix to this presentation.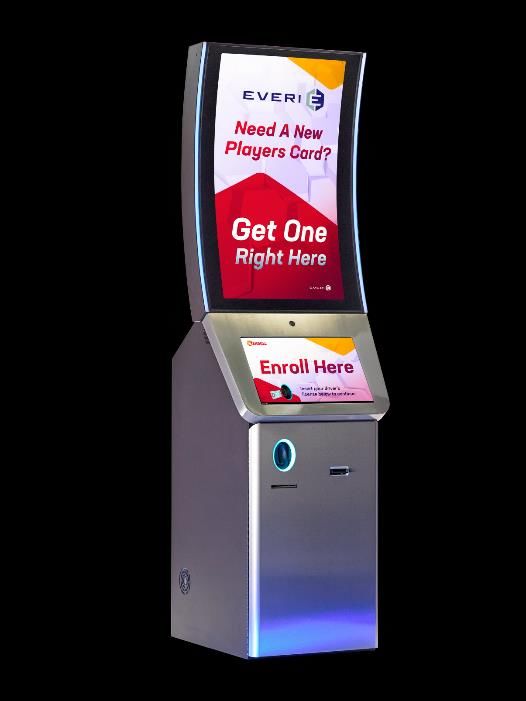
CONSOLIDATED TOTAL NET LEVERAGE RATIO(1)
                           ➢ Company is much stronger today than 2 years ago
                           ➢ Longer-term target is 3.0x – 3.5x LTM Adjusted EBITDA(2)
             6.0x
                                                                                                                        Capital Deployment(4)(5)
                              5.6x
                                                                                                                             24 months ended 12/31/2019
                                              5.4x
             5.0x                                                                                             Acquisitions
                                                              4.9x                                            $35 Million

             4.0x
                                                                              3.9x
                                                                                                                         Net Debt               CapEx &
                                                                                                                         Decrease               Placement Fees
             3.0x                                                                                                        $151 Million           $255 Million
                                                                                               3.0x

             2.0x
                                                                                         (3)
                             2016            2017           2018 2019 PF                    LT
                                                                                          Target

As provided in the Credit Facility for purposes of the calculation of the Consolidated Total Net Leverage ratio, the Company nets cash and cash equivalents of up to $50 million against the
respective debt outstanding to determine the appropriate Leverage Ratio.
1) We define Total Net Debt as total principal face value of debt outstanding, the most directly comparable GAAP measure, less cash and cash equivalents or $50 million, whichever is smaller.
   Total Net Debt Leverage Ratio represents Total Net Debt divided by Adjusted EBITDA for the trailing twelve-month period.
2) Adjusted EBITDA is a non-GAAP measure. Reconciliations to the most directly comparable GAAP measure can be found in the appendix to this presentation. Reconciliations for additional
   quarterly and annual periods can be found in applicable earnings releases located on Everi’s website at ir.everi.com.
3) 2019 pro forma includes the $85 million reduction of senior unsecured notes paid on January 6, 2020.
4) Capital Deployment based on $359 million generated from Net Cash from Operating Activities less Changes in Working Capital plus the net equity raise of $120 million in December 2019 used
   to accelerate debt reduction. CapEx & Placement Fees includes $38 million of Placement Fees, which are essentially paid up. Net Debt decrease includes $85 million of Notes repurchased as a
   result of the equity raise that was not paid until January 6, 2020. Cash and cash equivalents also increased during the period                                                9

5) In 1H-20, Company drew down its $35 million revolving credit facility and raised $118 million net from incremental term loan to provide liquidity cushion in face of COVID-19 pandemic.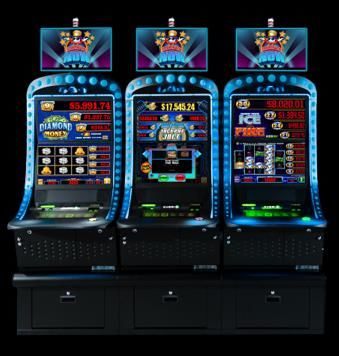
OUR SECRET SAUCE: OUR PEOPLE AND PRODUCTS

                                       10
2Q-2020 QUARTER RESULTS
➢ Reflects impact of the COVID-19 pandemic and related casino closures
➢ Better-than-expected financial results
➢ Swift actions in March to reduce operating costs to preserve liquidity
➢ Steps taken to focus priorities and enhance operational efficiencies
➢ Strength of recurring revenue games and FinTech solutions as casinos reopen
▪ Active gaming operations units performing at pre-pandemic levels
▪ Installed base increased in 2Q-2020, with premium units up 636 units from 1/1/20
▪ Same-store cash access transaction volumes only moderately below prior year
▪ Increased interest from casino operators for our cashless funding options
➢ Revenue base and strength driven by tribal and regional casinos, which are generally
the faster-growing and less cyclical portion of the Gaming market
➢ Increased liquidity cushion with $118 million net from incremental term loan
CURRENT ENVIRONMENT
➢ Based on current conditions and performance trends, the Company expects to generate
positive Adjusted EBITDA and Free Cash Flow in 3Q-2020 (compared to prior expectation
for Free Cash Flow beginning in 4Q-2020)
➢ Focus is on helping customers and prioritizing innovation and higher-value opportunities
➢ Favorably positioned to leverage industry leadership in cash access funding and self-
service player loyalty products to lead the evolution toward cashless funding
11INDUSTRY
OVERVIEW
12U.S. GAMING IS A GROWING MARKET
➢ Historical strength in Tribal Casinos positions the Company well in the faster-growing
and less cyclical portion of the Gaming market
➢ Increased penetration in Commercial Casinos opens significant potential for growth
13
© 2019 Meister Economic Consulting. Used with Permission by Dr. Alan Meister.GAMING INDUSTRY IS LARGE AND GROWING
US gaming industry does $75 billion in gross gaming revenue (“GGR”)
➢Tribal gaming revenues increased 4.1% to $33.7 billion in 2018 over 2017
• 501 casinos in 2018, up from 474 casinos in 2015
• Oklahoma tribal reporting region(1) increased 5.2% in 2018
➢Commercial gaming revenues grew 3.5% to $41.7 billion in 2018
• 465 casinos and racinos in 2018, up from 460 in 2015
Everi processed more than 115 million financial funding (cash and
cashless) transactions in 2019, up 7% Y/Y, providing more than 10
million players with $30+ billion of cash, up 10% Y/Y
➢Prior to casino closures due to COVID-19 pandemic, 4Q19 was the 21st
consecutive quarter of growth in the number and value of financial transactions
processed on a same-store basis
Everi estimates it has ~40,000+ gaming units on casino floors across the
U.S. and Canada, an estimated 4% of the total installed units
➢More than 1 million(2) gaming machines in the U.S. and Canada
➢Includes slot machines, VLTs (Video Lottery Terminals in non-casino venues), and
other electronic gaming machines
1) Oklahoma tribal reporting region, as defined by the National Indian Gaming Commission, includes casinos in Oklahoma, Kansas and Texas 14
2) Eilers and Krejcik Gaming, LLC., Slot & Table Count – 4Q19; total units are 1,001,338 units at 12/31/2019, up 20,390 units from 12/31/2016EVERI GAMES
BACKGROUND
15GAMES FINANCIAL OVERVIEW
2019 revenue up 9% and Adjusted EBITDA up 9%, driven by:
• New product pipeline of differentiated cabinets and high-performing premium games
leading to increase in installed base of leased units, DWPU and ship share
• Refresh of aging installed base of third-party units and older proprietary cabinets
• Team-focused game development studios in Austin, Chicago and Reno
Revenue (1) Adjusted EBITDA (2)
($ in millions) ($ in millions)
$300 $140 $137.8
$283.1
$259.0
$260 $130
$126.8
$222.2
$220 $213.3 $120
$116.0 $116.0
$180 $110
2016 2017 2018 2019 2016 2017 2018 2019
1) Revenues for all periods presented prior to 2018 are presented on a comparable basis to retrospectively reflect a net versus gross reporting of revenues
under ASC 606, adopted January 1, 2018, which primarily impacts the Company’s Financial Technology Solutions business.
16
2) Adjusted EBITDA is a non-GAAP measure. Reconciliations to the most directly comparable GAAP measure can be found in the appendix to this presentation.
Reconciliations for additional quarterly and annual periods can be found in applicable earnings releases located on Everi’s website at ir.everi.com.GAMES THAT MAKE CUSTOMERS LOOK GOOD
Everi Games generates revenues: 1) from sales of gaming machines to commercial and tribal
casino operators, 2) in gaming operations through placement of recurring revenue gaming
machines on casino floors, as the operator of New York State’s video lottery terminal (“VLT”)
central system and from digital iGaming, and 3) gaming other, which primarily includes operating
the TournEvent of Champions®, the gaming industry’s largest annual slot tournament
Games Revenues Premium Units
$283.1 million in 2019
Driving Growth
Gaming Other 14,711 units at 12/31/2019
35%
32% 67%
Sales 65% Premium Units
Gaming
Operations
As of 2Q-2020 Installed Base rose to
14,938 units, with Premium Units
Gaming Operations
increasing to 39% of the total base
Gaming Equipment and Systems
Gaming Other (primarily from operating the TournEvent of Champions®)
17STRONG PRODUCT PORTFOLIO…
Expanding product portfolio with increased content depth and development
pipeline provides opportunities for growth with existing customers and
expansion into new markets and categories
Premium Leased Video Premium Leased Mechanical
Standard TournEvent®
Video Mechanical
(1)
(1) New Empire Flex™ cabinet launched with first casino shipments in early 2020. 18…DRIVES MEANINGFUL GROWTH
GAMING OPERATIONS
UNIT SALES
PROPRIETARY UNITS AND
TOTAL INSTALLED BASE(1)
15,000 14,711
4,917
13,999 5,000
4,513
13,304 13,264 13,296
13,000 3,647
2,954
14,406
3,000 2,798
11,000 13,390
12,533
11,931
10,786
9,000 1,000
2015 2016 2017 2018 2019 2015 2016 2017 2018 2019
Installed base increased to 14,938 units as of Unit Sales and Ship Share increased in 2019,
6/30/20, with Daily Win per Unit (up 16% in but shipments are down in 2020 industry
2019) down in 2020 due to the pandemic that wide due to the pandemic impact
closed casinos
1) Proprietary units exclude 3rd Party Class III units: 2,554 units at Y/E 2015, 1,333 units at Y/E 2016, 763 units at Y/E 2017,
609 units at Y/E 2018 and 305 units at Y/E 2019. Prior to the acquisition, Multimedia Games Holding Company distributed 19
and leased non-proprietary Class III games from other suppliers.EVERI DIGITAL
Leveraging Everi’s success in land-based casino games and game
development to distribute its content into the rapidly expanding
online iGaming market channel
➢ Using its remote game server (“RGS”), Everi connects its gaming content directly
or through third-party aggregators to real money gaming and social gaming
operators. iGaming operators combine Everi games content with other suppliers’
content to provide online players with access to a broad portfolio of casino games
➢ Launched real-money games in New Jersey in 2Q-2019 with 6 initial themes to a
single online operator; expanded into Pennsylvania in 4Q-2019 and Quebec in
2Q-2020. Today, Everi offers more than 25 games to operators and is live at 19
sites plus additional sites through content aggregators, with further online site
installations in multiple states pending.
➢ Live at 40+ online operators’ free-for-play sites with social-only content
Everi also maintains a small online presence through two social (free-to-play) casino
apps in a direct-to-consumer mobile and desktop platform
20EVERI FINTECH
BACKGROUND
21FINTECH FINANCIAL OVERVIEW
2019 revenue up 19% and Adjusted EBITDA up 11%, driven by:
- Same-store increases in cash and cashless funding transactions and volume
- Winning of new customers and casino expansions
- Cross-selling opportunities between funding access, regulatory compliance products, player
loyalty, and other products and services (integration benefits offer customer efficiencies)
- Introduction of innovative new products: EveriCares®, QuikTicket®, JackpotXpress®
- Acquisition of accretive player loyalty businesses contributed ~8% to revenue growth in 2019
Revenue (1) Adjusted EBITDA (2)
($ in millions) ($ in millions)
$270 $120
$115.4
$250.2
$230 $105 $103.6
$210.5 $96.9
$188.5 $90
$190
$169.8 $82.0
$150 $75
2016 2017 2018 2019 2016 2017 2018 2019
1) Revenues for all periods presented prior to 2018 are presented on a comparable basis to retrospectively reflect a net versus gross reporting of revenues under
ASC 606, adopted January 1, 2018, which primarily impacts the Company’s Financial Technology Solutions business.
22
2) Adjusted EBITDA is a non-GAAP measure. Reconciliations to the most directly comparable GAAP measure can be found in the appendix to this presentation.
Reconciliations for additional quarterly and annual periods can be found in applicable earnings releases located on Everi’s website at ir.everi.com.TRANSACTION GROWTH
▪ Steady cash and cashless growth driven by new customer wins, new property openings,
entrance into new markets, introduction of new product extensions like QuikTicket®, and
addition of new transaction types like American Express and dynamic currency conversion
• 4Q-2019 was 21st consecutive quarter of year-over-year growth in financial transactions
and value processed on a same-store locations basis
Number of Transactions Transactional Value
120.0 $35.0
115.6
$30.0 $30.6
105.0 107.6
$ in billions
$27.9
In millions
99.6 $25.0
$25.3
90.0
$21.6
87.4 $20.0
75.0 $15.0
2016 2017 2018 2019 2016 2017 2018 2019
1H-2020 transactions and value processed were down year over year as a result of the pandemic
and related casino closures 23GAMING’S COMPREHENSIVE FINTECH SUPPLIER
▪ Offers a comprehensive suite of self-
service patron convenient products
and services that deliver cost
efficiencies to casino operators
▪ Generates more cash to the floor
from fully integrated products and
innovative functionality
▪ Provides back-of-house applications
and tools that allow operators to
maintain the highest levels of
compliance with AML, Know-Your-
Customer and other regulatory
demands
▪ Operates a highly secure, proven
and trusted network
24
24INDUSTRY WINNING PRODUCTS AND SERVICES
A comprehensive interconnected suite of financial technology, regulatory
compliance and player loyalty services and solutions integrated into casinos’
core operations, often featuring casino patron self service
Cash and Cashless Patron Funding Compliance, Player Loyalty and Other Services
Debit Cash Advance Check Services
⚫ Player Loyalty – software solutions to enable
⚫ Debit card, cash ⚫ Cash advances ⚫ Provides warranty
casino operators to tailor marketing
advance and ATM through credit service on casino
promotions to their patrons
cash dispensing or debit card check acceptance
withdrawals transactions and facilitates ⚫ Compliance – suite of software offerings
patron self- equipping casinos with reporting and
⚫ Cashless purchases service check compliance tools
of gaming vouchers cashing
through debit card ⚫ Central Credit – credit bureau with tools
transactions enabling operators to make informed
decisions on issuance of gaming credit
⚫ Kiosk and equipment maintenance and
support under recurring annual agreements
Kiosks and Other Equipment Comprehensive Solutions
Gaming Operators Patrons
⚫ Self-service fully integrated ⚫ Cash & Cashless Funding ⚫ Card Transactions
Kiosks that enable patrons to ⚫ Customer Identification ⚫ Balance Inquiry / Transfer
access cash and cashless funding ⚫ Credit Check ⚫ Redeem Winnings
and engage with casino loyalty
⚫ Tax Form Generation ⚫ Check Cashing
systems
⚫ AML Management ⚫ Break Bills
⚫ Kiosk machines that enable
⚫ Cash Handling ⚫ Request Gaming Credit
streamlined cash handling and
⚫ Credit Management ⚫ Currency Conversion
financial transaction processing
⚫ Compliance Tools ⚫ Digital Wallet
CageXchange RecyclerXchange ⚫ Target Marketing ⚫ Loyalty Programs
25PLAYER LOYALTY & MARKETING
▪ March 2019 and December 2019 accretive and strategic
acquisitions added complementary products, platforms and
technologies focused on supporting operators needs for
player loyalty enrollment and marketing/promotional
software and self-service kiosks
▪ Enables seamless connections between casinos’ loyalty Promotional Kiosks
➢ Drawings
programs and their patrons ➢ Promotions
➢ Incentives
▪ Product and service portfolio is highly complementary to
FinTech portfolio, expanding Everi’s one-stop shop of
comprehensive integrated offerings
▪ Expands interaction with gaming patrons and increases
customer footprint, while deepening relationships with key
customers
Card Printing Kiosks
▪ Supplements current future-facing FinTech solution offering ➢ Enroll Patrons
➢ Reprint Club Cards
» CashClub Wallet® integration allows for combination of mobile ➢ Update Contact
cashless funding and payments with a promotion engine Information
» Opportunity to enhance existing touch points (i.e. fully integrated
kiosks) to utilize newly acquired functionality
» Mobile app provides convenient on-the-go
access for casino patrons
26ROADMAP FOR CASHLESS GAMING
➢ Company facilitated more than 115 million funding
transactions in 2019, which delivered $30+ billion of
cash to casino floors
➢ Cash access funding positions Everi to drive industry
evolution towards cashless/contactless solutions
➢ Expect adoption of cashless and contactless funding
solutions to grow, while casino floor funding likely
to remain focused on existing solutions near-term
➢ Product suite, built around CashClub Wallet® mobile
app, includes solutions already live and those
expected to launch in coming quarters
• CashClub Wallet® mobile app
• Digital white-labeled enterprise-wide app
• Expected to be live with customers by 2020 year-end
• Enhanced patron experience enabled thru players
access to funds (cash or cashless) when they want, how
they want and where they want
• Everi mobile wallet with gaming voucher
• Ready for deployment in 3Q-2020
• Extends functionality of existing QuikTicket® gaming 27
voucher platformENTERPRISE-WIDE DIGITAL CASHCLUB WALLET® APP
Cashless & Fast & Cost
Effective
Touchless
Delivery Online Sports
Low Staff Self Betting
Impact Service
On Premise Online
Loyalty Offers iGaming
Enables One-Source Bi-Directional Funding CashClub®
Wallet Seamless Bridge of Front & Back of House
Ecosystem
▪ Provides compelling
Security Responsible Gaming patron experience Compliance Regulation
• PCI & Data Security • Self Exclusion ▪ Offers operator cost • Know Your • Banking
• PII & Data Privacy • Velocity Limits efficiencies and 360° Customer (KYC) • Gaming
(Geography & Duration) patron tracking • Anti-Money • Payments
• Merchant Laundering (AML)
▪ Prospects for more • Tax & Compliance
transaction activity
and new revenues 28A VISION FOR END-TO-END CUSTOMER CAPTURE
Loyalty Enrollment Kiosk
Support all end-to-end self-service features
through enrollment.
New Patron
Everi Mobile Application
Securely and privately interact with any device to
manage my account and enhance my experience
across the property.
Game Play
Enable a completely digital gaming
experience with reduced friction and
increased transparency
Ready Retail
to Play! Convenient Access to wallet funds
in the retail space
Kiosk
Reduce cage traffic through
robust self-service functions.
Connected Casino Flow
• Enter Property
• Enroll (if first time)
• Connect
• Play
• Self-Serve 29
• ExtendINVESTMENT SUMMARY
1 ROBUST BASE OF HISTORICALLY RECURRING REVENUE
• Approximately 75% of 2019 revenue is historically of a recurring nature
• Sticky 3-5 year cash access service contracts; average life of the relationship with our Top 30 customers is 11 years
• Regulatory compliance and player loyalty subscription services integrated into casinos operating protocols
• As of 6/30/2020, 14,938 installed games on a fixed fee or revenue share lease - 39% premium units that are driving improvements in DWPU
• Agreement to provide central determinant system to NY Lottery’s over 17,000 VLTs renewed for additional 10 years
2 SUSTAINABLE LONG-TERM GROWTH DRIVERS
• High performing premium game performance and new product launches driving market share growth
• FinTech segment growth opportunities include potentially a game-changing digital wallet, as well a high-value loyalty products
• Whitespace opportunity exists to drive market share in both commercial and tribal gaming, as well as in online markets
• Additional tuck-in acquisition opportunities
• International expansion opportunities
3 GROWTH POTENTIAL OF GAMING UNITS AND TRANSACTIONAL VALUE
• Strong portfolio of proprietary and branded Class II and Class III games, three new cabinets launched in early 2020
• More than 60% of our fully integrated Kiosk placements are already at least 3 years old, which is expected to drive ongoing replacement sales
• Gaming equipment quarterly ship shares and floor share of new casino openings are higher than historical levels
• Number of financial transactions and value processed continue to grow on a same-store basis (when casinos are open and active)
4 HIGH-VALUE PRODUCTS AND SERVICES FOR GAMING OPERATORS
• Offers casino operators a comprehensive, high-value, expanding portfolio of game content, gaming devices, financial technology solutions,
regulatory compliance, and player loyalty tools that drive revenue and cost efficiencies
5 STRONG FREE CASH FLOW(1)
• Games segment capital investments have improved capital efficiency and incremental cash flow
• Targeted capital expenditure for premium game installations drives strong operating results
• Over 3.0x Free Cash Flow(1) growth between 2016 and 2019.
• Company had been on a track of reducing total debt prior to the onset of the pandemic, with a longer-term target of 3.0x – 3.5x. To augment
its near-term liquidity, Everi completed a $125 million incremental term loan in April 2020 under its existing Senior Secured Credit Facility.
1) Free Cash Flow (“FCF”) is a metric used by the Company to estimate the amount of cash generated from the recurring business operations. This is a non-GAAP 30
measure. FCF is computed as Adjusted EBITDA less the sum of cash interest expense, cash paid for capital expenditures and placement fees, and net cash taxes.
A reconciliation of FCF for 2016, 2017, 2018 and 2019 to the most directly comparable GAAP measure can be found in the appendix to this presentation.APPENDIX
31NON-GAAP FINANCIAL MEASURES
Non-GAAP Financial Information
In order to enhance investor understanding of the underlying trends in our business, our cash balance and cash available for our operating
needs, and to provide for better comparability between periods in different years, we are providing in this presentation Adjusted EBITDA,
Free Cash Flow, Net Cash Position and Net Cash Available, and Total Net Debt and Total Net Debt Leverage Ratio, which are not measures of
our financial performance or position under United States Generally Accepted Accounting Principles (“GAAP”). Accordingly, Adjusted EBITDA
and Free Cash Flow should not be considered in isolation or as a substitute for measures prepared in accordance with GAAP. These
measures should be read in conjunction with our net earnings, operating income, basic and diluted earnings per share, and cash flow data
prepared in accordance with GAAP. With respect to Net Cash Position and Net Cash Available, these measures should be read in conjunction
with cash and cash equivalents prepared in accordance with GAAP. Total Net Debt and Total Net Debt Leverage Ratio should be read in
conjunction with principal face value of debt outstanding and cash and cash equivalents.
We define Adjusted EBITDA as earnings (loss) before interest, taxes, depreciation and amortization, loss on extinguishment of debt, non-cash
stock compensation expense, accretion of contract rights, write-down of assets, litigation accrual, employee severance costs and other
expenses, foreign exchange loss, asset acquisition expense, non-recurring professional fees, other one-time charges and the adjustment of
certain purchase accounting liabilities. We present Adjusted EBITDA as we use this measure to manage our business and consider this
measure to be supplemental to our operating performance. We also make certain compensation decisions based, in part, on our operating
performance, as measured by Adjusted EBITDA; and our current credit facility and existing senior unsecured notes require us to comply with
a consolidated secured leverage ratio that includes performance metrics substantially similar to Adjusted EBITDA.
Everi defines Free Cash Flow as Adjusted EBITDA less cash paid for interest, cash paid for capital expenditures, cash paid for placement fees,
and cash paid for taxes net of refunds. We present Free Cash Flow as a measure of performance and believe it provides investors with
another indicator of our operating performance. It should not be inferred that the entire Free Cash Flow amount is available for discretionary
expenditures.
Everi defines (i) Net Cash Position as cash and cash equivalents plus settlement receivables less settlement liabilities and (ii) Net Cash
Available as Net Cash Position plus undrawn amounts available under our revolving credit facility. We present Net Cash Position because our
cash position, as measured by cash and cash equivalents, depends upon changes in settlement receivables and the timing of payments
related to settlement liabilities. As such, our cash and cash equivalents can change substantially based upon the timing of our receipt of
payments for settlement receivables and payments we make to customers for our settlement liabilities. We present Net Cash Available as
management monitors this amount in connection with its forecasting of cash flows and future cash requirements.
Everi defines Total Net Debt as total principal face value of debt outstanding, the most directly comparable GAAP measure, less cash and
cash equivalents or $50 million, whichever is smaller. Total Net Debt Leverage Ratio, as used herein, represents Total Net Debt divided by
Adjusted EBITDA for the trailing twelve-month period. We present Total Net Debt and Total Net Debt Leverage Ratio as management
monitors these items in evaluating our overall liquidity, financial flexibility and leverage, as well as our financial position relative to our credit
agreements. Management believes that investors find these useful in evaluating the Company’s overall liquidity.
32UNAUDITED RECONCILIATION OF NET (LOSS) INCOME TO
ADJUSTED EBITDA AND FREE CASH FLOW AND
TOTAL NET DEBT LEVERAGE RATIO
(FY2016, FY2017, FY2018 & FY 2019 FINANCIALS)(NOTES ON MANAGEMENT ADJUSTMENTS NEXT PAGE)
Actual Actual Actual Actual Actual Actual Actual Actual Actual Actual Actual Actual
Adjusted EBITDA Reconciliation Games FinTech Consolidated Games FinTech Consolidated Games FinTech Consolidated Games FinTech Consolidated
($ in millions) 2016 2016 2016 2017 2017 2017 2018 2018 2018 2019 2019 2019
Net income (loss) $ (249,479) $ (51,903) $ 12,356 $ 16,517
Income tax provision (benefit) 31,696 (20,164) $ (9,710) $ (523)
Loss on extinguishment of debt - 51,750 $ 166 $ 179
Interest expense, net of interest income 99,228 102,136 $ 83,001 $ 77,844
Operating (loss) income (166,243) 47,688 (118,555) 8,952 72,867 81,819 $ 3,071 $ 82,742 $ 85,813 $ 10,376 $ 83,641 $ 94,017
Depreciation and amortization 120,974 23,659 144,633 97,487 19,300 116,787 $ 110,157 $ 16,313 $ 126,470 $ 114,373 $ 17,762 $ 132,135
Reported EBITDA (45,269) 71,347 26,078 106,439 92,167 198,606 $ 113,228 $ 99,055 $ 212,283 $ 124,749 $ 101,403 $ 226,152
Management's Adjustments:
1) Non-cash stock compensation expense 1,642 5,091 6,733 1,728 4,683 6,411 2,317 4,934 7,251 3,306 6,551 9,857
2) Non-cash goodwill impairment 146,299 - 146,299 - - - - - - - - -
3) Non-cash accretion of contract rights 8,692 - 8,692 7,819 - 7,819 8,421 - 8,421 8,710 - 8,710
4) Separation costs for former CEO - 4,687 4,687 - - - - - - - - -
5) Non-recurring professional fees, and other, net - - - - - - 204 204 408 (251) 1,244 993
Non-cash write-off of inventory, property and
6)
equipment, and intangible assets - - - - - - 2,575 - 2,575 1,268 - 1,268
7) Non-cash write-down of note receivable / warrant 4,289 - 4,289 - - - - - - - - -
8) Loss on sale of aircraft - 878 878 - - - - - - - - -
9) Manufacturing relocation costs 358 - 358 - - - - - - - - -
10) Legal Settlement - - - - - - 6,350 6,350
Non-cash adjustment to purchase accounting
11)
liabilities - - - - - - - (550) (550) - (129) (129)
Total Management Adjustments 161,280 10,656 171,936 9,547 4,683 14,230 $ 13,517 $ 4,588 $ 18,105 $ 13,033 $ 14,016 $ 27,049
Adjusted EBITDA $ 116,011 $ 82,003 $ 198,014 $ 115,986 $ 96,850 $ 212,836 $ 126,745 $ 103,643 $ 230,388 $ 137,782 $ 115,419 $ 253,201
Less:
Cash paid for Interest (93,420) (89,008) $ (81,609) $ (77,351)
Cash paid for capital expenditures (80,741) (96,490) $ (103,031) $ (114,291)
Cash paid for placement fees (11,312) (13,300) $ (20,556) $ (17,102)
Cash paid for income taxes, net of refunds (1,532) (180) $ (402) $ (694)
Free Cash Flow $ 11,009 $ 13,858 $ 24,790 $ 43,763
(1)
Principal Face Value of Debt $ 1,150,600 $ 1,190,900 $ 1,182,700 $ 1,124,000
Less: Cash & Cash Equivalents (2) (50,000) (50,000) (50,000) (50,000)
Total Net Debt $ 1,100,600 $ 1,140,900 $ 1,132,700 $ 1,074,000
Total Net Debt Leverage Ratio (3) 5.6 5.4 4.9 4.2
1) Principal face value of outstanding senior secured term loan facility, the senior secured revolving credit facility, senior unsecured notes and the senior secured notes (which were repaid as part of a refinance of our former term
33
loan facility in May 2017).
2) The Company nets the lesser of cash and cash equivalents or $50 million against debt outstanding, as provided in the Company's Credit Facility.
3) Total Net Debt Leverage Ratio represents Total Net Debt divided by Adjusted EBITDA for the trailing twelve-month period.UNAUDITED RECONCILIATION OF NET (LOSS) INCOME TO
ADJUSTED EBITDA AND FREE CASH FLOW AND
TOTAL NET DEBT LEVERAGE RATIO
(FY2016, FY2017, FY2018, & FY2019 FINANCIALS - CONTINUED)
Management’s Adjustments
1.Stock Compensation: The non-cash expense associated with the value of equity awards granted to
employees by the Company.
2.Goodwill impairment: Based on annual goodwill impairment testing, the Company determined the carrying
amount of its Games reporting unit exceeded its estimated fair value.
3.Accretion of contract rights: Amortization of the placement fees against gaming operations revenue for
terminals deployed at sites under placement fee agreements.
4.Separation costs of former CEO: Legal and severance costs associated with the termination of former CEO in
February 2016.
5.Professional fees, acquisition costs and other: Professional fees and transaction related fees incurred related
to the acquisition of certain player loyalty assets from Atrient and Micro Gaming Technologies, the repricing
and early redemption financing transactions, professional fees incurred for other projects not considered part
of normal course of business, and the net recovery of a Value Added Tax (“VAT”) refund.
6.Write-off of inventory, property and equipment, and intangible assets: Non-cash charge related to the
write-off of certain inventory, fixed assets, and intangible assets.
7.Write-down of note receivable and warrant: Write-down to fair value of a warrant and note receivable that
was extended by Multimedia Games, predecessor to Everi Games Holding Inc., to an Austin-based digital and
interactive company who defaulted on the note receivable.
8.Loss on the sale of the aircraft: Purchased an aircraft in 2015; upon termination of the former CEO, the
Company made the decision to sell the aircraft.
9.Manufacturing relocation costs: Costs to relocate and integrate certain Games manufacturing and
warehousing functions from NV and WA to Austin, TX.
10.Legal Settlement: A charge related to a proposed legal settlement of certain FinTech related litigation.
11.Adjustment of certain purchase accounting liabilities: Non-cash benefit related to the adjustment of
certain purchase accounting liabilities related to the acquisition of certain Compliance assets acquired in 2015.
34ADDITIONAL LEGAL AND LICENSOR LEGENDS
▪ © 2020 Discovery Communications, LLC. SHARK WEEK™ and the related logos are
trademarks of Discovery Communications, LLC, used under license. All rights reserved.
▪ Hot Stuff the Little Devil © 2020 Classic Media, LLC. All Rights Reserved.
▪ Willie Nelson™ and © WN Family Partnership, LTD. Used under license. All rights reserved.
▪ Everi Compliance® is a registered trademark of Everi Payments Inc. All rights reserved.
▪ LITTLE SHOP OF HORRORS and all related characters and elements © & ™ Turner
Entertainment Co. (s20)
▪ Penn & Teller: TM and © Buggs & Rudy Discount Corp. Used under license. All rights
reserved.
▪ THE MASK and all related characters and elements © & ™ Turner Entertainment Co. (s20)
▪ TOURNEVENT® is a registered trademark of Everi Games Inc. All rights reserved.
▪ CAGEXCHANGE and RECYCLERXCHANGE are trademarks of Everi Payments Inc. All rights
reserved.
▪ Zoltar ©™ 2020 Characters Unlimited, Inc. All Rights Reserved.
35FOR MORE INFORMATION
Bill Pfund
Vice President, Investor Relations
+1 (702) 676-9513
william.pfund@everi.com
NYSE: EVRI
36You can also read