Q2 2021 Point of View Edmonton Office Market - An Insight into the Edmonton Office Market - Cresa

Page created by Sheila Gutierrez
 
CONTINUE READING
Q2 2021 Point of View Edmonton Office Market - An Insight into the Edmonton Office Market - Cresa
Q2 2021 Point of View
Edmonton Office Market

An Insight into the Edmonton Office Market
Q2 2021 Point of View Edmonton Office Market - An Insight into the Edmonton Office Market - Cresa
Q2 2021 Point of View
Q2 2021 Point of View Edmonton Office Market - An Insight into the Edmonton Office Market - Cresa
Table of Contents
1.   Market Overview
2.   Market Forecast
3.   Additional Graphs and Tables
     ƒ   Current Office Vacancy
     ƒ   Sublease Vacancy Index
     ƒ   Comparative Historical Vacancy
     ƒ   Historical Office Absorption
     ƒ   Average Asking Net Rental Rates
     ƒ   Average Historical Operating Costs
Q2 2021 Point of View Edmonton Office Market - An Insight into the Edmonton Office Market - Cresa
Q2 2021 Point of View

Market Overview
Downtown & Suburban Office Market

It is still early days on the road to economic recovery,                                            Office Supply
but confidence is quickly returning with more long-term
                                                                                                 29,091,846 sf
optimism as reflected in an uptick in leasing activity in Q2
in the Greater Edmonton office market.
Q2, 2021 marked the beginning of the          Downtown
Covid recovery in the Alberta economy,        The Downtown market is composed
with the surprisingly rapid and dramatic      of Financial and Government Districts
drop in Covid positivity rates. At the time   totaling 17,721,586 square feet. The               Downtown Vacancy
of this writing, over 50% of Canadian         headlease vacancy increased to 15.50%,
citizens have been fully vaccinated with      while the sublease vacancy decreased                  18.18%
79% having received one shot which is         slightly to 2.68%, for an overall vacancy
one of the highest vaccination rates in       rate of 18.18%.
the world. In one word, the mood of the
Alberta economy can be described as           In the Financial District (12,783,655
relieved.                                     square feet), the overall vacancy
                                              increased to 18.26% from 17.77%
It is still early days on the road to         with headlease vacancy increasing to               Q1 2021 Downtown
economic recovery, but confidence is          14.65% from 13.84%. The sublease                    Office Absorption
quickly returning with more long-term         rate decreased to 3.60% from 3.93%.
optimism as reflected in an uptick in         The Financial AA vacancy decreased to                3,847 sf
leasing activity in Q2 in the Greater         15.30% from 16.17% as the sublease
Edmonton office market. Much of this          rate decreased to 6.16% from 6.17%. The
was related to early lease renewals, driven   overall Financial A vacancy trended in the
by users hedging on changing market           same direction with an increase of almost
conditions and by users who had been          2% to 20.55%. However, the sublease
previously delaying real estate decisions     rate dropped to 2.91% from 3.51%.
due to uncertainty.                                                                               Suburban Vacancy
                                              Combined, these two financial sublease
The Greater Edmonton office market            classes have over 490,583 square feet                 19.71%
emerged from the pandemic in relatively       of vacant space, representing over 72%
good shape, with vacancy only slightly        of all the sublease space in greater
increasing to 19.64% from 18.97% in Q2.       Edmonton. This is a significant number,
This overall rate includes headlease and      given how small a geographical footprint
sublease vacancy, with the headlease          that Edmonton’s Financial District
vacancy increasing to 16.96% from             occupies (four by four city blocks). Almost
16.17%, and the sublease vacancy              half of this vacancy can be attributed to           Q2 2021 Suburban
decreasing slightly to 2.68% from 2.80%.      Stantec, Telus, and Enbridge looking to
                                                                                                  Office Absorption

                                              shed additional unused space.
                                                                                                  -89,045 sf
Vacancy in the Government District dropped to          Sherwood Park
17.96% from 18.10%, with a headlease rate of           The Sherwood Park market is over 1,540,000
17.68% and sublease rate holding steady at .29%.       square feet in size. As mentioned in the Q1 report,
Suburbs                                                Sherwood Park is a good barometer for measuring
                                                       the health of the oil and gas market, with the
The overall suburban vacancy rate increased to
                                                       large service sector and consulting component
19.71%, from 18.26%. Headlease vacancy jumped
                                                       that makes up the Sherwood Park office market.
to 18.14% from 15.86%, with a small sublease
                                                       Although oil prices have climbed over the last
vacancy decrease to 1.57% from 2.40%. The
                                                       quarter very little movement took place in the
largest suburban market, the Southside (3,178, 202
                                                       vacancy rate, decreasing from 21.75% to 21.10%.
square feet), held steady at 23.55%, with very small
changes in the headlease and sublease rates of         Notable Transactions
19.63% and 3.91%. Virtually all this increase can be
attributed to the headlease market, with a sublease
                                                       Tenant                     Building         Area (sf)
vacancy rate of only .31%.
The third-largest suburban submarket, Eastgate,        Catholic Social Services   Alberta Park     27,000
showed a .4% increase to 22.31%, all the vacancies
being headlease space.
                                                       Trans Mountain Pipeline    Voice Building   25,000

                                                       EP Financial               Devonian         10,000

                                                       Ballad Consulting          Bell Tower       8,005
Q2 2021 Point of View

Market Forecast
Downtown & Suburban Projections

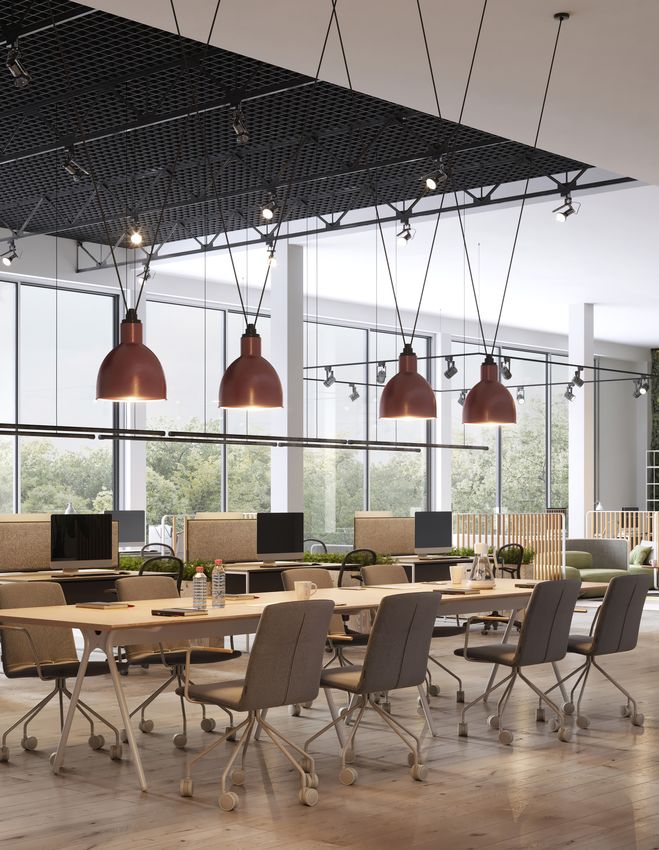
Company culture and close employee interaction play a big
role in the success of many organizations in delivering an
effective service or product in their industry.

There are several trends to watch for over the next         Company culture and close employee interaction
two quarters. Expect landlords to push back on rental       play a big role in the success of many organizations
rates and inducement expectations as they look to           in delivering an effective service or product in their
take advantage of the economic recovery. The market         industry. Technology platforms like Zoom meetings
may continue to see a period of diverging tenant and        and Microsoft Teams have limitations on achieving the
landlord expectations before a new market equilibrium       type of employee interaction that many companies
is reached. The vacancy was high pre covid and              require to succeed.
the only correcting force we are seeing is market           Second, in larger suburban markets like Toronto and
optimism. If some landlords push too hard many              Vancouver, remote working and hybrid office layouts
others are willing to be more aggressive to fill long-      may play a bigger role simply because commuting
term vacant spaces.                                         is more difficult for employees compared to smaller
In the last month, inflation has occurred as the global     centers like Edmonton and the cost of office space is
supply chain geared up to meet increased spending           much higher.
and pent-up demand for electrical components and            There is also a growing realization that reverting to
construction materials required for the reactivation of     remote working and hybrid office space could be a
all facets of the global economy. While the price of        costly endeavor for companies as they try to appease
lumber has started to drop, contractors are reporting       the whims of employees wanting to work remotely
increasing costs with all types of building materials       part-time while retaining their own private space
required for the build-out of office space. In some         in the office. If employees are not open to shared
cases, contractors have reported been given only            workspaces and hotelling employers may not see any
48 hours for firm price quotes for the purchase of          reduction in their need for office space.
materials. It is difficult to project how long this trend
will occur; perhaps anywhere between five to six            Remote working may play a bigger role in the public
months.                                                     sector with the Municipal, Provincial and Federal
                                                            departments that lease office space. With most
In the private sector remote working and hybrid office      of these departments located in the core, what
space will emerge in the Edmonton office market, but        they choose to mandate for employees will have
likely not to the degree that has been anticipated by       a significant impact on the recovery in downtown
some experts. Despite hundreds of surveys showing a         Edmonton. Government and government-related
demand for remote working, the source of the surveys        entities make up 40% of all office space in the
and who the people are that are being surveyed must         downtown market.
be considered. Some employees may want to work
remotely, but it is also readily apparent that many         If we want to see a vibrant downtown return, the three
companies and firms expect their employees back in          levels of government need to show leadership and
the office full time at some point soon.                    mandate staff return to their offices.
Q2 2021 Point of View

Current Office Vacancy
                                                                                                                                                                                    Downtown
                                                                                                                                                                                    Office
Overall, the greater Edmonton vacancy rates             Occupied vs Vacancy
                                                                                                                                             23.55%            18.26%
continue to rise across all sectors.                                                                                                         Southside          Financial

                                                                                                                                                                               17.96%
                                                                                                                                                                              Government
                                                                                                                                22.31%
                                                                                                                                 Eastgate

                                                                                                                                                                                     15.56%
                                                                                                                                                                                         Westend

                                                                                                                                21.53%
                                                                                                                                 124th                                              12.93%
                                                                                                                                                                                    149th Street

                                                                                                                                                                         17.85%
                                                                                                                                            22.37%                           Ellerslie
                                                                                                                                             Whyte
                                                                                                                                                          16.13%
                                                                                                                                                             Whyte
                                                    Vacant                    Occupied                                                                                                   Suburban
                                                                                                                                                                                         Office

                                                                                                         Sublease Vacancy Index
Sublease Vacancy Index
                                                            3,000,000
                                                                         19.74%                                                                                         Sublease Available
Over 72% of the entire greater Edmonton                                                                                                                                 Total Vacancy
                                                            2,500,000
sublease market is located in class A & AA
office towers in the Financial Core.                        2,000,000

                                                            1,500,000

                                                            1,000,000               1.61%                   5.45%

                                                               500,000
                                                                                                                      16.62%      4.36%
                                                Area (sf)

                                                                                                14.75%
                                                                                                                                              0.00%        0.00%            4.27%          5.97%

                                                                    0
                                                                         Financial Government   124th     Southside   Westend    Eastgate     118th      149th Street   Ellerslie          Whyte

                                                                                                  Comparative Vacancy Rate
                                                                                                     Q1 2015 - Q2 2021
Comparative Historical Vacancy
                                                                   25.00%

Vacancy continues to rise quarter over
                                                                   20.00%
quarter and we anticipate this trend will not
see an end any time soon.
                                                                   15.00%

                                                                   10.00%
                                                     Vacancy (%)

                                                                    5.00%

                                                                    0.00%
                                                                               Q2 2015
                                                                               Q3 2015
                                                                               Q4 2015
                                                                               Q1 2016
                                                                               Q2 2016
                                                                               Q3 2016
                                                                               Q4 2016
                                                                               Q1 2017
                                                                               Q2 2017
                                                                               Q3 2017
                                                                               Q4 2017
                                                                               Q1 2018
                                                                               Q2 2018
                                                                               Q3 2018
                                                                               Q4 2018
                                                                               Q1 2019
                                                                               Q2 2019
                                                                               Q3 2019
                                                                               Q4 2019
                                                                               Q1 2020
                                                                               Q2 2020
                                                                               Q3 2020
                                                                               Q4 2020
                                                                               Q1 2021
                                                                               Q2 2021

                                                                                          Total Financial                                   Total Government
Q2 2021 Point of View

                                                                                          Historical Office Absorption

                                           600
                                                                                                                                                                            Historical Office Absorption
                                           400
                                                                                                                                                                            Q2 2021 YTD net absorption for the overall
                                           200
                                                                                                                                                                            downtown market was -475, meaning not all
                                                                                                                                                                            of the vacancy can be absorbed in the market
                                             0                                                                                                                              under the current market conditions.

                                    -200
Absorption (000's sf)

                                    -400

                                    -600

                                                   Financial           Government             124th           Suburban Other               Quarterly Absorption DT/Sub

                                                                                        Average Asking Net Rental Rates
                                                                                                  2015-2021

                                            $25.00                                                                                                                          Average Asking Net Rental Rates

                                            $20.00                                                                                                                          Asking rates continue to hold steady, but
                                                                                                                                                                            tenant inducements continue to grow.
                                            $15.00

                                            $10.00
                        Avg Net Rent psf

                                             $5.00

                                                  $-
                                                             2015             2016          2017             2018             2019           2020            2021

                                                 Financial Net Asking Rates    Government Net Asking Rates     124th Net Asking Rates     Other Suburban Net Asking Rates

                                                                                            Average Operating Costs
                                                                                                  2015-2021

                                                                                                                                                                            Average Historical Operating Costs
                                      $20.00

                                      $18.00
                                                                                                                                                                            Operating costs have held steady in Q2 2021
                                      $16.00                                                                                                                                with little indication that there will be further
                                      $14.00                                                                                                                                increases in the next 12 months.
                                      $12.00

                                      $10.00

                                           $8.00

                                           $6.00

                                           $4.00
           Avg Net Rent psf

                                           $2.00

                                             $-
                                                           2015               2016           2017             2018               2019            2020               2021

                                              Financial Avg Op. Costs           Government Avg Op. Costs            124th Avg Op. Costs      Other Suburban Avg Op. Costs
Q2 2021 Point of View

Q2 2021 Vacancy Summary, Edmonton

 SUBMARKET                TOTAL SPACE     LEASE     SUBLEASE   LEASE    SUBLEASE    TOTAL
                               (sf)         (sf)       (sf)      (%)       (%)     VACANCY
 Financial AA              4,196,691     383,954     258,342    9.15%     6.16%     15.30%

 Financial A               6,534,213    1,152,600   189,977    17.64%    2.91%     20.55%

 Financial B               1,701,504     299,007      2,977    17.57%    0.17%     17.75%

 Financial C                351,247       37,612      9,375    10.71%    2.67%     13.38%

 Financial Total          12,783,655    1,187,173   460,671    14.65%    3.60%     18.26%

 Government A              2,276,308     501,491         0          0    0.00%     20.03%

 Government B              2,330,765     350,881     10,337    15.50%    0.44%     15.50%

 Government C               330,858       20,450      3,926     6.97%    1.19%      7.37%

 Government Total          4,937,931     872,822     14,263    17.68%    0.29%     17.96%

 DOWNTOWN TOTAL           17,721,586    2,745,995   474,934    15.50%    2.68%     18.18%

 124th A                    358,196       24,972      2,290     6.97%    0.64%      7.61%

 124th B                    444,968      123,657      2,868    27.79%    0.64%     28.43%

 124th C                    118,005       38,862      5,651    32.93%    4.79%     37.72%

 124th Total                921,169      187,491     10,809    20.35%    1.17%     21.53%

 Southside                 3,178,202     624,025    124,359    19.63%    3.91%     23.55%

 Westend                   1,651,468     245,772     11,213    14.88%    0.68%     15.56%

 Eastgate                  1,267,512     282,774         0     22.31%    0.00%     22.31%

 118th                      863,454      139,317         0     16.13%    0.00%     16.13%

 149th Street              1,091,900     135,186      6,024    12.38%    0.55%     12.93%

 Ellerslie                  774,227      129,967      8,259    16.79%    1.07%     17.85%

 Whyte                      622,328      136,798      2,444    21.98%    0.39%     22.37%

 SUBURBAN TOTAL           10,370,260    1,881,330   163,104    18.14%    1.57%     19.71%

 EDMONTON TOTAL           28,091,846    4,627,325   638,038    16.47%    2.27%     18.74%

 Sherwood Park             1,542,171     319,304      6,071    20.70%    0.39%     21.10%

 OVERALL EXISTING TOTAL   29,634,017    4,946,629   644,109    16.67%    2.17%     18.87%
CONTACT INFORMATION

TRANSACTION MANAGEMENT ADVISORY TEAM

Byron Wakeling                             Todd Walker                                Nicholas Farnden
780.993.2367                               780.952.8331                               780.938.7343
bwakeling@cresa.com                        twalker@cresa.com                          nfarnden@cresa.com

Cresa
10088 - 102 Avenue, Suite 1409 | Edmonton, AB T5J 2Z1                                    606 - 4 Street SW, Suite 1400 | Calgary, AB T2P 1T1
main 780.900.8781                                                                        main 403.571.8080

cresa.com

Cresa is an international corporate real estate advisory firm that exclusively represents tenants and specializes in the delivery of fully integrated real estate services,
including: Workplace Intelligence, Transaction Management, Project Management, Consulting, Lease Administration, Location Strategy & Economic Incentives,
Facilities Management, Global Portfolio Solutions and Investment Banking. For more information, visit www.cresa.com.

Even though obtained from sources deemed reliable, no warranty or representation, express or implied, is made as to the accuracy of the information herein, and it is subject to
errors, omissions, change of price, rental or other conditions, withdrawal without notice, and to any special listing conditions imposed by our principals.

All material in this publication is, unless otherwise stated, the property of Cresa. Copyright and other intellectual property laws protect these materials. Reproduction or
retransmission of the materials, in whole or in part, in any manner, without the prior written consent of Cresa is strictly prohibited.
Thinking
strategically.
Acting
objectively.

                 cresa.com
You can also read