Qantas Group Submission - Productivity Commission Inquiry into Economic Regulation of Airports
←
→
Page content transcription
If your browser does not render page correctly, please read the page content below

Qantas Group Submission
Productivity Commission Inquiry into
  Economic Regulation of Airports
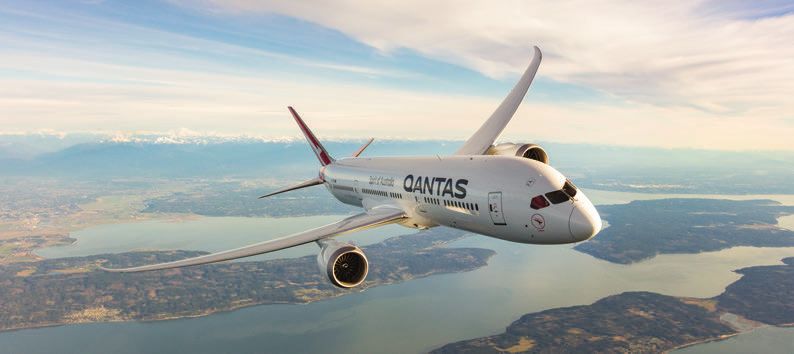
Qantas Group Submission
Productivity Commission Inquiry
into Economic Regulation of Airports

This is a public submission and an evidence-based documentation of Qantas
Group’s experiences of Australia’s airports’ monopoly behaviour. It focuses
on commercial negotiations, security services, infrastructure and matters of
fuel security and access to demonstrate how airports’ monopoly behaviour
negatively impacts the aviation industry, passenger welfare and productivity
growth. It is not an all-inclusive survey of airport regulation and airports’
monopoly power.
This submission supplements the investigations of and potential remedies
outlined by Airlines for Australia & New Zealand (A4ANZ) and broadly aligns
with the submissions made by International Air Transport Association (IATA)
and Board of Airline Representatives of Australia (BARA).
September 2018

2                          Q A N TA S G R O U P S U B M I S S I O N — P R O D U C T I V I T Y C O M M I S S I O N I N Q U I R Y I N T O E C O N O M I C R E G U L AT I O N O F A I R P O R T S

Table of Contents

1. Foreword                                                                                                                                                           4

2. Executive Summary                                                                                                                                                  6

3. A Fresh Look at Airport Market Power                                                                                                                               7

4. Aeronautical Services and Facilities                                                                                                                              11

5. Aviation Security                                                                                                                                                 28

6. Car Parking and Landside Access                                                                                                                                   32

7. Land Transport Linkages                                                                                                                                           33

8. Air Services to Access Regional New South Wales                                                                                                                   34

9. Aviation Fuel Security and Supply                                                                                                                                 35

10. Appendices                                                                                                                                                       39

           Appendix 1 Airport Ownership Key Developments                                                                                                             40

           Appendix 2 Australian Government Draft Aeronautical Pricing Principles                                                                                    43

           Appendix 3 Norton White Lawyers: Memorandum of Advice on Aviation Security                                                                                45

Q A N TA S G R O U P S U B M I S S I O N — P R O D U C T I V I T Y C O M M I S S I O N I N Q U I R Y I N T O E C O N O M I C R E G U L AT I O N O F A I R P O R T S        3
1. Foreword
Qantas has been at the forefront Millions of passengers
Today, Qantas Group, through its airlines Qantas, Jetstar,
of global aviation for almost 100 years. QantasLink and Qantas Freight, is a vital, globally competitive
aviation business that connects Australians to the world and the
Since its founding in outback world to Australia. Our airline brands operate regional, domestic
Queensland in 1920, it has grown and international services, and in FY18 carried more than 55 million
passengers. Qantas Group flies to 56 airports domestically and
to be Australia’s largest domestic operates 3 of its own passenger terminals.
and international airline and is Transformation has been central to our recent success. In 2002, we
consolidated regional operations to create QantasLink, which today
widely regarded as one of the world’s serves 48 regional communities, transporting 8 million passengers
last year. In 2004, we launched Jetstar Australia, a low-cost carrier
leading long-distance airlines and one that made travel affordable for millions of Australians. There are
of the strongest brands in Australia. now 4 Jetstar-branded airlines operating across the Asia Pacific,
which sold more than 24 million airfares under $100 in FY18.
We have diversified to build an effective portfolio of subsidiary
businesses ranging from Qantas Freight to Qantas Frequent Flyer
and adjacent Qantas Loyalty businesses. We directly employ more
than 29,000 Australians. Our suppliers provide jobs for tens of
thousands more.
Whether it is moving people or produce, Qantas Group is at the
heart of the modern Australian economy, delivering $11.6 billion
in added value, or 0.7% to Gross Domestic Product (GDP) in FY17
according to Deloitte Access Economics.(1)
Anything but a world-leading aviation sector places undue cost on
our entire economy.
Driving innovation and simplicity
Being a fit, agile and diverse organisation that drives innovation and
simplicity is core to our beliefs. As is the conviction that customers
determine our success. Our 3-year Qantas Transformation Program,
launched in December 2013, permanently increased our productivity
and competitiveness, delivered more choice and cheaper airfares
and embedded a commitment to innovate across the Qantas Group.
Through reductions in our domestic cost base, improved
productivity of our capital and our people and renegotiations
with key suppliers, we achieved over $2 billion worth of benefits.
As these benefits and efficiencies grew, we improved passenger
service and experience by investing in fleet replacements with 787
Dreamliner aircraft, new cabin infrastructure, technology such
as free on-board passenger Wi-Fi and new world first non-stop
routes including Perth-London. Five years on, this turnaround led
to Qantas Group posting a hard-earned $1.6 billion underlying profit
in FY18.
But we cannot rest on past achievements. Our future depends on
continued transformation – reducing costs, growing efficiency,
lifting productivity, and always innovating to better serve customers
with a wider range of more affordable airfares and travel options.
4 Q A N TA S G R O U P S U B M I S S I O N — P R O D U C T I V I T Y C O M M I S S I O N I N Q U I R Y I N T O E C O N O M I C R E G U L AT I O N O F A I R P O R T SCost efficiencies thwarted Australian airports are exploiting their market power to the
Fuel costs, expected to rise by $690 million in FY19 and detriment of the long-term interests of the Australian community.
competition in international markets, often from state-owned and We are not calling for heavy-handed regulation or government
monopoly carriers, are beyond Australians’ control. But the cost of intervention or unnecessary compliance. We seek fair, commercially
Australian airports need not be. negotiated outcomes that work in the best interests of the Australian
As natural monopolies, Australian airports have no effective aviation sector and millions of Australian airline passengers.
competition or reason to change or innovate. It is the family visiting Current economic regulation of Australian monopoly airports is
the Great Barrier Reef for the first time, the business traveller failing the Australian economy.
flying from Melbourne to Sydney for meetings, and the dairy farmer
sending fresh milk to the Chinese market that ultimately pay for the Modern, effective light-handed regulation underpinned by access
high and rising costs of Australian monopoly airports. to independent arbitration as a last resort will encourage airports
to behave competitively and deliver competitive prices, greater
There is no effective regulation to contain airport price increases efficiencies and leading innovations for passengers and airport
and price gouging, or to encourage operational efficiencies or users. It will grow productivity and advance efficient investment
improved quality of services. decisions.
Like other users of airports, we seek cost efficiencies in Australian We need airports to partner with us in reducing costs and making
airport charges. As natural monopolies, Australian airports have travel more accessible for more Australians. And we need airports
the economic advantage of falling costs as output increases. to deliver the same efficiency improvements that airlines do to
Despite these significant and continual increases in output ensure we can keep growing the Australian economy.
(passengers and freight), airport charges continue to rise.
Promoting fairness by simplifying the existing light-handed
As airlines have become more competitive and more efficient, regulation with a clear incentive for good performance will deter
airfares have declined nearly 40% in real terms over the past Australian monopoly airports from abusing their market power. Fair
decade. and reasonable pricing will make airports more efficient and more
Indeed, excluding airport charges and fuel, Qantas Group costs productive. This will produce better, more sustainable long-term
have fallen by 4% in real terms since FY15. At the same time, economic wellbeing for all Australians.
charges we paid to airports have grown 6.5% above inflation.
Lack of effective regulation has opened the door to blatant ANDREW PARKER
profiteering. Australian consumers are paying the price of Group Executive
constantly increasing airport charges. Government, Industry, International and Environment
Airport charges are now our fourth largest cost, after fuel, fleet
and people. While we negotiate successfully with other suppliers
to reduce costs and ultimately deliver better airfares and travel
experiences for passengers, charges by Australian monopoly
airports are largely non-negotiable.
Effective light-handed regulation
Current economic regulation of Australian monopoly airports is
failing the Australian economy.
Australian monopoly airports collect a toll at every step of a
passenger’s journey – from extracting high hourly and daily rates
for car parking, tolls for taxis and rideshare vehicles and airport
concession fees on hire cars to baggage trolley rentals, above-
market rents for cafes, newsagents and retailers, throughput levies
for jet fuel for aircraft, and finally airport charges on the airfare.
It is costing the economy, consumers and airlines billions of dollars
in lost productivity whilst lining the pockets of a few private
investors with super profits.
It is not producing the intended constraints on airports’ monopoly
behaviour, with declaration under the National Access Regime
(Part IIIA of the Consumer and Competition Act 2010) too uncertain,
expensive and time consuming to provide any protection and
the recent changes to the regime further inhibiting access to the
dispute resolution process.
Q A N TA S G R O U P S U B M I S S I O N — P R O D U C T I V I T Y C O M M I S S I O N I N Q U I R Y I N T O E C O N O M I C R E G U L AT I O N O F A I R P O R T S 52. Executive Summary
Exercising market power –– Australian airports have not passed on these lower costs through
All Australian airports implicitly and explicitly possess and exercise lower passenger charges.
market power to varying degrees.
Inefficient airport investments and operations
Many airports levy unreasonably high charges, enjoy above-market –– Australian airports frequently prioritise investments in retail,
profits, make inefficient business decisions and engage in poor car parking and other revenue-raising facilities over aviation
negotiating conduct. infrastructure – and expect passengers to pay for these through
Airlines and airport users currently have limited, if any, practical higher airport charges.
countervailing power. The supposition that airlines can withhold –– Fit-for-purpose aeronautical infrastructure is the exception,
capacity or service in markets where they must competitively offer not the norm, due to reliance on monopoly returns on that
passengers and customers a network of major and regional routes investment from airlines.
and airports flies in the face of commercial reality. –– Australian airports lack incentive to collaborate with airlines to
Australian passengers, producers, communities and the economy deliver innovative technology and facilities for passengers and
are ultimately paying the price of monopoly power through higher cargo instead relying on merely increasing capital investment.
airport charges and air freight costs, lower connectivity and fewer –– Australian airports currently have little incentive to act
opportunities for local and national employment creation. efficiently as they recover rising costs from customers.
Australian monopoly airports collect a toll at every step of a
Quality of airport services variable
passenger’s journey – from extracting high hourly and daily rates
for car parking, airport tolls for taxis and rideshare vehicles and –– Australian airports suffer a disconnect between performance
airport concession fees on hire cars to baggage trolley rentals, expected by, and the quality of services delivered to, passengers
above-market rents for cafés, newsagents and retailers, and and airlines.
throughput levies for jet fuel for aircraft – all before the airport –– Australian airport profits are unrelated to customer satisfaction
charges are included in their airfare. – the major Australian monopoly airports fall below the top 10
in customer satisfaction, with Sydney Airport ranking 20th,
Qantas Group airlines are members of A4ANZ, IATA and BARA and
Brisbane Airport ranking 23rd, Melbourne Airport ranking 27th,
the Group support the Productivity Commission consideration of
and Perth Airport ranking 59th.
approaches identified in these submissions.
–– ACCC price and quality monitoring data shows service quality levels
Excessive airport and aviation security charges and fees for passengers at the monitored airports are stagnant or declining
–– Over the past 10 years, Australia’s major airports enjoyed a 25% while unit revenue and profits at those airports have increased.
increase in revenue per passenger in real terms while airfares –– Long, convoluted, resource-intensive negotiations that lack
decreased by almost 40%. transparency and professional conduct
–– Excluding airport charges and fuel, Qantas Group costs have –– Australian airports do not provide meaningful information to
fallen by 4% in real terms since FY15. assess financial performance and priorities to improve passenger
–– At the same time, Qantas Group charges paid to airports have experience – such as pricing methodologies, asset registers,
grown 6.5% above inflation. write-offs and depreciation or service levels for passengers.
–– Australian airports are more expensive than comparable –– Airlines are not able to compel transparency or seek meaningful
international airports in the United States and New Zealand – consultation – for example airlines are generally not consulted
Australian monopoly airports receive approximately AU$4.71 more by airports where new security services are implemented but are
per passenger than those in the United States, and AU$4.21 more simply notified of increased costs.
than New Zealand airports. A $4 reduction in airport charges paid –– Negotiations are therefore prolonged, convoluted and resource-
by each airline passenger would reduce airline costs by over $648 intensive – some current Qantas Group negotiations have been
million annually. This could fund millions of airfares, or support ongoing since 2011.
daily, non-stop B787 Dreamliner flights to 2 European cities. –– Australian airlines have no effective mechanism or regulatory
–– Monopoly airports earn profits from aviation security (e.g. stating circuit breaker to promote genuine negotiations with airports.
a right to collect a “reasonable return on capital investment”).
Security charges also fund revenue generating activities, in Effective light-handed regulation required
contrast with existing regulatory understanding that airports –– The current monitoring regime by the Australian Competition and
deliver only mandated aviation security, and pass-through costs Consumer Commission (ACCC) and the National Access Regime
to customers on a not-for-profit basis. under Part IIIA of the CCA are expensive, lengthy and ineffective
in constraining the market power of airports.
Airports do not bear the risk of passenger and cargo demand
–– Qantas Group supports an effective light-handed regulatory
–– Australian airports are shielded by airlines from economic
framework which includes:
instability – passenger volumes and airport margins have
–– Deemed declaration to incentivise commercial discipline and
increased steadily over the past 10 years while airline margins
efficient outcomes,
have been more volatile.
–– Regulatory guidance on WACC, taking account of risk-adjusted
–– Markets recognise this through lower rates for airport financing
– lenders regard airports as typically being below the weighted costs of capital,
BBB/A-rating cost of debt, assumed, for example, by the –– Efficient aeronautical pricing and airport leasing principles, and
Australian Energy Regulator (AER). –– Best practice conduct of negotiations.
6 Q A N TA S G R O U P S U B M I S S I O N — P R O D U C T I V I T Y C O M M I S S I O N I N Q U I R Y I N T O E C O N O M I C R E G U L AT I O N O F A I R P O R T S3. A Fresh Look at Airport Market Power
Qantas Group welcomes the Productivity Commission’s Inquiry into –– Aviation now contributes nearly 2.6% to Australia’s GDP every
Economic Regulation of Airports. year. Despite their growing importance as gateways to capital
cities and regional centres, there is no reliable measure of
This chapter seeks to address the question, ‘why now?’ and covers
Australian airport productivity.
key recent developments that underline the case for effective light
handed regulation to promote competition, stimulate travel and –– Airport negotiations have become overly long and resource-
deliver economic benefits to Australia. intensive. Some Qantas Group negotiations that commenced in
2011 are still continuing.
Twenty-two years ago, Australian airports began to be privatised.
Since then there have been tremendous changes in the aviation Australia is an end of the line destination with a relatively high cost
sector. The number of travellers and the volume of freight that base. It can no longer afford airport monopolies. Lack of innovation,
passes through Australian airports have more than doubled and efficiency and productivity gains puts Australia’s economic
continue to grow. wellbeing at risk.
Qantas Group agrees the first wave of airport privatisations in the The remainder of this submission follows the order of the
1990s sparked increases in efficiencies and productivity. But those information requests in the Productivity Commission’s in order to
gains have slipped in recent years. Today Australian monopoly demonstrate as per the figure below, that there is a sound rationale
airports present a clear threat to Australia’s economic wellbeing for effective intervention with a proposal that is better than other
and a strain on productivity. alternatives, including the status quo.
Recent developments Figure 1: Productivity Commission framework
to assess regulatory effectiveness
In its previous inquiry report in 2011, the Productivity Commission
said, “the regime would benefit from a credible threat” of sanction
Regulation to promote the efficient operation of airports
for airports that abuse their market power.(2)
Is there a rationale Is the current What is the How should
The ACCC has regularly reported its concerns and advocated for for government regulatory framework best policy it be
stronger regulation to contain abuses in airport market power.(3) intervention fit for purpose? option? implemented?
Unfortunately, inaction by successive governments has meant
those problems have escalated to unsustainable levels. Key Source: Productivity Commission Issue Paper, July 2018
developments include:
In this submission, relevant data and case studies are considered
–– Airfares have reduced by nearly 40% in real terms over the past that show persistent exercise and abuse of market power, through
decade.(4) In contrast, Australian monopoly airport charges are earning monopoly profits, charging above-market high prices,
growing – the 4 monitored airports alone earnt an average 25% providing variable quality of services and facilities, inefficient
more revenue per passenger in real terms.(5) operations and capital investments, and lack of transparency and
–– Aside from Australian monopoly airports, Australian aviation good faith conduct in negotiations.
is far more competitive today. In 2000, more than 1 in 3
international travellers flew into Australia on a red Qantas tail.(6) LACK OF COUNTERVAILING POWER
Today, that number is 1 in 6, with Jetstar responsible for nearly Australian airports are natural monopolies.
1 in 10 international arrivals last year. Airlines offer more travel
options, routes and airfares than ever before.(7) A passenger heading to Sydney, Canberra or Townsville may choose
their airline, airfare and class of travel but airlines have no choice
–– Airlines have been improving efficiency and productivity while
of airport.
airports are not. Excluding airport charges and fuel, Qantas
Group costs have fallen by 4% in real terms since FY15. At the The monopoly power of airports is amplified by the inelastic
same time, Qantas Group’s airport charges grew by 6.5% above demand for airport services and the lack of countervailing power
inflation. of airlines in negotiating terms and conditions that are fair and
–– Airport charges, levies and fees are now Qantas Group’s fourth reasonable.
largest cost after fuel, fleet and people. Further, the current light-handed regulatory approach does little
–– Australian airport charges, levies and fees are an anomaly to ‘level the playing field’ in commercial negotiations. In the
in a competitive economy. Other monopolies such as latest Airport Monitoring Report of the 4 largest airports– Sydney,
telecommunications, utilities, transmission networks and rail Melbourne, Brisbane and Perth – the ACCC concluded (emphasis
networks have been far more scrutinised than airports in recent added):
years.
–– The current regime provides little oversight of the major airports “It is generally accepted that Australia’s four major airports
– and no oversight of smaller airports. have market power and control access to monopoly
infrastructure. As a result, there is a concern that at some
airports, airlines do not possess enough bargaining power
to ensure appropriate commercial outcomes.” (8)
Q A N TA S G R O U P S U B M I S S I O N — P R O D U C T I V I T Y C O M M I S S I O N I N Q U I R Y I N T O E C O N O M I C R E G U L AT I O N O F A I R P O R T S 7In Qantas Group’s experience, Australian monopoly airports If airlines’ countervailing market power was genuinely effective,
have entrenched their market power further because it is almost Qantas Group would not spend considerable time and resources to
impossible for airlines to access independent arbitration under the undertake protracted and expensive negotiations with airports or
National Access regime. to resort to seeking government assistance for reasonable access
to Australian monopoly airports’ facilities. Indeed Qantas Group
Unfortunately, Qantas Group has observed abuses of market power
would not now be seeking recommendations from the Productivity
at all Australian major airports and many smaller ones. Suggestions
Commission for effective light-handed regulation.
that airlines have the requisite countervailing power or even a
capacity to exercise market power through withdrawing services Qantas Group cannot force an airport to seek independent dispute
are misguided. resolution on prices and contract terms, while airports are not
motivated to engage in a process that threatens their high returns.
If Australian monopoly airports are genuinely concerned about
The cost, time and uncertainty associated with the current
airlines exercising market power, it begs the question: why are
declaration provisions in the National Access Regime make it
airports so steadfastly and ubiquitously opposed to greater access
ineffective for resolving such disputes.
to independent arbitration to make light-handed regulation more
effective?
Impacts on network, service and competition
Airlines today have arguably less power to cease or postpone Qantas Group needs to maintain a wide network of routes and
capacity or flights to monopoly airports than they did during the frequencies to serve its customers, maintain a strong competitive
last Productivity Commission inquiry in 2011. Airlines are mature position, deliver sustainable returns to shareholders and connect
businesses that must offer customers a network of major and regional communities.
regional airports.
Sydney, for example, is a critical Qantas Group market with dense
As A4ANZ states in its report of airports’ market power, volumes of business and leisure demand. Reducing capacity at
Sydney in response to high airport charges would erode Qantas
“… a necessary condition for countervailing power is that Group’s value proposition to its customers who value its service
airlines have a credible option to cease or postpone their offering.
purchase, or take up other ‘outside alternatives.” (9)
Similarly Jetstar is geared towards serving leisure customers, who
want to travel to Australia’s largest cities and tourism destinations
‘Take it or leave it’ approach by airports like Cairns and the Gold Coast. Neither Qantas nor Jetstar have the
The prospect of countervailing power in this inquiry will be squarely ability to meaningfully reduce their networks without materially
directed at Qantas Group. impacting competitive relevance.
Qantas Group resists unreasonable terms of access resulting from To argue that the Gold Coast and Cairns Airports, or indeed
opaque negotiations offered by Australian monopoly airports. Adelaide, Darwin and Newcastle airports lack market power is a
Qantas Group seeks to mitigate some of the worst excesses of flawed assumption as it overlooks the fundamentals of aviation
airports and consequently advocate on behalf of its customers and networking.
often deliver benefits for all airlines.
Qantas Group operates in one of the most liberal domestic markets
With a history of leading developments in global aviation for and most competitive international markets in the world. If Qantas
almost 100 years, coupled with its size, in-house capability and Group were to reduce capacity, there is a high likelihood that a
connectivity of its domestic network, Qantas Group works tirelessly competitor would seize the opportunity to fill the void. While Qantas
to achieve outcomes that are fair and reasonable. Group has a high share of domestic capacity, this has declined in
recent years due to competition.
In many instances, Australian monopoly airports have a
predetermined profit requisite and will not shift unless this profit Australia is one of the only countries in the world which allows
condition is met. These airports refuse to move on excessive rate foreign entities to establish a domestic airline. For example, in
of return assessments and seek to unilaterally impose prices when 2007, Singapore-based Tiger Airways Holdings launched Tiger
agreements expire. Airways in the Australian domestic market. In the international
market, Qantas Group share has also declined as competitors
Under the current ineffective regulatory regime, the only leverage
from China, the Middle East, and the Americas continue to
an airport user has is the possibility of withdrawing services from
increase their capacity.
an airport. In reality, airlines cannot afford to make good on that
possibility for reasons including loss of network connectivity, loss Unlike some international markets, Australian cities do not have
of business, claims by passengers with bookings, loss of revenue, multiple public airports. Substituting modes of transport for
redundancy of aircraft assets, redundancy of airport investments travelling between major cities is also unrealistic. Therefore,
such as hangar and lounges, and competition from other entrants. competition between airports and destination substitution is not
8 Q A N TA S G R O U P S U B M I S S I O N — P R O D U C T I V I T Y C O M M I S S I O N I N Q U I R Y I N T O E C O N O M I C R E G U L AT I O N O F A I R P O R T Srelevant in the Australian market. Australia does not enjoy the Airlines bear volume risk
short distances and modal choices between cities, nor choice of Airlines bear the risk of generating passenger and cargo demand,
airports in Europe, Asia, China and the United States. Nor do airlines competition and external market factors. Airports do not share in
enjoy the density of population that permits the substitution of that risk – they only benefit from airlines’ stimulation of passenger
passengers from one city for those in another. Qantas Group has demand. The evidence since 2011 demonstrates this systemic
invested in a fleet to compete for a share of the whole population, volatility and strengthens the case for improvements.
not only those who live in a city with a reasonably-priced airport.
To service such massive, long-term capital commitments airlines
To assert Qantas Group could stop flying to Adelaide, Darwin or must maintain passenger throughput by the use of tactics such as
Newcastle if airports set their charges too high, overlooks the discounted airfares. Airports however, maintain their charges as
importance of these markets to our passengers, and our obligation the airport is insulated from the passenger risk by the tactics of
to offer a comprehensive national network with seamless the airlines. Australian monopoly airports have no competition or
connectivity to the Australian community. market pressure to discount aeronautical service charges.
Since most of Qantas Group’s network has significant strategic The figure below highlights the volatility in airline margins against
imperatives (including connecting trunk routes and international a backdrop of Australian monopoly airports’ super-profits and a
routes that allow greater frequencies and more destinations) its steady increase in passenger volumes despite economic shocks
ability to use capacity as leverage in airport negotiations is limited. such as the Global Financial Crisis.
To suggest Qantas Group cease operations to a whole state or
territory of Australia, should a dispute with an airport arise, is
nonsensical.
Figure 2: Volatility in airline margins
Volatility in the airlines 50% 180
9/11 Attack & GFC
industry has hit airline Ansett Collapse
152 158
margins significantly, 143 147 149
while airports margins 40% 135 137 144
127
have remained high given 120 122
112
increasing passengers. 30% 99
104 108
88
Passengers (000s)
82
EBIT Margin (%)
75 78
71 75
20% 72
10% 36
0% 0
-30%
Source: ABS, ACCC Airport 1999 2000 2001 2002 2003 2004 2005 2006 2007 2008 2009 2010 2011 2012 2013 2014 2015 2016 2017
Monitoring Report, BITRE,
Annual Reports
QF Profit Margin VA Profit Margin Airport Profit Margin Passenger Volumes
Q A N TA S G R O U P S U B M I S S I O N — P R O D U C T I V I T Y C O M M I S S I O N I N Q U I R Y I N T O E C O N O M I C R E G U L AT I O N O F A I R P O R T S 9Indeed, Melbourne Airport and Sydney Airport affirmed their lower Investors agree airport revenue unrestrained
risk to financial institutions: The significant and ongoing returns generated by Australia’s
private and council-owned airports through growing revenue
“Our passenger numbers and EBITDA have increased on streams with higher prices and largely unregulated revenues from
an annual basis since the privatisation of Sydney Airport non-aeronautical assets have seen them become particularly
in 2002 to 31 December 2017, including in periods of attractive investment assets.
challenging economic and operating conditions, such as
the global financial crisis, the European sovereign debt “Sydney Airport has an unregulated revenue stream in a
crisis, the SARS outbreak, the Ebola outbreak, ongoing monopoly environment. This is a key reason why it trades at
geopolitical conflicts and acts of terrorism.” (10) a premium multiple to global peers.”
–Sydney Airport, 2018 – UBS, July 2018, Global Airports –
Trends and prospects for traffic growth, retail and regulation
“Melbourne Airport’s passenger numbers have stayed
Apart from Sydney Airport, none of the other Australian
resilient in the face of strong adverse shocks to both the
monopoly airports are publicly traded assets on the Australian
demand and supply for air travel, and it has typically seen
Stock Exchange. Since privatisation, there has been a growing
recovery of passenger numbers and a return to passenger
concentration of ownership of Australian airport assets among a
number growth within 12 months of the adverse shocks.” (11)
select group of major institutional investors.
– Melbourne Airport, 2017
For example, the largest and second largest airports in the Northern
Territory, Darwin Airport and Alice Springs Airport, are owned by
“Brisbane Airport Corporation (BAC) believes that the same investment funds.(15) Appendix 1 further illustrates the
consistency in passenger number growth rates have high degree of concentration in relation to the 21 federally leased
supported the stability of BAC’s revenues and cash airports and 9 largest airports which are not federally leased.
flows, including during the global financial crisis and the
European sovereign debt crisis. Between FY12 and FY17, In the absence of meaningful regulatory change, the trend towards
BAC’s passenger numbers demonstrated consistent increased consolidation of ownership will continue to erode the
growth despite a severe deterioration in the global already limited leverage airlines hold in commercial negotiations,
economic environment.” (12) exacerbate uncompetitive dealings and negatively impact the
economy.
– Brisbane Airport, 2018
The Airports Act 1996 imposes a 15% restriction on the cross-
Also in a 2013 report for the Civil Aviation Authority (CAA) of the ownership of any pair of Australia’s 4 monitored airports. Qantas
United Kingdom, Cambridge Economic Policy Associates (CEPA) Group notes that several institutional investors today own a 15% or
discussed the fact that reducing volume risk would imply lower higher stake in at least 2 capital city airports.
exposure to systematic risk and produce a lower equity beta.(13)
PwC Economics also highlights the lower systematic risks for
airports with lower exposure to passenger volume changes to
it in their November 2017 report on the WACC range for London
Heathrow Airport for the CAA. The New Zealand Commerce
Commission has previously made ad hoc adjustments to risk,
namely to its sample asset beta for differences between the New
Zealand airports and the sample.(14)
The pattern of debt issuance to Australian monopoly airports shows
risk-based price adjustments by lenders have also substantially
lowered airports’ cost of capital. In the next chapter, Qantas Group
presents detailed evidence of the lower risks borne by airports
which in turn lower the cost of financing airport assets.
However, airports continue to propose and impose pricing models
built on the assumption that airports take passenger and cargo
volume risk. A more accurate understanding of the lack of
volume risk borne by airports, should be taken into account by the
Productivity Commission when considering financial benchmarks.
10 Q A N TA S G R O U P S U B M I S S I O N — P R O D U C T I V I T Y C O M M I S S I O N I N Q U I R Y I N T O E C O N O M I C R E G U L AT I O N O F A I R P O R T S4. Aeronautical Services and Facilities
This chapter presents detailed evidence of monopolistic behaviour MONOPOLISTIC BEHAVIOUR
by a range of Australian airports and the negative effects Australia’s current light-handed approach to the economic
and impacts of this behaviour and in doing so, addresses the regulation of airports is based, in part, on the assumption that
Productivity Commission’s Information Request 2. Australian airports do not have significant market power.
It also discusses why the current regulatory regime is limited in The evidence suggests otherwise.
identifying abuses of market power and ineffectual in restraining
the monopoly behaviour of the major Australian airports In its Issues Paper, the Productivity Commission similarly notes
(Productivity Commission’s Information Requests 3, 4, 7 and 8). that examples of how airport operators could exercise market
power, include:
Finally, it suggests effective light-handed regulation is needed to
improve commercial negotiations with and the competitiveness of –– excessive fees or charges for aeronautical services,
Australia’s monopoly airports, as well as articulating key benefits of –– inefficient investment decisions,
change (Productivity Commission’s Information Requests 5 and 9). –– inefficient operation,
Qantas Group endorses the submission by A4ANZ which provides –– providing services of a low quality or a limited range, and
an economic- and industry-wide analysis of airports’ market –– the manner in which they conduct commercial negotiations.
power in aviation services and infrastructure, proposes potential
remedies to improve outcomes for the economy and community Although not an exhaustive list of behaviours, this chapter presents
and assesses the costs and benefits of current and new regulatory a range of evidence and analysis to demonstrate exercise and
approaches. impact of market power on passengers, airlines and the economy.
To support this chapter, Qantas Group has undertaken the following:
Excessive airport fees, charges and returns
–– commissioned independent economic analysis by CEPA to Airfares in Australia fell by 42-52% between 2008 and 2017,
estimate and compare airports’ cost of raising capital, which in reflecting improvements in airlines’ efficiency, passenger growth
turn drives the prices they seek to charge, and greater competition.(16)
–– conducted new and original analysis to understand the impact
Airport passenger charges paid on the average airfare to fly from
of airport costs at a route and network-wide level, and compare
Australia’s airports increased by 15-59% over the same period.(17)
these to relevant international markets, and
–– provided evidence on airport negotiations with airports that The monitored airports are collecting 25% more aeronautical
display monopoly behaviours (such as protracted timelines and revenue per passenger in real terms compared to a decade ago.(18)
excessive rates of return) and outcomes (high cost destinations) Airport charges per passenger are rising, not moderating in line
consistent with exercise and abuse of market power. with passenger volume increases and movements in interest and
A portion of the evidence has been provided confidentially for government bond rates. This is true for Sydney Airport, Melbourne
contractual and/or commercial reasons. Airport, Brisbane Airport and Perth Airport – and many major and
regional airports.
Global comparators
Sydney Airport, Melbourne Airport and Brisbane Airport are in the
top 5 most profitable airports in the world.
Against a 2015 global average EBITDA of 55%, Sydney Airport’s
margin was 83%, Melbourne Airport’s margin was 75%, Brisbane
Airport’s margin was 74% and Perth Airport’s margin was 66%.(19)
Q A N TA S G R O U P S U B M I S S I O N — P R O D U C T I V I T Y C O M M I S S I O N I N Q U I R Y I N T O E C O N O M I C R E G U L AT I O N O F A I R P O R T S 11The figure below demonstrates Sydney, Melbourne, Brisbane and Perth Airports all derive more profit than airports in Singapore, Heathrow,
Dubai, Dallas and Los Angeles, all of which have greater economies of scale and have greater substitutes in close proximity.
Figure 3: International airport profitability by size
80
Dual till
AKL Single till
Hybrid
MEL Aero only
60 SYD
BNE $1bn Revenue
PER
HKG
EBIT Margin (%)
BNE SYD
MEL SIN
40 CPH
LHR2
PER YYZ
ATL
AMS LAX
LGW2
FRA1,2
DEL ORD
DUS2 MSP
20
DUB DFW
Indian airports recently US airports government
switched from single till owned with tight
to hybrid approach regulation on fees
0
0 5 10 15 20 25 30 35 40 45 50 55 60 65 70 75 80 85 90 95 100 105 110 115
Passengers Volumes (m)
Healthy, profitable and competitive businesses are essential for a shielded from the downside through the airlines adjusting their
well-functioning economy. However, such above-market profits, fares. This is a fundamental flaw in the regime as the evidence
combined with high charges, inefficiencies and variable levels of below demonstrates. Airports should, therefore, attract lower rates
service, indicate unrestrained monopoly power at work. of return as they are lower risk investments. In Qantas Group’s
experience, airports calculate charges on the incorrect assumption
Lower risk should mean lower rates of return that they bear passenger risk and so set artificially high rates of
Airlines in Australia have shielded airports from economic and return. This risk profile is also reflected in the debt issuance costs
demand volatility, as the previous chapter demonstrates. for Australian airports.
A key input in the calculation of airport passenger charges is Qantas Group provided CEPA with the 4 monitored airports
a passenger forecast for the agreement period. To the extent estimated new debt issuance cost for the last 5 years, which covers
passenger numbers fluctuate through the period, the airport around 50% of Sydney Airport’s and Brisbane Airport’s debt, and
faces asymmetric risk as it benefits from the upside but is largely over 70% of Melbourne Airport’s and Perth Airport’s debt.
12 Q A N TA S G R O U P S U B M I S S I O N — P R O D U C T I V I T Y C O M M I S S I O N I N Q U I R Y I N T O E C O N O M I C R E G U L AT I O N O F A I R P O R T SThe figure below plots this against the RBA data on BBB and A-rated non-financial corporate debt that CEPA used for cost of debt
estimates. The debt data covers a range of currencies, amounts and tenors (the tenors range from 7 years to 20 years).
Figure 4: Monitored airports’ debt issuance compared to RBA non-financial corporate bond yield data (10-year average tenor)
18%
16%
14%
12%
BBB-rating
10%
8%
6%
4%
Weighted BBB/A -rating
2%
0%
June June June June June June June June June June June
2008 2009 2010 2011 2012 2013 2014 2015 2016 2017 2018
Sydney Airport Brisbane Airport Perth Airport Melbourne Airport
Source: RBA, Qantas Group, Monitored Airports annual reports.
The graph indicates historic debt issuance costs by these airports Impact of super-charged profits
has typically been below the weighted BBB/A-rating cost of debt The ACCC has reported the aeronautical asset base of the 4
(an approximation of the BBB+ investment grade), assumed by the monitored airports – Sydney Airport, Melbourne Airport, Brisbane
Australian Energy Regulator (AER) for regulated entities. Airport and Perth Airport – to be over $8 billion.
Although the evidence – including statements made by the airports Therefore, each single percentage point increase in WACC above
themselves – confirms strong growth in passengers even under reasonable benchmarks is the equivalent of $80 million in higher
adverse economic conditions, airports are yet to agree to reflect charges to passengers and airlines every year at these 4 monopoly
this risk profile in their return expectations and financial pricing airports alone.
model they present to airlines.
Qantas Group suggests effective light-handed regulation would
To highlight the challenges around WACC discussions, analysis of promote commercial negotiations that are more conducive to
a sample of 12 airports (mix of majors and smaller), all of them alternative or innovative pricing and risk-sharing models. These,
initially targeting rate of returns between 10 and 15% (pre-tax in turn, would discipline excessive charging and promote more
nominal WACC). These inflated return targets indicate widespread efficient investments in passenger facilities.
monopolistic ‘take it or leave it’ behaviour by Australian airports
which also prolongs airport negotiations.
Q A N TA S G R O U P S U B M I S S I O N — P R O D U C T I V I T Y C O M M I S S I O N I N Q U I R Y I N T O E C O N O M I C R E G U L AT I O N O F A I R P O R T S 13Excessive charges Airport charges out of step with international comparators
Airport monopoly profits are a direct result of excessive charges, Australian monopoly airports are significantly more expensive
levies and fees for every facility or service provided including than their counterparts in most other regions, and airport-related
airport charges, security charges and lounge facility charges. expenses contribute a greater portion of overall airline costs for
Australian carriers than for foreign carriers.
This section presents data to demonstrate that Australian airport
charges contribute a large and growing proportion of domestic On average, Australia’s 5 busiest airports charge airlines and their
airfares and route costs. It also shows that charges at monopoly passengers more for use of aeronautical facilities and services
Australian airports are higher than key international competitor than counterparts in the United States and closer to home, in New
airports. Zealand.
Analysis of a sample of the 5 busiest airports across the
3 countries shows that Australian monopoly airports earn
approximately AU$4.71 more per passenger than those in the
United States, and AU$4.21 more than New Zealand.
Figure 6: Comparison of aeronautical revenue per passenger
Australia United States New Zealand
Airport $ (AUD) Airport $ (USD) Airport $ (NZD)
Sydney (SYD) $18.30 Atlanta (ATL) $4.51 Auckland (AKL) $13.43
Melbourne (MEL) $12.40 Chicago (ORD) $8.25 Christchurch (CHC) $13.04
Brisbane (BNE) $12.60 Los Angeles (LAX) $10.74 Wellington (WLG) $11.78
Adelaide (ADL) $15.80 Dallas (DFW) $5.90 Queenstown (ZQN) $12.38
Perth (PER) $12.60 Denver (DEN) $6.04 Dunedin (DUD) $5.34
Average (AUD) $14.34 Average (AUD) $9.63 Average (AUD) $10.13
Variance from Australia sample: -$4.71 -$4.21
Source: Airport Annual Reports 2016/17. FX rates are 1 USD = 1.3582510 AUD, 1 NZD = 0.905272564 AUD (23 August 2018)
14 Q A N TA S G R O U P S U B M I S S I O N — P R O D U C T I V I T Y C O M M I S S I O N I N Q U I R Y I N T O E C O N O M I C R E G U L AT I O N O F A I R P O R T SA $4 reduction in the airport charges paid by each airline passenger Qantas Group compared airport costs as a percentage of airline
would reduce the cost burden by over $648 million annually.(20) As revenues for major Australian (Qantas Airways Limited and Virgin
airlines operate in a highly competitive environment, a substantial Australia Holdings), United States (Delta Airlines, American Airlines,
portion of this benefit would be passed on to passengers and United Airlines and Southwest Airlines) and European carriers
consumers. (British Airways, Iberia, Air France/KLM) (see figure below).
Airfares have halved over the past decade globally while
Figure 7: Airport Expenses as % of Airline Revenue
connectivity has doubled to 21,000 city pairs and passenger
numbers have increased.
To illustrate, a $648 million reduction in Australian monopoly
airport charges, levies and fees could fund the equivalent of: 14%
–– 6.75 million one-way airfares between Melbourne and the Gold 9%
6%
Coast based on average ticket cost of $96,
–– 1.8 million one-way airfares between Sydney and Perth based on Australia European Union United States
average ticket cost of $346, or
–– 1.6 million one-way airfares between Sydney and Auckland based Source: Airline Annual Reports, FY17.
on average ticket cost of $400. Note: Data estimates % of revenue by cost bucket. Inclusions and exclusions
within cost areas may vary by airline.
Savings in airport charges are also highly likely to lead to
While these airports vary in size and quality of services, it is clear
investment in fleet renewal and growth leading to capacity growth
that Australian airport charges appear to be disproportionally high.
and fuel/operational efficiency.
The mix of international airports in the comparator set is broad,
A $4 reduction would fund additional Boeing 787 Dreamliners, therefore it is unlikely this disparity is driven by economies of
which, would allow daily services to at least 2 new cities in Europe scale/size or by quality differences.
from Perth or open new and exciting destinations in North or South
This disparity in airport charges is more stark when compared with
America(21) to provide the Australian community with more travel
the greater consistency of the cost base of the same international
options.
airline cohort (see figure below).
Figure 8: % of revenue by cost bucket for major AU (QAG, VAH), US (DL, AA, UA, WN), and EU (BA, IB) airlines
Australian aviation has significant higher
30.2 rent and landing fee charges than other airlines AU
US
EU
24.9
22.0
20.4
18.5
17.6
15.5
14.3 14.4
13.5
12.1
10.2
9.0 9.0
8.0
6.1 5.9
5.1 5.6 5.5
5.1 5.0
4.5
3.9 3.7 3.7
3.3
1.7 1.3
0.0
Manpower/staff Fuel Maintenance Airport rent and Aircraft Selling cost Depreciation and Capacity Other EBIT
landing fees leasing costs Amortisation purchase
Source: Airline Annual Reports, FY17.
Note: Data estimates % of revenue by cost bucket. Inclusions and exclusions within cost areas may vary by airline.
Q A N TA S G R O U P S U B M I S S I O N — P R O D U C T I V I T Y C O M M I S S I O N I N Q U I R Y I N T O E C O N O M I C R E G U L AT I O N O F A I R P O R T S 15Inconsistency in airport fee structures There have been numerous calls for Qantas Group to deploy Jetstar
Charges levied by airports bear little relation to passenger volumes, on regional routes to reduce airfares. While Jetstar can and does
geography, type of traffic or level and quality of services and offer low airfares to consumers, its ability to do so is driven by its
facilities. The only discernible pattern is a quest for excessive lower variable and fixed costs. This operating model is problematic
returns by Australian monopoly airports. on regional markets in Australia due to high input costs such
as monopoly airport charges, fuel levies, inefficient operating
Airports charge airlines aviation charges, levies and fees for use of patterns, regional maintenance costs, and accessibility.
their facilities and associated services (runways, taxiways, aprons,
terminal, navigation, and security, etc.). These charges are broken It is difficult to explain or justify the significant pricing disparity
into 3 different components: between ports with similar passenger numbers and similar
markets. For example, Canberra Airport and Adelaide Airport
–– Passenger Service Charge (PSC) – usually paid by arriving and are often used as comparable airports due to their capital city
departing passengers, standing, relatively small international presence and similarity in
–– Landing Charge (LC) – usually based on maximum take-off passenger numbers. But the passenger charge differential between
weight (MTOW) of aircraft in tonnes, and these 2 airports is extraordinary. Canberra Airport currently
–– Security Charge (SC) – usually based on departing passengers. charges (including security charging) over 200% more than
Adelaide Airport.
Across the Australian monopoly regional airports that Qantas Group
operates, there is a wide variation in all 3 of the above charges with Similarly, when comparing the major international airports in
higher airport charges having a significant impact into the price Australia, there is no evident pattern explaining the significant
of travel for consumers as well as the commercial viability of air disparity in airport charges. Fixed costs would be expected to
services. It is unclear why there is such a significant variation in the decline as volumes increase but this does not appear to be the case
level of airport charges, particularly when comparing Southern and at Australian monopoly airports.
Northern Australia.
Impact of excessive charges on airfares
When comparing regional airports in Australia with fewer than Last year, Townsville Airport, ran a poster campaign stating its $80
500,000 passengers per year, the average cost per passenger million redevelopment was possible for ‘less than a cup of coffee’
(excluding security) is $16 for airports in the southern regions of for passengers. This inaccurate publicity campaign was designed
Australia (NSW, Victoria, South Australia, Tasmania) and $25 for to publicly pressure Qantas Group airlines.
airports in Queensland, Northern Territory and Western Australia
- over 50% higher. Moreover, 13 of the top 15 most expensive It fuelled an incorrect perception that airport charges have
monopoly airports in Australia that Qantas Group flies to fall within relatively limited impact as a proportion of airfares.
Queensland and Western Australia. Across the globe, airlines make an average net profit of $7.76 per
Examples of the impact of these charges, based on a return Dash-8 passenger. In FY18, Qantas Group posted stronger results with a
Q400 service with 60 passengers (pax) and 81% load factor are margin of $10.50 on every $100 it received in revenue.
outlined below: (22) Sydney Airport earns the highest margin of any airport in the
sample shown (more than $50 of every $100 earned contributes to
profits), and Brisbane Airport and Melbourne Airport are both in the
Southern Airport Example top 5.(23)
Inbound: $960 Most increases in airport charges directly affect the sustainability
($16 PSC * 60 pax) + ($0 LC * 60 pax) + ($0 SC * 60 pax) of a route and an airline’s ability to maintain frequency and
capacity, while offering low airfares. Data released monthly by
Outbound: $1,035 the Bureau of Infrastructure, Transport and Regional Economics
($16 PSC * 60 pax) + ($0 LC * 60 pax) + ($1.25 SC * 60 pax) (BITRE), shows domestic sale airfares in Australia are on average
39% lower today in real terms than they were fifteen years ago.(24)
Total Cost: $1,995
Jetstar sold more than 24 million airfares below $100 last year.
The difference between a $9.05 (at Airport A) and a $26.99
(at Airport B) airport passenger charge (including security),
dramatically influences the ability of an airline to maintain
Northern Airport Example frequency and capacity, while offering low airfares and stimulating
travel. Adding other cost inputs of the operation such as fuel,
Inbound: $2,460 pilots, cabin and ground crew, maintenance and navigation charges
($30 PSC * 60 pax) + ($11 LC * 60 pax) + ($0 SC * 60 pax) demonstrates the significant and direct impact airport charges
have on the commercial viability of airline services.
Outbound: $2,640
A Qantas domestic one-way airfare from Sydney to Hobart is now
($30 PSC * 60 pax) + ($0 LC * 60 pax) + ($14 SC * 60 pax)
on average 51% cheaper and an international one-way airfare from
Total Cost: $5,100 Sydney to London is now on average 57% lower.(25) Qantas Group’s
commitment to becoming a leaner business through sustainable
transformation in the face of increasing jet fuel prices has enabled
it to lower airfares on its regional, domestic and international
networks and deliver an enhanced customer experience.
16 Q A N TA S G R O U P S U B M I S S I O N — P R O D U C T I V I T Y C O M M I S S I O N I N Q U I R Y I N T O E C O N O M I C R E G U L AT I O N O F A I R P O R T SLow-cost airlines experience significant difficulty in entering new Excessive, above market airport leases
markets where airport charges are high. For Jetstar, this makes Monopoly airport behaviour extends to high, above-market rental
operating prospects to an expensive airport such as Canberra costs for essential facilities, such as hangars, jet bases, terminal
untenable. leases and staff car parking facilities.
Canberra Airport has publicly implored Jetstar to commence flying Qantas Group leases 1.3 million square metres at Brisbane Airport,
to the nation’s capital, stating, Melbourne Airport, Sydney Airport, Canberra Airport and Perth
Airport (including domestic terminal leases).
“It’s the largest route that doesn’t have a low-cost carrier
on it in the Australian market.” (26) A thorough market evaluation of the leased facilities, conducted in
June 2018 (provided on a confidential basis), estimated that Qantas
At current rates, however, Canberra Airport’s charges could Group is currently paying significantly more than comparable
account for up to a third of Jetstar’s low prices and would distort market rents.
the airline’s underlying cost base on the route. Jetstar has even This gap is prior to any anchor tenant or bulk letting discount which
implemented a codeshare arrangement with Murrays Coaches on would be materially more in a normal competitive market and is
its Canberra-Sydney route. The total bus fare was cheaper than commercially reasonable for Qantas to seek at each port or with
Canberra Airport’s charge but customer take-up has been poor. each airport head lessee.
Between January 2016 and August 2018, a total of 74 seats have
been sold, which equates to just 2.3 seats a month, highlighting the The valuation report states:
lack of countervailing power through modal substitution.
“An issue which goes to the prospect of monopoly rent
Examining route-specific airports costs setting (and lease term and condition setting)at airports
Qantas Group analysis of cost components shows Australian which has made it difficult to establish on-airport market-
monopoly airports can be the largest contributor to the cost of based rentals at all ports since the Commonwealth
operating a route. Government’s sell-off of the 99 year head (concurrent)
leases of the airports in Australia is the fact that a number
Box 1: Route Costs – of subleases, since the sell-off of the airport head leases,
Jetstar Airways Capital City A to Capital City B have been struck where the rental valuation or rental
setting guidelines or directives that existed within the
Airport charges including take-off and landing fees and previous Federal Airports Corporation leases have been
passenger facilities charge, contribute 17% of the estimated removed or amended. Lease terms and conditions offered
cost of flying a passenger on a flight between Capital City A are also often onerous.”
to Capital City B.
The Federal Airports Corporation lease rental valuation guidelines
These airport charges account for the second largest cost sought to mitigate the exercise of monopoly power by requiring that
incurred by Jetstar on this route. market rentals consider off-airport rental evidence. For example,
one of Qantas Group’s ground leases at Brisbane Airport comprises
Jetstar Airways – Capital City A to Capital City B an older lease, including the Federal Airports Corporation site rental
valuation guidelines. It includes statements such as:
20% 17% 5% 58%
“the primary source of evidence shall be the rents off
airport except where rents on airport are recently derived
Fuel Airport Charges Security Screening & Taxes Other and sourced off airport.”
The historic rent setting guidelines could have been seen to
Box 2: Route Costs – attempt to avert the logic of monopoly rents in on airport tenancies.
Qantas Airways Capital City C to Capital City D Their progressive removal from on-airport leases is further
evidence of unrestrained monopoly power.
Airport charges including take-off and landing fees and In light of this evaluation, Qantas Group is considering its options
passenger facilities charges contribute 34% of the estimated for lease renegotiations with these airports, however past
cost of flying a passenger between Capital City C to Capital experience suggests a low or limited chance of success.
City D
More effective light-handed regulation would introduce greater
These airport charges account for the single largest cost commercial discipline into leasing arrangements with the potential
incurred by Qantas on this route. to reduce costs for airport users and their customers.
Qantas Airways – Capital City C to Capital City D
34% 11% 1% 54%
Airport Charges Fuel Security Screening & Taxes Other
Q A N TA S G R O U P S U B M I S S I O N — P R O D U C T I V I T Y C O M M I S S I O N I N Q U I R Y I N T O E C O N O M I C R E G U L AT I O N O F A I R P O R T S 17You can also read