QE Visualizations as Tools for Thinking - Simon Buckingham Shum - ICQE 2020
←
→
Page content transcription
If your browser does not render page correctly, please read the page content below

Keynote, 2nd International Conference on Quantitative Ethnography www.icqe20.org

QE Visualizations
as Tools for Thinking
Simon Buckingham Shum
Professor of Learning Informatics
Director, Connected Intelligence Centre
University of Technology Sydney

cic.uts.edu.au • Simon.BuckinghamShum.net • @sbuckshum
The bring + share meal that is QE!

https://unsplash.com/photos/y1XXWct5rBo
Overview…
  How my academic journey primed me for QE
  Confession: I have been a participant observer!
  Visualizations as cognitive artifacts
  Observations of how QE (ENA) stories are told
  The future may be a more participatory QE
  à New kinds of visualizations, interactivity
  à New fluencies to wield participatory visual tools
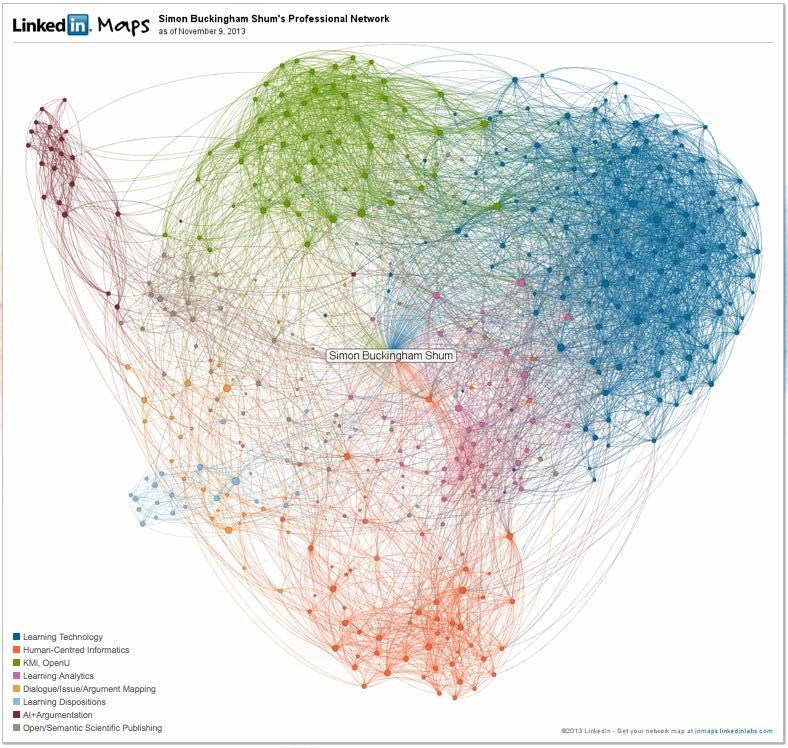
Visualizing my
communities
LinkedIn Maps (2013)

                       4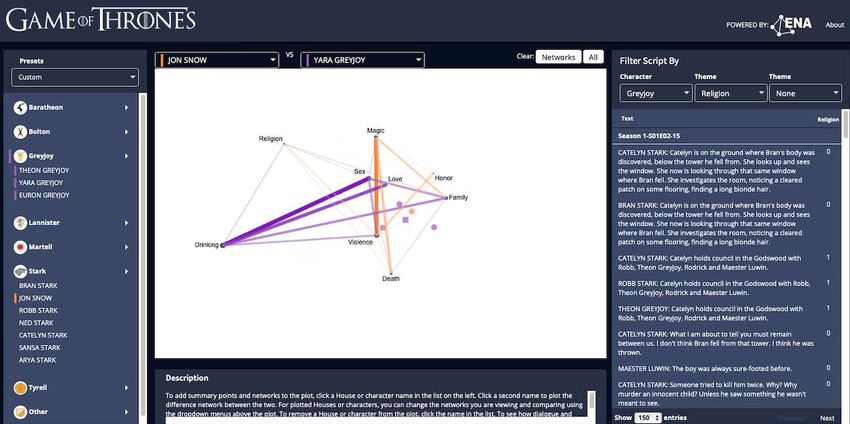
My journey with various research tribes…
B.Sc. Psychology à M.Sc. Ergonomics (à Cognitive Ergonomics)
Ph.D. Human-Computer Interaction (visual design rationale + cognition)
Hypertext/Semantic Web (spatial metaphors; scholarly hypertexts)
Dialogue & Argument Visualisation (Making deliberation visible, and contestable)
Learning Technology (critical thinking; synchronous groupware; open education)
Data Science/Learning Analytics/AIED (critical reflection; teamwork; dispositions; ethics)
Quantitative Ethnography (beginner; keen observer!)                                          5
This journey primed me for QE…

“Augmenting human intellect”
with interactive tools
…Douglas Engelbart’s pioneering 1960s
work is my inspiration

                                            http://simon.buckinghamshum.net/2014/07/openu-valedictory-lecture

à a fascination with how software
helps make thinking visible
…and how thinking is shaped by
(semi)formal, interactive representations                                                                       6
This journey primed me for QE…
A passion for research-inspired,
open source tools for researchers,
and other knowledge workers…
…co-building and supporting a
user community for >20 years
…in service of participatory
sensemaking

http://simon.buckinghamshum.net/tag/compendium
                                                                                 7
http://projects.buckinghamshum.net/compendiuminstitute/community/community.htm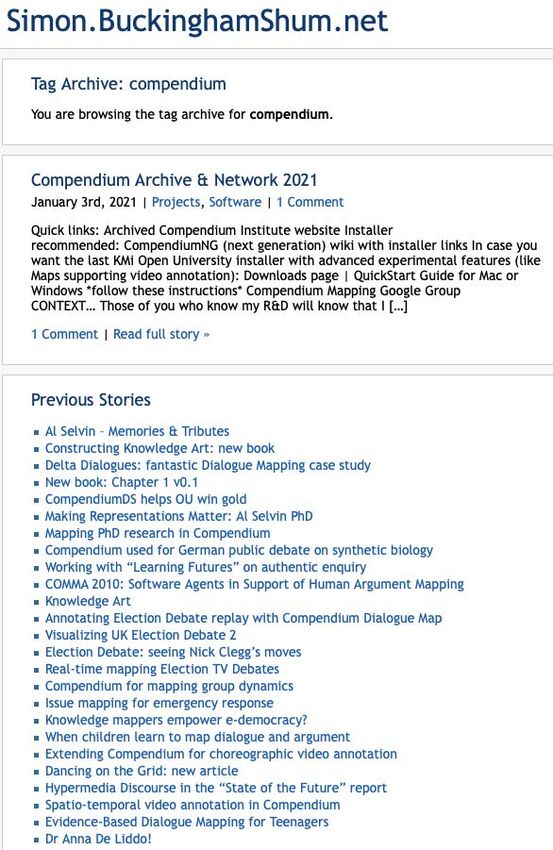
Supporting a user community for >20 years
A tool, method + practice for participatory, visual, networked thinking

                                                                          8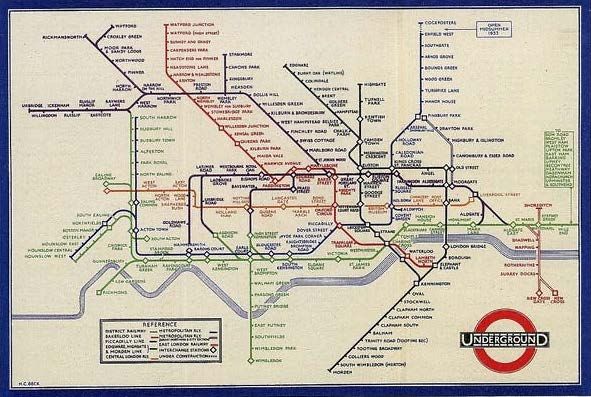
Compendium as a science sensemaking tool
NASA Field Trials (Mobile Agents Project)
http://projects.buckinghamshum.net/NASA_EPSRC_Mars/

                                                      9
Visualizations as
Tools for Thinking
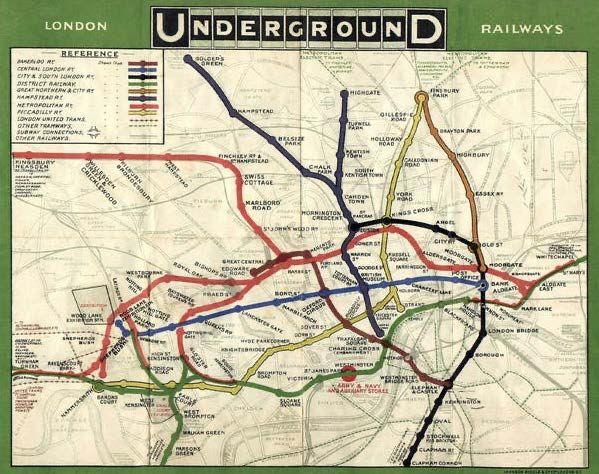
10Example visualization: London Underground Map https://theconversation.com/sublime-design-the-london-underground-map-26240 11
Example visualization: London Underground Map

ontology       typed nodes (stations), typed
               connections (lines)
data           The Tube; The River Thames!

notation       “wiring diagram” optimized for
               route-tracing (horiz, vertical,
               45deg) at expense of geog.
               accuracy
interactivity filtering and route planning apps   12
But what are a visualization’s
cognitive affordances?
13A visualization’s meaning is emergent from its
interaction with a given viewer
“Diagrams, in and of themselves, do not ‘contain’ all the
information that a viewer needs to use them properly.
Rather, the background knowledge that the viewer brings
to the diagram plays a critical role in whether or not it can
be processed satisfactorily.
[…]
For this reason, current orthodoxies about the intrinsic
benefits of visualization […] need to be examined far
more critically.”
Cheng, P.C.-H., Lowe, R.K. & Scaife, M. (2001) Cognitive Science Approaches to Understanding Diagrammatic Representations. 14
In Blackwell, A. (Ed.), Thinking With Diagrams. Kluwer: Dordrecht, NL.Internal cognition is augmented by external cognition — mediated by representations Some features include: Computational offloading Reduce cognitive effort compared to other representations (e.g. text) by enabling the user to read off information rather than infer it and maintain it in memory Graphical constraining Support specific kinds of reasoning Continuous internal/external interplay A graphical representation shapes reasoning, which in turn changes what we seek and see in the display Scaife, M. & Rogers, Y. (1996). External cognition: how do graphical representations work? 15 International Journal of Human-Computer Studies, 45(2), 185–213. https://doi.org/10.1006/ijhc.1996.0048
Cognitive affordances may be both
individual and shared
               Augments personal working
               memory
               persistent display tuned to specific tasks

               Shared language and inferences
               users can read it with little/no training

               agree on what can be inferred (and what can’t)

               point and plan together: common ground           16
Epistemic Network Analysis (ENA) diagrams
QE ≠ ENA
But for obvious reasons, ENA dominates the QE community at
present as the fullest expression of QE principles
ENA is a compelling proof-case: QE principles can be translated
into running code à powerful analytics
ENA’s success is not just due to its modelling and analysis, but
the visual networks it generates engage a wider audience
17Cognitive affordances of ENA diagrams
Notational features:
Variable sized nodes
Connections (colour and weight)
Meaning of node positions and the
quadrants open to researcher
interpretation
Common node positioning enables
visual comparison and calculation of
subtraction networks
Centroid trajectories, + more… Bian Wu: https://qesoc.org/webinar-archives/#webinar-7
18Exploiting our ability to detect visual changes
Srecko Joksimovic:
https://www.qesoc.org/webinar-archives/#webinar-5
19Exploiting our ability to detect visual changes
Srecko Joksimovic:
https://www.qesoc.org/webinar-archives/#webinar-5
20dENA extends the ontology and notation with directed edges à greater expressiveness Fogel, A., Swiecki, Z., Marquart, C., Cai, Z., Wang, Y., Brohinsky, J., Siebert-Evenstone, A. L., Eagan, B., Ruis, A.R. & Shaffer, D.W. (2020). 21 Directed Epistemic Network Analysis. 2nd International Conference on Quantitative Ethnography 2020. https://www.epistemicanalytics.org/publications
Additional ENA
‘narrative techniques’
When people work around, or augment software
      with other tools (inc. pen+paper),
   they’re clues to gaps in cognitive support
     à potential software improvements
                                                22
Zoom in and reduce visual noise to focus attention
Golnaz Arastoopour Irgens:
https://www.qesoc.org/webinar-archives/#webinar-4
23Design a gallery…
Bian Wu: https://qesoc.org/webinar-archives/#webinar-7
24Design a gallery and highlight features to focus attention
Bian Wu: https://qesoc.org/webinar-archives/#webinar-7
25Animated ENA + synchronized video is compelling
Epistemic Analytics Lab: “Law & Order” ENA-annotated clip
https://www.youtube.com/watch?v=wrTiXNIeHZA
26Animated ENA + synchronized video is compelling
QE Society data challenge: Ardern & Trump COVID-19 policy statements
https://youtu.be/Sy-gwY3SXQ0 27Summary: ENA serves as an aid to shared,
external cognition via processes including…
Computational offloading
Graphical constraining
Continuous internal/external cognition interplay
Shared focus of visual and deictic attention
Accessible, shared language for joint sensemaking
Additional narrative to tell the story
28Who are we talking to?
Do they get to interpret?
29QE for researchers to tell stories to each other
“emic” “etic”
R
S
S S
S data coded data papers
S data viz. talks
S R
Stakeholders Researchers 30In the ‘etic’ world…
à Other researchers judge their
agreement with our formally
submitted papers against scientific
criteria
à Establishing scientific credibility
has rightly been the first focus of
QE as a new field.
31QE that validates with stakeholders
“emic” “etic”
R R
S
S S
S data coded data papers
S data viz. talks
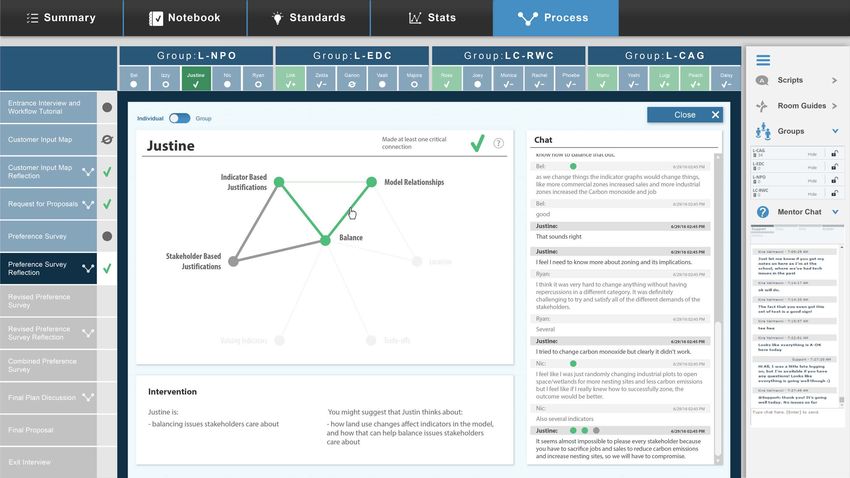
32Making ENA diagrams more participatory (1)
Michael Phillips: ICQE2020 paper and his webinar:
https://www.qesoc.org/webinar-archives/#webinar-2
Maths Science I.T.
(In)validating the strange ENA for I.T. teachers: “So they were having conversations all the time […]
But that didn't necessarily get translated into the kinds of documentation they had in school. They
were doing this on the fly in real time. And so, all of a sudden, I realized that just using one of these
33
data sources didn't necessarily give me the full picture.”Making ENA diagrams more participatory (2)
Golnaz Arastoopour Irgens & Hazel Vega:
https://www.qesoc.org/webinar-archives/#webinar-4
“We needed to set the stage to co-create
meaning together with the teachers, and to
ensure that this network is just one
interpretation of what they said…”
34Making ENA diagrams more participatory (2) Golnaz Arastoopour Irgens & Hazel Vega: https://www.qesoc.org/webinar-archives/#webinar-4 “[the researcher] annotated the network during the interview […] There's a dotted line here between reflection on Accents and Rejection, because […] the teacher said […] she felt that there should have been a link between those two things, for her discourse.” Vega, H., Arastoopour Irgens, G., & Bailey, C. (2020). Negotiating Tensions: A Study of Pre-Service English as Foreign Language Teachers’ Sense of Identity within their Community of Practice. In Ruiz, A. & Lee, S. (Eds), Advances in Quantitative 35 Ethnography: Second International Conference, ICQE 2020. (pp.) Springer.
When we loop ‘etic’ back
into dialogue with ‘emic’
à Stakeholders are given a voice to
  validate the analysis

à The ‘etic’ could change the ‘emic’

à The ‘emic’ could change the ‘etic’
                                       36
Expanding the audience has
consequences for QE visualizations
Computational offloading
ONLY WORKS if the
Graphical constraining representation is
(i) intuitive and
Continuous internal/external cognition interplay (ii) editable
Shared focus of attention
Software design
Accessible, shared language for joint sensemaking implications?
Additional narrative techniques
+ malleability à new meanings… 37As QE becomes embedded in interactive tools
to support work systems, we have to
think differently about QE visualizations
38Now we’re designing work systems
“emic” “etic”
S
S S
R
U data analysis
U T
Work System
with a new Tool
39
and Users who may be different from the Stakeholders being analysedImplications now we’re designing work systems
QE is now part of a (hopefully) human-centred design process
à increasing the diversity of voices in system design
à changing the viz. design process (affordances vary with user expertise)
à and the designed product (what Stakeholders/Users want to see and do in
the tool)
à …which will differ from QE researchers’ viz. requirements
à there is now no expert to provide additional narrative: it has to be in the tool
40Scaffolding interpretation for non-experts in QE Swiecki, Z., Marquart, C., Sachar, A., Hinojosa, C., Ruis, A.R., Shaffer, D.W. (2019). Designing an interface for sharing quantitative ethnographic research data. In 41 Eagan, B., Misfeldt, M., & Siebart-Evenstone, A.L, (Eds.) Advances in Quantitative Ethnography: ICQE 2019.
Embedding QE in a real-time dashboard (1)

Herder, T., Z. Swiecki, S. S. Fougt, A. L. Tamborg, B. B. Allsopp, D. W. Shaffer and M. Misfeldt (2018). Supporting teachers' intervention in students' virtual   42
collaboration using a network based model. Proc. 8th International Conf. Learning Analytics and Knowledge. Pp.21–25. https://doi.org/10.1145/3170358.3170394
Embedding QE in a real-time dashboard (1)
                                                                                                                       Headline summarises
                                                                                                                       key point

                                                                                                                       Nodes positioned for
                                                                                                                       visual clarity, no
                                                                                                                       semantics as in
                                                                                                                       normal ENA

Herder, T., Z. Swiecki, S. S. Fougt, A. L. Tamborg, B. B. Allsopp, D. W. Shaffer and M. Misfeldt (2018). Supporting teachers' intervention in students' virtual   43
collaboration using a network based model. Proc. 8th International Conf. Learning Analytics and Knowledge. Pp.21–25. https://doi.org/10.1145/3170358.3170394
Embedding QE in a real-time dashboard (2) Overall status indicator re. the ‘health’ of a team’s ENA network Swiecki, Z., Ruis, A. R., & Shaffer, D. W. (2019). Modeling and visualizing team performance using epistemic network analysis. In B. S. Goldberg (Ed.), 44 Proc. 7th Annual GIFT Users Symposium (GIFTSym7) (pp. 148-157). Orlando, Florida: U.S. Army Combat Capabilities Development Command—Soldier Center.
Embedding QE in a real-time dashboard (2)
Drill down for detail
displays an interactive
ENA linked to the
transcript

Swiecki, Z., Ruis, A. R., & Shaffer, D. W. (2019). Modeling and visualizing team performance using epistemic network analysis. In B. S. Goldberg (Ed.),   45
Proc. 7th Annual GIFT Users Symposium (GIFTSym7) (pp. 148-157). Orlando, Florida: U.S. Army Combat Capabilities Development Command—Soldier Center.
Embedding QE in a real-time dashboard (2)
                                                                                                  Headline icon
                                                                                                  summarises overall
                                                                                                  status of network

                                                                                                  Nodes positioned for
                                                                                                  visual clarity, no
                                                                                                  semantics as in
                                                                                                  normal ENA

Swiecki, Z., Ruis, A. R., & Shaffer, D. W. (2019). Modeling and visualizing team performance using epistemic network analysis. In B. S. Goldberg (Ed.),   46
Proc. 7th Annual GIFT Users Symposium (GIFTSym7) (pp. 148-157). Orlando, Florida: U.S. Army Combat Capabilities Development Command—Soldier Center.
Embedding QE in a real-time dashboard (2)
Headline icon
summarises overall
status of network
Nodes positioned for
visual clarity, no
semantics as in
normal ENA
Swiecki, Z., Ruis, A. R., & Shaffer, D. W. (2019). Modeling and visualizing team performance using epistemic network analysis. In B. S. Goldberg (Ed.), 47
Proc. 7th Annual GIFT Users Symposium (GIFTSym7) (pp. 148-157). Orlando, Florida: U.S. Army Combat Capabilities Development Command—Soldier Center.Embedding QE in a post-hoc dashboard (1)
Roberto Martinez-Maldonado et al: https://www.qesoc.org/webinar-archives/#webinar-8
Headlines
summarise
key alerts
Headlines summarise key alerts
Martinez-Maldonado, R., Echeverria, V., Fernandez-Nieto, G. & Buckingham Shum, S. (2020). From Data to Insights: A Layered Storytelling Approach for 48
Multimodal Learning Analytics. Proc. ACM CHI 2020: Human Factors in Computing Systems, Paper 21, pp.1-15. https://doi.org/10.1145/3313831.3376148Embedding QE in a post-hoc dashboard (2)
ENA annotation of Spaces of Interest in the Simulation Ward
Fernandez-Nieto, G., Martinez-Maldonado, R., Kitto, K. & Buckingham Shum, S. (2021). Modelling Spatial Behaviours in Clinical Team Simulations using Epistemic
Network Analysis: Methodology and Teacher Evaluation. Proc. 11th International Conference on Learning Analytics & Knowledge. https://doi.org/10.1145/3448139.344817Embedding QE in a post-hoc dashboard (2)
Default ENA network: can nursing teachers interpret this?
• Nodes, links, colours, thickness: intuitive after a brief
introduction
• Team differences were ‘read off’ correctly, and
validated against knowledge of the students
• Node names could be corrected
• 2 nodes should be combined
• A node needed to be split into 2 distinctive ones
• Clear incongruence between spatial location on the
ward, and ENA node position
Fernandez-Nieto, G., Martinez-Maldonado, R., Kitto, K. & Buckingham Shum, S. (2021). Modelling Spatial Behaviours in Clinical Team Simulations using Epistemic
Network Analysis: Methodology and Teacher Evaluation. Proc. 11th International Conference on Learning Analytics & Knowledge. https://doi.org/10.1145/3448139.344817Embedding QE in a post-hoc dashboard (2)
Incongruence between spatial location on the ward, and ENA node position
• Repeated reminders required emphasizing that
node positions ≠ floorplan position
• One teacher thought the ENA seemed upside-down
(medicine room is at the bottom)
• An edge passing close to a node was read as the
student passed close to that location
• ENA node for the manikin patient was distant from
the node for the human role-playing the patient’s
voice: nodes to be merged
Fernandez-Nieto, G., Martinez-Maldonado, R., Kitto, K. & Buckingham Shum, S. (2021). Modelling Spatial Behaviours in Clinical Team Simulations using Epistemic
Network Analysis: Methodology and Teacher Evaluation. Proc. 11th International Conference on Learning Analytics & Knowledge. https://doi.org/10.1145/3448139.344817Embedding QE in a post-hoc dashboard (2)
In the context of the nursing work system, switch to ENA-based annotation
of a more intuitive visualization: the ward floorplan
Mapping from ENA to new visual language:
ENA node size à colour saturation
à a heatmap of spaces
ENA edge size à edges overlayed directly
onto a floorplan à direct representation of
nursing movements
Asking/Receiving Help nodes à activity
icons in the relevant locations
Fernandez-Nieto, G., Martinez-Maldonado, R., Kitto, K. & Buckingham Shum, S. (2021). Modelling Spatial Behaviours in Clinical Team Simulations using Epistemic
Network Analysis: Methodology and Teacher Evaluation. Proc. 11th International Conference on Learning Analytics & Knowledge. https://doi.org/10.1145/3448139.344817Beyond networks
Interactively linked
complementary representations
54Might a heatmap of the underlying matrix add
complementary value to what a network shows?
55ENA Data-to-Text?
Szilvia Zörgő & Gjalt-Jorn Peters:
https://www.qesoc.org/webinar-archives/#webinar-1
56ENA Data-to-Text à prose summaries?
Szilvia Zörgő & Gjalt-Jorn Peters:
https://www.qesoc.org/webinar-archives/#webinar-1 “We can compare males and
females, and looking at those
two networks, we can see that
vitalism is very much a female
thing.”
57ENA Data-to-Text à prose summaries?
Szilvia Zörgő & Gjalt-Jorn Peters:
https://www.qesoc.org/webinar-archives/#webinar-1
“And we can see that in
contrast males emphasize
the connection between
ecological factors and
nutritional factors.”
58ENA Data-to-Text à prose summaries?
Srecko Joksimovic:
https://www.qesoc.org/webinar-archives/#webinar-5
“The results show significant
differences between teachers,
when acting as agents,
compared to acting as role
implementers.”
59ENA Data-to-Text à prose summaries?
Srecko Joksimovic:
https://www.qesoc.org/webinar-archives/#webinar-5
“The epistemic frame for
agency indicates a strong
connection between Inclusive
Pedagogy and Interactions
with Teachers, evidenced with
those thicker lines between
School Capacity, Student
Capacity and Teacher
Interaction.”
60In a future ENA tool…? We don’t have to choose between representations We can offer them all, and link them interactively 61
More participatory QE, and HCD of “QE Inside” tools,
              requires a new skillset

 Fluency using QE visualizations
 for participatory sensemaking

    …clues from the Knowledge Art framework

                                                       62
Let’s revisit the earlier examples
63Should QE researchers be encouraging this sort
of conversation? Should our tools support it?
That node name isn’t
Why isn’t there a link These 2 nodes are really
quite right, we’d
there? Can I just add the same thing, let’s
normally refer to…
that now? merge them, and then
we can see much more
clearly…
Let’s make that green
link much thicker, so This node is confusing
we can see the two things, it’s best split
contrast with red up. Now we can discuss
clearly their different links
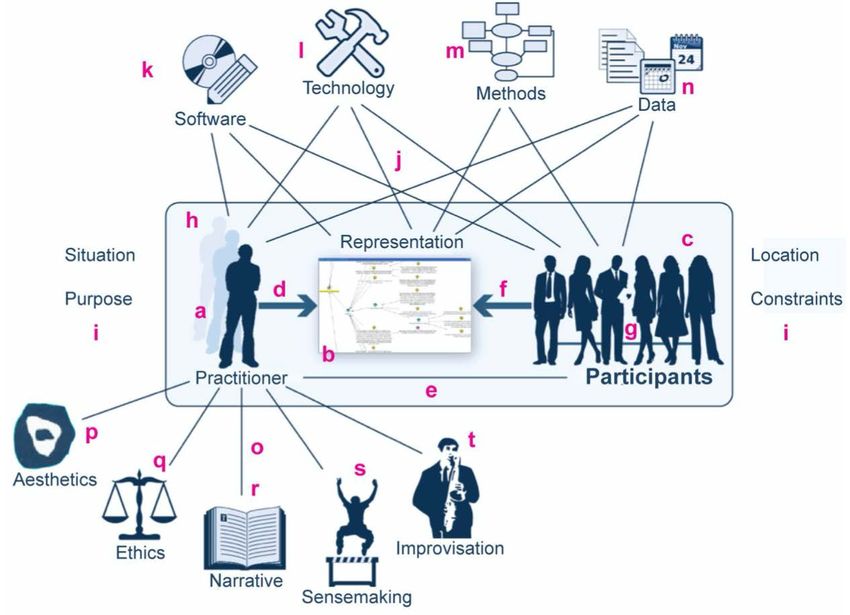
64Knowledge Art framework: the focal activity
The facilitation skillset
of crafting participatory
visual representations
to facilitate joint sensemaking
65Knowledge Art framework: work system tools
The facilitation skillset
of crafting participatory
visual representations
to facilitate joint sensemaking
66Knowledge Art framework: critical fluencies
The facilitation skillset
of crafting participatory
visual representations
to facilitate joint sensemaking
67Knowledge Art framework: critical fluencies Aesthetics. The choices we make for shaping a visualisation – what’s foregrounded, excluded, how polished, how editable… Ethics. How our moves affect the other stakeholders: recognise/ignore their contribution, change meaning, shift topic… Narrative. The context for a session: spoken/unspoken expectations of why we’re here, how we should proceed, what kinds of meanings will be made, or outputs produced… Sensemaking. How we interpret unexpected events or anomalies Improvisation. How well we make spontaneous, unplanned moves with the visualisation when breakdowns occur 68
Knowledge Artistry for more participatory QE?

                                                69
Knowledge Artistry for more participatory QE?
Aesthetics. The choices we make for shaping a
visualisation – what’s foregrounded, excluded, how • “Raw viz” (direct from the tool, as
polished, how editable…
used by QE researchers) or a
Ethics. How our moves affect the other simplified version, more
stakeholders: recognise/ignore their contribution, accessible to lay people?
change meaning, shift topic…
• Does a fixed or malleable viz open
Narrative. The context for a session:
spoken/unspoken expectations of why we’re here, how up more productive conversations?
we should proceed, what kinds of meanings will be What’s editable?
made, or outputs produced…
Sensemaking. How we interpret unexpected
events or anomalies
Improvisation. How well we make spontaneous,
unplanned moves with the visualisation when
breakdowns occur 70Knowledge Artistry for more participatory QE?
Aesthetics. The choices we make for shaping a
visualisation – what’s foregrounded, excluded, how
polished, how editable…
• Does a visualization empower or
disempower stakeholders?
Ethics. How our moves affect the other Amplify or muffle their voices?
stakeholders: recognise/ignore their contribution,
change meaning, shift topic…
• If the viz tool can’t reflect
Narrative. The context for a session: someone’s feedback, what are we
spoken/unspoken expectations of why we’re here, how saying to them?
we should proceed, what kinds of meanings will be
made, or outputs produced…
• When does the QE researcher
Sensemaking. How we interpret unexpected change the topic of conversation in
events or anomalies order to focus on un-explored
parts of the viz?
Improvisation. How well we make spontaneous,
unplanned moves with the visualisation when
breakdowns occur 71Knowledge Artistry for more participatory QE?
Aesthetics. The choices we make for shaping a
visualisation – what’s foregrounded, excluded, how
polished, how editable… • What are the power dynamics and
trust levels?
Ethics. How our moves affect the other
stakeholders: recognise/ignore their contribution,
change meaning, shift topic… • Are we here only to validate the QE
researchers’ story, or to elicit new
Narrative. The context for a session: stories?
spoken/unspoken expectations of why we’re here, how
we should proceed, what kinds of meanings will be
made, or outputs produced… • Are the stakes high? Will this viz
shape future narratives? (e.g.
Sensemaking. How we interpret unexpected impact people, agendas,
events or anomalies
arguments…?)
Improvisation. How well we make spontaneous,
unplanned moves with the visualisation when
breakdowns occur 72Knowledge Artistry for more participatory QE?
Aesthetics. The choices we make for shaping a
visualisation – what’s foregrounded, excluded, how • “This is the wrong ENA: can you
polished, how editable…
display the ENA for teams 1-3 + 23,
Ethics. How our moves affect the other masking dimensions D1+D2, with
stakeholders: recognise/ignore their contribution, comparable link weights”
change meaning, shift topic…
• How do we handle surprise and
Narrative. The context for a session: discontinuity: what do we do if the viz
spoken/unspoken expectations of why we’re here, how
we should proceed, what kinds of meanings will be conflicts with their understanding?
made, or outputs produced…
• Sketching and tinkering are ways to
Sensemaking. How we interpret unexpected articulate and sharpen emerging
events or anomalies
thoughts: is this representationally
Improvisation. How well we make spontaneous, possible, and encouraged?
unplanned moves with the visualisation when
breakdowns occur 73Knowledge Artistry for more participatory QE?
Aesthetics. The choices we make for shaping a
visualisation – what’s foregrounded, excluded, how
polished, how editable… • “Disciplined improvisation”
combines pre-defined, structured
Ethics. How our moves affect the other
stakeholders: recognise/ignore their contribution, methods with creative,
change meaning, shift topic… spontaneous ones: our software
toolkits need to facilitate this…
Narrative. The context for a session:
spoken/unspoken expectations of why we’re here, how
we should proceed, what kinds of meanings will be • What is our improvisational
made, or outputs produced… repertoire with the
representations?
Sensemaking. How we interpret unexpected
events or anomalies
• What’s the learning curve?
Improvisation. How well we make spontaneous,
unplanned moves with the visualisation when
breakdowns occur 74Knowledge Art: learn more…
Selvin, A. & Buckingham Shum, S. (2015). Constructing Knowledge
Art: An Experiential Perspective on Crafting Participatory
Representations. Morgan Claypool (Synthesis Lectures on Human-
Centered Informatics).
https://doi.org/10.2200/S00593ED1V01Y201408HCI023
Selvin, A. (2011). Making Representations Matter: Understanding
Practitioner Experience in Participatory Sensemaking. Doctoral
Dissertation, Knowledge Media Institute, The Open University,
Milton Keynes, UK. http://oro.open.ac.uk/30834
Al Selvin: Open University 2011 PhD seminar:
http://simon.buckinghamshum.net/2011/12/making-
representations-matter-al-selvin-phd
Knowledge Art blog: Open Educational Resources
http://knowledgeart.blogspot.com
UTS Master of Data Science & Innovation:
Selvin, A., Buckingham Shum,S.J. & Aakhus, M. (2010). The “Data, Narrative & Visualization” course: 2016, 2019
Practice Level in Participatory Design Rationale: Studying http://simon.buckinghamshum.net/2019/05/knowledge-art-
Practitioner Moves and Choices. Human
learning-resources
Technology (Special Issue on Creativity and Rationale, Ed.
John Carroll), 6, (1), pp. 71–105.
https://humantechnology.jyu.fi/archive/vol-6/issue-1
75To wrap up…
76Sneak preview of the ICQE 2022 program?...
“Is a picture worth a thousand words? Teacher’s preferences for
ENA-generated prose versus networks”
“QEviz 2.0: Video plus linked, interactive QE visualizations”
“‘Sorry, but that’s not how we do things…’ The politics of adapting
QE visualizations in response to stakeholder feedback”
“Integrating QE analytics into an ER-Nursing handover support
tool: design challenges and empirical evaluation”
77I hope my dishes didn’t give you indigestion
https://unsplash.com/photos/y1XXWct5rBo
Perhaps they’ll go well with one you broughtTo summarise…
Thank You… Discussion!... 79You can also read