Experimental demonstration of spectral domain computational ghost imaging - Nature
←
→
Page content transcription
If your browser does not render page correctly, please read the page content below
www.nature.com/scientificreports
OPEN Experimental demonstration
of spectral domain computational
ghost imaging
Piotr Ryczkowski1*, Caroline G. Amiot1, John M. Dudley2 & Goëry Genty1
We demonstrate computational spectral-domain ghost imaging by encoding complementary Fourier
patterns directly onto the spectrum of a superluminescent laser diode using a programmable spectral
filter. Spectral encoding before the object enables uniform spectral illumination across the beam
profile, removing the need for light collection optics and yielding increased signal-to-noise ratio. In
addition, the use of complementary Fourier patterns allows reduction of deleterious of parasitic light
effects. As a proof-of-concept, we measure the wavelength-dependent transmission of a Michelson
interferometer and a wavelength-division multiplexer. Our results open new perspectives for remote
broadband spectral measurements.
Ghost imaging is an indirect measurement technique that uses the correlation between the intensity profile
of a spatially-resolved light beam and the spatially-integrated intensity of the same beam transmitted through
(or reflected from) an object to reconstruct an image of that o bject1,2. When first developed, the illumination
patterns were based on random noise, which requires the beam intensity profile to be measured in a separate
reference arm3. The image is then obtained from the correlation of the measured reference beam profiles and
signals measured by a single pixel (integrating) detector placed after the object. Extensively studied to reconstruct
spatial images, the technique has recently been extended to other domains including temporal4–6 and spectral
domains7–9.
The need for distinct reference measurements of the illuminating patterns can be eliminated using a compu-
tational approach commonly referred to as computational ghost imaging or single-pixel i maging3. In this case,
a set of specially designed (and stored) intensity masks are used for illumination, and it is then only necessary to
use just one single-pixel detector to measure the integrated intensity after light interaction with the object. The
image is obtained by solving a simple inversion problem. Using an appropriate set of (mathematically) orthogonal
illuminating patterns, the computational imaging approach is significantly faster and yields enhanced signal-
to-noise ratio as compared to random illumination ghost imaging. If the measured object is sparse, one can use
compressed sensing techniques to reduce even further the number of distinct m easurements10,11. Computational
ghost imaging has been demonstrated both in the spatial and temporal domains3,6,12.
Computational imaging analysis has also been proposed in the wavelength domain using a liquid crystal
cell to apply spectral m asks13,14 in the detection plane to reconstruct its spectral response15. Subsequent studies
have expanded the concept using compressed sensing a pproaches16,17, adding polarization a nalysis17,18 or to 2D
measurements19. Here, inspired by Fourier transform interferometry, we present a new approach to sub-nm
resolution computational ghost imaging in the spectral domain by modulating the spectrum of a broadband
light source with harmonic series of sine and cosine patterns11,20,21. With this approach, one obtains directly
the Fourier Transform coefficients of the object spectral response which can then is then retrieved by simple
inversion, improving significantly the measurement speed as compared to when using random spectral fluctua-
tions necessitating the use of a reference arm and subsequent c orrelation7,8. Applying complementary Fourier
modulation patterns directly onto the light source spectrum has multiple benefits including uniform spectral
illumination across the beam profile and reduction of stray light. The technique is especially suitable for remote
sensing when spectrally-resolved measurements are not possible e.g. in the presence of strong scattering or low
signal levels, and it also can be extended to 2D hyperspectral measurements22,23.
1
Laboratory of Photonics, Tampere University, 33101 Tampere, Finland. 2Institut FEMTO‑ST, Université Bourgogne
Franche-Comté CNRS UMR 6174, 25000 Besançon, France. *email: piotr.ryczkowski@tuni.fi
Scientific Reports | (2021) 11:8403 | https://doi.org/10.1038/s41598-021-87355-z 1
Vol.:(0123456789)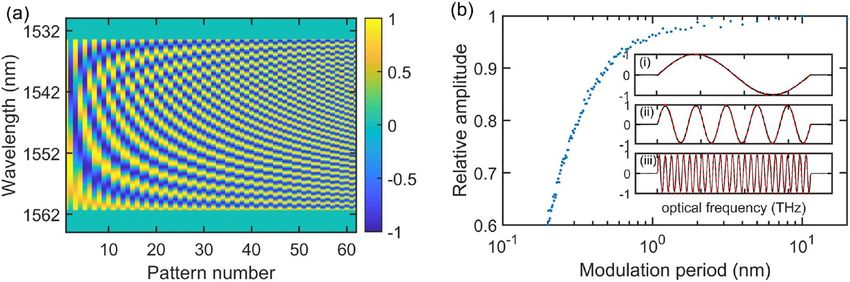
www.nature.com/scientificreports/
Methods
We begin by describing the general principle of spectral-domain ghost imaging. Consider an object with a
spectral response (transmission or reflection) T(ω0 + �), where is a relative optical frequency, spanning �ω
around a central frequency ω0. This spectral response can be decomposed onto a basis of (truncated) harmonic
series of N + 1 sine and cosine functions such that:
N
N
2πn� 2πn�
T(ω0 + �) = an cos + bn sin , (1)
�ω �ω
n=0 n=0
where an and bn represent the n th cosine and sine Fourier coefficients, respectively, defined as
+ �ω
2 2 2πn�
an = T(ω0 + �) cos d�, (2)
�ω − �ω 2
�ω
2
+ �ω
2
2πn�
bn = T(ω0 + �) sin d�. (3)
�ω − �ω
2
�ω
By illuminating the object with sinusoidal intensity patterns of different angular frequencies and measuring with a
single-pixel detector the (spectrally) integrated intensity after transmission (or reflection) through the object, one
can obtain the Fourier coefficients and thereby retrieve the object’s spectral response from Eq. (1). In practice, the
modulation is encoded onto the spectral intensity of the light source, which means that the sinusoidal modulation
(sine or cosine) has a DC component equal to source’s mean spectral intensity I0. In order to eliminate the DC
component, the object can be illuminated with complementary modulation patterns with reversed phase12,24:
±c 2πn�
In (ω0 + �) = I0 1 ± cos , (4)
�ω
2πn�
In±s (ω0 + �) = I0 1 ± sin , (5)
�ω
and the spectral response is then retrieved from:
N
1
+ 2πn�
an − an− cos
T(ω0 + �) =
2I0 �ω
n=0
N
(6)
1
+ 2πn�
bn − bn− sin
+ ,
2I0 �ω
n=0
where
2
+ �ω
2
an± = T(ω0 + �)In±c (ω0 + �)d�, (7)
�ω − �ω
2
2
+ �ω
2
bn± = T(ω0 + �)In±s (ω0 + �)d�. (8)
�ω − �ω
2
Note that the use of complementary Fourier patterns further removes potential background parasitic l ight12. A
total of 4N+2 patterns are then required to reconstruct the spectral transmission of the object (sine patterns for
n = 0 can be omitted), and the fact that one uses a truncated series limits the measurement spectral resolution
to �ω/N. Note that this constitutes a lower limit for the resolution and in practice the resolution can be further
degraded due to the limited bandwidth of the programmable filter resulting in a loss of contrast of the probing
patterns contrast at higher modulation frequencies.
Our experimental setup is shown in Fig. 1a. Light from a fiber-coupled superluminescent diode (SLED)
(Exalos ESL1620-2111) is directed through a programmable spectral filter (Finisar Waveshaper 4000s) which
sequentially modulates the spectral intensity according to the complementary patterns described above (Fig. 1c).
The filter uses a diffraction grating imaging setup coupled with a high-resolution liquid crystal on silicon optical
processor to produce arbitrary spectral transfer functions (amplitude and phase) with bandwidth programmable
in 1 GHz increment from 10 GHz to 1 THz over the 1527.5–1567.5 nm range. The output of the filter is collimated
(or fiber-coupled) to illuminate the sample under test. Light after the sample is collected with a single-pixel large
area detector (Thorlabs PDA50B-EC) with no spectral resolution. The wavelength-dependence of the source
is pre-compensated by pre-normalizing the probing sinusoidal patterns to the SLED unmodulated spectrum
(Fig. 1b). The electronic signal corresponding to each sinusoidal pattern is digitized with a DAQ card (NI USB-
6212) and stored in a computer. The sequential feeding of modulated spectral patterns and data acquisition is
controlled with a LabVIEW program. The spectral response is reconstructed by post-processing using Eq. (6).
Scientific Reports | (2021) 11:8403 | https://doi.org/10.1038/s41598-021-87355-z 2
Vol:.(1234567890)
www.nature.com/scientificreports/

                                  Figure 1.  (a) Experimental setup. (b) SLED full spectrum with the wavelength band of the programmable
                                  spectral filter highlighted in orange. (c) Programmed spectral filter attenuation to generate the complementary
                                  Fourier pairs, here limited to 33 pairs patterns (N = 16) for clarity. The patterns are plotted in the following
                                  order: constant intensity (I0+c ), zero intensity (I0−c ), followed by complementary pairs of sine and cosine with
                                  increasing modulation frequency.

                                  Figure 2.  (a) First 61 sine and cosine complementary patterns measured individually with the OSA. The first
                                  pattern represents the unmodulated SLED spectrum (constant pattern) followed by pairs of sine and cosine
                                  patterns of increasing modulation frequency (decreasing modulation period). (b) Modulation amplitude of
                                  the 100 sine patterns as a function of modulation period, normalized to the highest amplitude value of the
                                  modulated pattern with lowest modulation frequency. The inset shows the measured sine patterns for three
                                  specific modulation frequencies 3.5 THz (∼ 28 nm), 0.7 THz (∼ 5.6 nm), and 0.14 THz (∼ 1.1 nm) as solid
                                  black lines together with ideal sine functions as dashed red lines.

                                  In order to validate the method, we also perform an independent reference measurement of the sample spectral
                                  response using an optical spectrum analyser (OSA, Ando AQ-6315B).

                                  Results
                                  The experimentally measured Fourier patterns (with the OSA) are compared against ideal sinusoidal modulations
                                  in Fig. 2. Although in the measurements reported below we used a total of 402 patterns (N = 100), here for clarity
                                  we only plot the first 61 patterns (including the unmodulated SLED spectrum plus the first 30 sine and cosine
                                  modulations). One can see how the period of all the programmed spectral modulations match very well with ideal
                                  spectral sinusoidal modulations. We can see that the modulation contrast drops as the modulation frequency
                                  (wavelength) increases (decreases), which is caused by the limited operation bandwidth of the programmable
                                  filter. This bandwidth limitation constitutes the main limitation for the measurement resolution. In the subse-
                                  quent proof-of-concept measurements that we report below in Fig. 3, we limit the truncated series to a number of
                                  patterns yielding a resolution of 0.3 nm corresponding to the minimum modulation period that can be imposed
                                  by the waveshaper without significant drop of contrast. We first probed the spectral response of an unequal
                                  path Michelson interferometer known to be a purely sinusoidal function of frequency with modulation period
                                  inversely proportional to the temporal delay between the two interferometer arms. In this case, one expects that
                                  only the probing sinusoidal patterns (sine and/or cosine) with modulation period corresponding to the temporal
                                  delay between the two arms will yield a higher than average intensity signal on the single-pixel detector. In order
                                  to verify this, we conducted a series of measurements where we probed the spectral transmission of the Michelson
                                  interferometer with complementary Fourier patterns for different optical path differences between the two arms.
                                  In this set of measurements, we have used N = 100 and 36 nm bandwidth (1528–1564 nm), corresponding to

Scientific Reports |   (2021) 11:8403 |                https://doi.org/10.1038/s41598-021-87355-z                                                      3

                                                                                                                                               Vol.:(0123456789)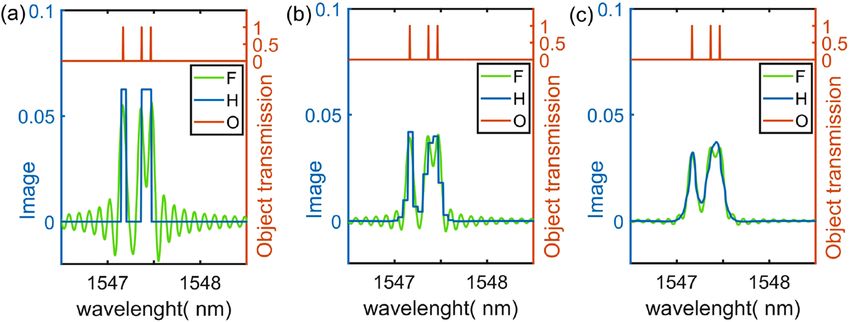
www.nature.com/scientificreports/
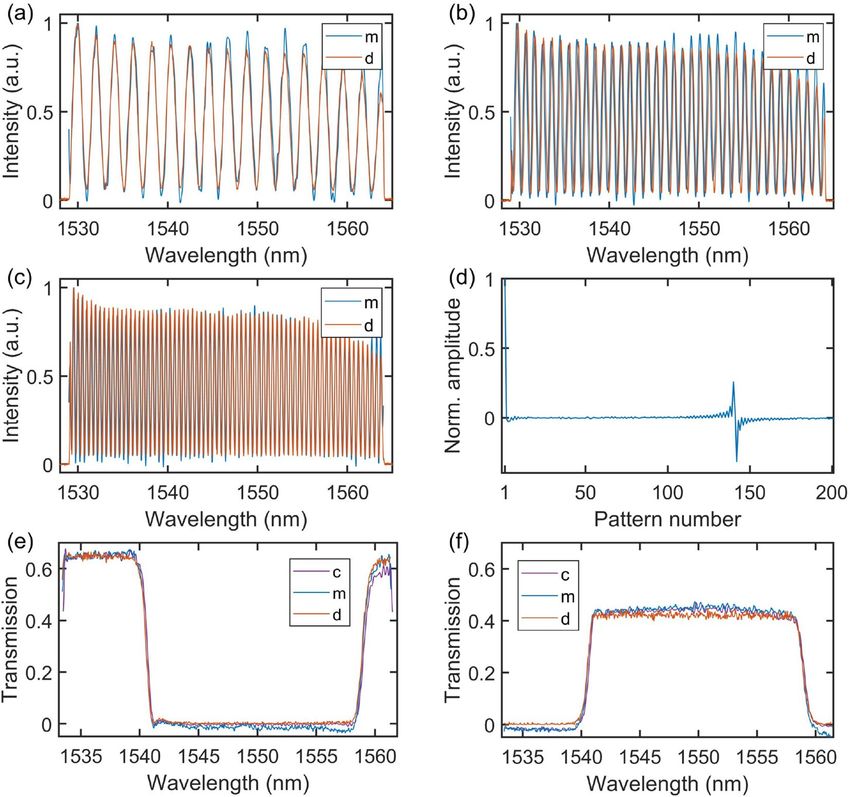
Figure 3. Measured transmission spectra of an unequal path Michelson interferometer with 4 ps (a), 8 ps
(b) and 16 ps (c) temporal delay (optical path differences of 1.2 mm, 2.4 mm and 4.8 mm, respectively)
corresponding to a spectral modulation period of 2 nm, 1 nm, and 0.5 nm, respectively. (d) The signal measured
by the integrating single-pixel detector as a function of the modulation pattern frequency for the case of
16 ps delay. Transmission of a wavelength-division multiplexer measured in rejection (e) and transmission (f)
configurations. The solid lines marked as “c”,“m” and “d” correspond to the spectral transmission obtained from
computational ghost imaging measurements using ideal complementary patterns, computational ghost imaging
measurements using the measured complementary patterns at the waveshaper output, and direct measurement
using the OSA, respectively.
an effective spectral resolution of 0.36 nm. The DAQ card operated at 1 MHz sampling rate with 1 s averaging
for each modulated pattern. Note that the measurement speed is further limited by the switching time in the
programmable filter (500 ms between consecutive patterns) over which data collection is held. The results are
shown in Fig. 3 for temporal delay of 4 ps (a), 8 ps (b) and 16 ps (c). The amplitude of the signal as measured by
the single-pixel detector, in case of 16 ps delay, for all patterns is also plotted in the figure (see Fig. 3d). One can
see that for all the optical path differences, the modulation period and phase are correctly retrieved and that, as
expected, one only observes high signal at the single-pixel detector for a modulation frequency corresponding to
the inverse of the optical path difference between the two arms of the interferometer. We also note the presence
of additional components caused by the non-uniform transmission of the interferometer but these can be also
be seen in the reference OSA measurement. We next performed measurements of the spectral transmission/
reflection a wavelength-division multiplexer with sharp features. Here, we limited the SLED spectrum to 28 nm
bandwidth from 1534 to 1562 nm while keeping N = 100, corresponding to an effective spectral resolution of
0.28 nm. The results using the pre-measured complementary Fourier patterns are shown in Fig. 3(e,f) along with
a reference measurement performed with the OSA for comparison. For completeness, we also show in the figure
the results obtained using ideal sine and cosine functions (i.e. not pre-measured) to reconstruct the transmission
of the multiplexer output ports. We can see very good agreement between both computational ghost imaging
technique approaches (i.e. using ideal mathematical functions or pre-measured patterns) with the OSA reference
measurement in terms of amplitude and bandwidth as well as at the band edges where the transmission slope
is steepest. This means that in principle one does not even need to pre-measure and store the Fourier patterns
Scientific Reports | (2021) 11:8403 | https://doi.org/10.1038/s41598-021-87355-z 4
Vol:.(1234567890)www.nature.com/scientificreports/
Figure 4. Numerical simulation of computational spectral-domain ghost imaging of an object (O) consisting
of three narrow lines of 4 pm width separated by 0.3 nm and 0.1 nm. The retrieved transmission when applying
Fourier (F) and Hadamard (H) patterns is shown for different cases: (a) mathematically ideal patterns, (b)
patterns filtered by a modulation frequency limit of the programmable filter (similar to that shown in Fig. 2b
applied to the object and mathematically ideal patterns for transmission retrieval, (c) patterns filtered by a
modulation frequency limit of the programmable filter applied to the object and for transmission retrieval.
in a computer and the reconstruction can be simply performed using theoretical complementary functions. We
do note a slight increase in the noise amplitude of the computational measurements as compared to that of the
OSA which we attribute to the accumulated error during the spectral response retrieval calculation. The fact
that one uses a truncated Fourier series expansion can also artificially smooth the retrieved spectral response
and this can be seen when comparing the residual modulation on top of the stop/pass band as measured by the
OSA and that retrieved from the computational imaging measurement.
In our experiments we have used complementary Fourier patterns, but in principle other types of functions
such as e.g. Hadamard patterns could be used. In order to examine whether the particular functional form of the
patterns affects the performance of the proposed scheme, we compare numerically in Fig. 4 the retrieved spectral
transmission of an artificial object by spectral-domain ghost imaging using Fourier and Hadamard probing pat-
terns. An object with narrow linewidth features and small wavelength separation was specifically chosen in order
to compare the resolving power when using a programmable filter with limited modulation bandwidth such as
that used in our experimental implementation. The object spectral transmission shown in the top of the figure
sub-panels consists of three narrow lines with 4 pm linewidth separated by 0.3 nm and 0.1 nm, respectively. We
use a truncated series of 256 applied patterns with the smallest modulation period of 0.1 nm.
Figure 4a shows the retrieved spectral transmission for mathematically ideal applied patterns, i.e. with no
additional modulation bandwidth limitation arising from a programmable filter. Figure 4b,c shows the retrieved
spectral transmission when bandwidth-limited patterns (corresponding to a modulation wavelength cut-off
similar to that of our programmable filter) are applied to the object. (b) corresponds to the case when math-
ematically ideal patterns are used in the retrieval while (c) uses the (bandwidth-limited) applied patterns also
for the retrieval. One can see that in all the illustrated cases, the sharp lines of the object are not fully resolved.
This is because the smallest modulation period of the applied patterns is much larger than the actual linewdith
of the spectral features. This highlights the fact that the technique can only fully resolved spectral features with
linewdith larger than that of the smallest modulation pattern of the applied series, independently of the type
of patterns. When mathematically ideal functions are applied, one can also see that Fourier patterns generate
artefacts in the form of oscillations in spectral regions where the object does not transmit light, but at the same
time they yield better resolution as compared to Hadamard patterns with the two closest spectral lines being
distinguished. When the modulation bandwidth is limited by the programmable filter, the resolution decreases
and the amplitude of the artefacts induced by the Fourier patterns is also reduced. But even in this case Fourier
patterns still allow for distinguishing the narrow line features while Hadamard patterns do not. We performed
additional tests (not shown here) including artificial noise added to the simulations and found similar noise
figures in terms of average root-mean-square for both Fourier and Hadamard probing patterns.
Discussion and conclusion
We have demonstrated computational ghost imaging in the spectral domain using complementary Fourier-pair
probing patterns. The technique allows for direct measurement of the Fourier coefficients of the object’s spectral
response with fast reconstruction. The resolution of the technique is limited by the highest frequency (shortest
wavelength) modulation period used in the experiment, corresponding here to a sinusoidal modulation pat-
tern with a period of c.a 0.3 nm beyond which the modulation visibility drops significantly. The technique can
be extended to any wavelength region, in particular to the mid-infrared where detectors are not particularly
sensitive. There is a wide range of broadband LEDs or supercontinuum sources available in the mid-infrared,
and the same type of liquid crystal on silicon technology as used in our filter has also been demonstrated for
wavelengths beyond 5 µm25.
The fact that the modulation is directly applied onto the light source yields several advantages. It allows for
uniform spectral illumination across the spatial beam profile, pre-compensation of the light source spectral
intensity variations, and removes the need for complex optics to collect and modulate light possibly leading to
Scientific Reports | (2021) 11:8403 | https://doi.org/10.1038/s41598-021-87355-z 5
Vol.:(0123456789)www.nature.com/scientificreports/
better signal-to-noise ratio. In experimental schemes where spectral modulation is performed after the object,
light may need to be coupled into a fiber or into a spectrometer slit. This is not the case with our approach, result-
ing in increased intensity collected by the wavelength-integrating detector and enhanced signal-to-noise ratio.
This could be particularly beneficial if the object is strongly scattering and the spatial coherence of the beam
is significantly degraded, or in the presence of strong aberrations in the collecting optics before the detector.
Another advantage of modulating directly the light source rather than light transmitted through the object is that
the measurements are not affected by distortion that may occur after the object (e.g. due to nonlinear effects).
In our experiments, the measurement speed is limited by the relatively slow switching speed of the liquid
crystals in the programmable filter. As compared to using random probing p atterns7,8, the speed difference lies
essentially in the data collection and processing times. Although the generation of random patterns is signifi-
cantly faster than that of pre-programmed patterns since no active electrical or optical control is needed, orders
of magnitude more realizations are required with random patterns in order to obtain a similar signal-to-noise
ratio. Furthermore, unlike random patterns which requires post-processing of the recorded data (see Refs.7,8)
pre-programmed patterns allows for fast spectral response retrieval by inverse transform. Increasing the measure-
ment speed with pre-programmed patterns could be achieved by dispersing the broadband light and modulating
individually the spectral components using a digital mirror array similarly to the arbitrary waveform generator
proposed in26.
The use of complementary Fourier patterns further reduces the influence of parasitic stray light which can be
particularly useful in the case of remote measurements. Although here we use complementary Fourier spectral
illumination patterns, one can in principle use other types of patterns such as e.g. Hadamard functions which
are traditionally employed in compressed sensing and which can be more suitable for specific applications. The
sensitivity of the measurements may also be increased by adding lock-in detection to the current setup and the
concept can be extended to 2D hyperspectral measurement, where one acquires different images of a physical
object corresponding to different spectral illumination patterns using simply an unfiltered camera. In this case,
our approach may be particularly beneficial requiring only a single programmable filter. Our results could open
up new perspectives for remote spectral measurements in industrial, biological or security applications, e.g. by
illuminating a target with programmed spectral patterns and detecting the reflected signal with an integrating
detector without any spectral resolution.
Received: 7 July 2020; Accepted: 13 January 2021
References
1. Sun, M. J. & Zhang, J. M. Single-pixel imaging and its application in three-dimensional reconstruction: A brief review. Sensors
(Switzerland) 19, 1–14. https://doi.org/10.3390/s19030732 (2019).
2. Edgar, M. P., Gibson, G. M. & Padgett, M. J. Principles and prospects for single-pixel imaging. Nat. Photon. 13, 13–20. https://doi.
org/10.1038/s41566-018-0300-7 (2019).
3. Erkmen, B. I. & Shapiro, J. H. Ghost imaging: From quantum to classical to computational. Adv. Opt. Photon. 2, 405–450. https://
doi.org/10.1364/AOP.2.000405 (2010).
4. Ryczkowski, P., Barbier, M., Friberg, A. T., Dudley, J. M. & Genty, G. G. Ghost imaging in the time domain. Nat. Photon. 10,
167–170. https://doi.org/10.1038/nphoton.2015.274 (2016).
5. O-oka, Y. & Fukatsu, S. Differential ghost imaging in time domain. Appl. Phys. Lett. 111, 061106. https://doi.org/10.1063/1.49979
25 (2017).
6. Devaux, F., Moreau, P.-A., Denis, S. & Lantz, E. Computational temporal ghost imaging. Optica 3, 698–701. https://doi.org/10.
1364/OPTICA.3.000698 (2016).
7. Amiot, C., Ryczkowski, P., Friberg, A. T., Dudley, J. M. & Genty, G. Supercontinuum spectral-domain ghost imaging. Opt. Lett.
43, 5025–5028. https://doi.org/10.1364/ol.43.005025 (2018).
8. Amiot, C. G., Ryczkowski, P., Friberg, A. T., Dudley, J. M. & Genty, G. Ghost optical coherence tomography. Opt. Express 27,
24114–24122 (2019).
9. Janassek, P., Blumenstein, S. & Elsäßer, W. Ghost spectroscopy with classical thermal light emitted by a superluminescent diode.
Phys. Rev. Appl. 9, 021001. https://doi.org/10.1103/PhysRevApplied.9.021001 (2018).
10. Romberg, J. et al. Single-pixel imaging via compressive sampling. IEEE Signal Process. Mag. 25, 83–91. https://doi.org/10.1109/
MSP.2007.914730 (2008).
11. Wenwen, M. et al. Sparse Fourier single-pixel imaging. Opt. Express 27, 31490. https://doi.org/10.1364/oe.27.031490 (2019).
12. Zhang, Z., Ma, X. & Zhong, J. Single-pixel imaging by means of Fourier spectrum acquisition. Nat. Commun. 6, 6225. https://doi.
org/10.1038/ncomms7225 (2015).
13. Sloane, N. J. A., Fine, T., Phillips, P. G. & Harwit, M. Codes for multiplex spectrometry. Appl. Opt. 8, 2103. https://d
oi.o
rg/1 0.1 364/
ao.8.002103 (1969).
14. Nelson, E. D. & Fredman, M. L. Hadamard spectroscopy. J. Opt. Soc. Am. 60, 1664. https://doi.org/10.1364/josa.60.001664 (1970).
15. Itoh, K., Inoue, T., Ohta, T. & Ichioka, Y. Liquid-crystal imaging Fourier-spectrometer array. Opt. Lett. 15, 652–654 (1990).
16. August, Y. & Stern, A. Compressive sensing spectrometry based on liquid crystal devices. Opt. Lett. 38, 4996. https://doi.org/10.
1364/ol.38.004996 (2013).
17. Soldevila, F. et al. Single-pixel polarimetric imaging spectrometer by compressive sensing. Appl. Phys. B Lasers Opt. 113, 551–558.
https://doi.org/10.1007/s00340-013-5506-2 (2013).
18. Hegyi, A. & Martini, J. Hyperspectral imaging with a liquid crystal polarization interferometer. Opt. Express 23, 28742. https://
doi.org/10.1364/oe.23.028742 (2015).
19. Sun, T.,&Kelly, K. Compressive and sensing hyperspectral imager. In Frontiers in Optics 2009, Laser Science XXV, Fall, OSA Optics
and Photonics Technical Digest. CTuA5, 2009. https://doi.org/10.1364/COSI.2009.CTuA5 (Optical Society of America) (2009).
20. Salvador-Balaguer, E., Clemente, P., Tajahuerce, E., Pla, F. & Lancis, J. Full-color stereoscopic imaging with a single-pixel photo-
detector. J. Display Technol. 12, 417–422. https://doi.org/10.1109/JDT.2015.2494613 (2016).
21. Zhang, Z., Wang, X., Zheng, G. & Zhong, J. Hadamard single-pixel imaging versus Fourier single-pixel imaging. Opt. Express 25,
19619. https://doi.org/10.1364/oe.25.019619 (2017).
22. Schultz, R. A. et al. Hyperspectral imaging: a novel approach for microscopic analysis. Cytometry 43, 239–247. https://doi.org/10.
1002/1097-0320(20010401)43:43.0.CO;2-Z (2001).
Scientific Reports | (2021) 11:8403 | https://doi.org/10.1038/s41598-021-87355-z 6
Vol:.(1234567890)www.nature.com/scientificreports/
23. Johnson, W. R., Wilson, D. W., Fink, W., Humayun, M. & Bearman, G. Snapshot hyperspectral imaging in ophthalmology. J.
Biomed. Opt. 12, 014036. https://doi.org/10.1117/1.2434950 (2007).
24. Yu, W.-K., Yao, X.-R., Liu, X.-F., Li, L.-Z. & Zhai, G.-J. Three-dimensional single-pixel compressive reflectivity imaging based on
complementary modulation. Appl. Opt. 54, 363. https://doi.org/10.1364/ao.54.000363 (2015).
25. Zhang, G. et al. Fast multispectral liquid-crystal-on-silicon spatial light modulators. In Proceedings of SPIE, vol. 6208 of Society of
Photo-Optical Instrumentation Engineers (SPIE) Conference Series, 62080T. https://doi.org/10.1117/12.667618 (2006).
26. Kalyoncu, S. K., Huang, Y., Song, Q. & Boyraz, O. Fast arbitrary waveform generation by using digital micromirror arrays. IEEE
Photon. J. 5, 5500207. https://doi.org/10.1109/JPHOT.2013.2238664 (2013).
Author contributions
P.R. and C.A. performed the experiments. G.G. and J.D. supervised the project. All authors contributed to the
data analysis and writing of the manuscript.
Funding
G.G. acknowledges the Academy of Finland (298463, 318082, Flagship PREIN 320165). J.D. acknowledges the
French Agence Nationale de la Recherche (ANR-15-IDEX-0003, ANR-17-EURE-0002).
Competing interests
The authors declare no competing interests.
Additional information
Correspondence and requests for materials should be addressed to P.R.
Reprints and permissions information is available at www.nature.com/reprints.
Publisher’s note Springer Nature remains neutral with regard to jurisdictional claims in published maps and
institutional affiliations.
Open Access This article is licensed under a Creative Commons Attribution 4.0 International
License, which permits use, sharing, adaptation, distribution and reproduction in any medium or
format, as long as you give appropriate credit to the original author(s) and the source, provide a link to the
Creative Commons licence, and indicate if changes were made. The images or other third party material in this
article are included in the article’s Creative Commons licence, unless indicated otherwise in a credit line to the
material. If material is not included in the article’s Creative Commons licence and your intended use is not
permitted by statutory regulation or exceeds the permitted use, you will need to obtain permission directly from
the copyright holder. To view a copy of this licence, visit http://creativecommons.org/licenses/by/4.0/.
© The Author(s) 2021
Scientific Reports | (2021) 11:8403 | https://doi.org/10.1038/s41598-021-87355-z 7
Vol.:(0123456789)You can also read