MINING ROCK PROPERTIES. ROCK MECHANICS AND GEOPHYSICS
←
→
Page content transcription
If your browser does not render page correctly, please read the page content below
MINING SCIENCE AND TECHNOLOGY (RUSSIA) eISSN 2500-0632
ГОРНЫЕ НАУКИ И ТЕХНОЛОГИИ https://mst.misis.ru/
2021;6(2):65–72 Voznesensky A. S., Kidima-Mbombi L. K. Formation of synthetic structures and textures of rocks...
MINING ROCK PROPERTIES. ROCK MECHANICS AND GEOPHYSICS
Research article
https://doi.org/10.17073/2500-0632-2021-2-65-72
Formation of synthetic structures and textures of rocks
when simulating in COMSOL Multiphysics
A. S. Voznesensky , L. K. Kidima-Mbombi
NUST “MISIS”, Moscow, Russian Federation
al48@mail.ru
Abstract
Rock texture and structure play an important role in the formation of the rock physical properties, and also
carry information about their genesis. The paper deals with the simulation of geometric shapes of various
structures and textures of rocks by the finite-element method (FEM). It is carried out by programmed detailing
of the element properties and their spatial location in the simulated object. When programming structures,
it is also possible to set the physical properties of various parts of the model, grids, initial and boundary
conditions, which can be changed in accordance with the scenarios for numerical experiments. In this study,
on the basis of FEM, simulation of various structures and textures of rocks with inclusions and disruptions
was implemented in COMSOL Multiphysics in conjunction with Matlab. Such structures are used to conduct
computer generated simulations to determine physical properties of geomaterials and study the effect on
them of agents of various physical nature. The building of several models was considered: a rock specimen
with inclusions in the form of ellipses of equal dimensions with different orientations; a sandstone specimen
containing inclusions with high modulus of elasticity in cement matrix when deforming; a limestone
specimen with fractures filled with oil and saline water when determining its specific electrical resistance.
As an example of a fractured structure analysis, the influence of the filler on the electrical resistance of
the limestone specimen containing a system of thin elliptical predominantly horizontal fractures was
considered. The change in the lines of current flow at different ratios between the matrix and the fracture
filler conductivities and their effect on the effective (averaged) conductivity of the rock specimen was clearly
demonstrated. The lower conductivity of the fracture filler leads to increasing the length and decreasing the
cross-section of the current flow lines that, in turn, leads to significant decrease in the conductivity of the
fractured rock specimen. The higher filler conductivity results in a slight increase in the conductivity of the
fractured specimen compared to that of the homogeneous isotropic specimen. The resulting structures can
be used for numerical experiments to study physical properties of rocks.
Key words
rocks, geomaterials, physical properties, fractures, inclusions, numerical simulation, synthetic structures,
texture, acoustic properties, electrical properties
Acknowledgments
The study was carried out with financial support of the Russian Foundation of Fundamental Research (RFFR)
(scientific project No 20-05-00341).
For citation
Voznesensky A. S., Kidima-Mbombi L. K. Formation of synthetic structures and textures of rocks when
simulating in COMSOL Multiphysics. Mining Science and Technology (Russia). 2021;6(2):65–72. https://doi.
org/10.17073/2500-0632-2021-2-65-72
СВОЙСТВА ГОРНЫХ ПОРОД. ГЕОМЕХАНИКА И ГЕОФИЗИКА
Научная статья
Формирование синтетических структур и текстур горных пород
при их моделировании в среде COMSOL Multiphysics
А. С. Вознесенский , Л. К. Кидима Мбомби
НИТУ «МИСиС», г. Москва, Россия
al48@mail.ru
Аннотация
Текстура и структура горных пород играют существенную роль в формировании их физических
свойств, а также несут информацию о генезисе. В статье рассматривается моделирование методом ко-
нечных элементов (МКЭ) геометрических форм различных структур и текстур горных пород. Оно осу-
ществляется путем программной детализации свойств элементов и их пространственного расположе-
ния в моделируемом объекте. При программировании структур возможно также задание физических
© Voznesensky A. S., Kidima-Mbombi L. K., 2021
65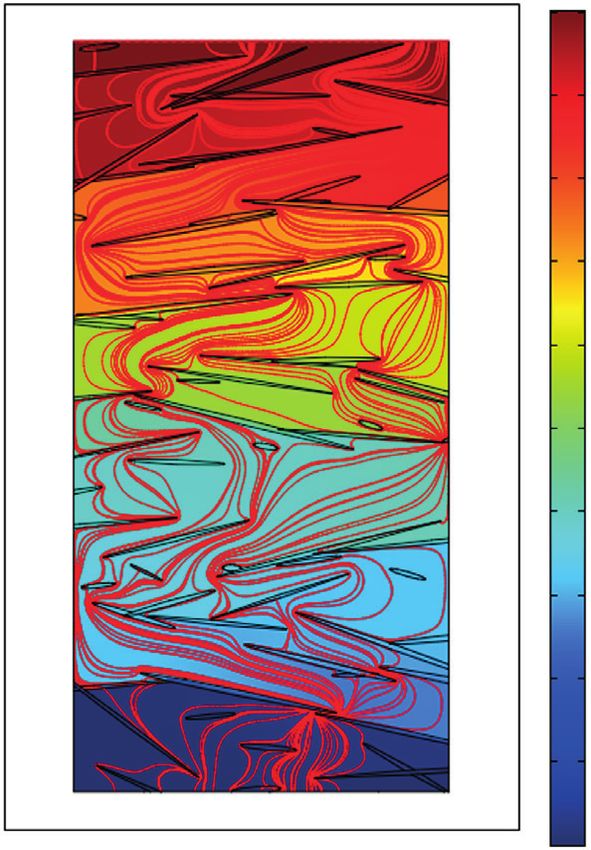
MINING SCIENCE AND TECHNOLOGY (RUSSIA)                                                                            eISSN 2500-0632

          ГОРНЫЕ НАУКИ И ТЕХНОЛОГИИ                                                                                      https://mst.misis.ru/
          2021;6(2):65–72                         Voznesensky A. S., Kidima-Mbombi L. K. Formation of synthetic structures and textures of rocks...

       свойств различных частей модели, сеток, начальных и граничных условий, которые могут изменяться
       в соответствии со сценариями проведения численных экспериментов. В работе на основе МКЭ реали-
       зуется моделирование в COMSOL Multiphysics в связке с Matlab различных структур и текстур горных
       пород с включениями и нарушениями. Такие структуры используются для проведения компьютерных
       экспериментов по определению физических свойств геоматериалов и исследованию влияния на них
       воздействий различной физической природы. Рассмотрены построения нескольких моделей: образца
       горной породы с включениями в форме эллипсов равных размеров с различной ориентацией; образ-
       ца песчаника, содержащего включения с высоким модулем упругости в цементирующей матрице при
       его деформировании; образца известняка при определении его удельного электрического сопротив-
       ления с трещинами, заполненными нефтью и минерализованной водой. В качестве примера анализа
       трещиноватой структуры рассмотрено влияние заполнителя на электросопротивление образца из-
       вестняка, содержащего систему тонких эллиптических трещин с преимущественно горизонтальным
       расположением. Наглядно показано изменение линий протекания тока при разных соотношениях
       между проводимостью матрицы и заполнителем трещин и их влияние на эффективную (усредненную)
       проводимость образца породы. Меньшая проводимость заполнителя трещин приводит к увеличению
       длины и уменьшению сечения линий протекания тока, что в свою очередь приводит к существенному
       снижению проводимости трещиноватого образца породы. Большая проводимость заполнителя имеет
       своим результатом незначительное увеличение проводимости трещиноватого образца по сравнению
       с однородным изотропным образцом. Полученные структуры могут быть использованы для проведе-
       ния численных экспериментов по исследованию физических свойств пород.
       Ключевые слова
       горные породы, геоматериалы, физические свойства, трещины, включения, численное моделирование,
       синтетические структуры, текстура, акустические свойства, электрические свойства
       Финансирование
       Работа выполнена при финансовой поддержке гранта РФФИ (проект № 20-05-00341)
       Для цитирования
       Voznesensky A. S., Kidima-Mbombi L. K. Formation of synthetic structures and textures of rocks when
       simulating in COMSOL Multiphysics. Mining Science and Technology (Russia). 2021;6(2):65–72. https://doi.
       org/10.17073/2500-0632-2021-2-65-72

                      Introduction                               structure, texture, and chemical composition of syn-
     Rock texture and structure play an important role           kinematic phyllosilicates in fault zones was used to
in the formation of a rock’s physical properties and             determine the mechanisms and stages of strains and
also carry information about their genesis. Therefore,           conditions of fault activity. Replacing the models of
scientists from different disciplines have an interest in        the complex textures of most granular sedimentary
studying these rock characteristics.                             rocks with a model of a granular effective medium,
     The history of the evolution of texture analysis            based on the physics of random sphere packing, was
(TA) was presented in the fundamental study by [1],              proposed in [8]. The physical properties of reservoir
which gave examples simulating the elastic properties            rocks containing oil, gas, or water depend on the rock
of textured materials from multiphase specimens                  mineral composition and texture, as noted in [9]. The
containing pores and fractures. Petrographic analysis            texture and residual stresses in geological specimens
was carried out by [2] to determine the structure,               were studied in [10]. The theory and simulation of the
texture, composition, and presence of minerals in                formation of new structures as a result of the contrast
beach rock specimens from the islands of Japan and               in rheological properties between layers of different
Indonesia. To optimise the parameters of hydraulic               textures were considered in [11].
fracturing using two and three-dimensional numerical                 A number of studies have been devoted to the
models, the matrix structure and heterogeneities of              quantitative assessment of textures using coefficients,
minerals with complicated geometry of intergranular              as well as the establishment of their relationship with
contacts between them were taken into account [3].               the physical and technological properties of rocks.
The importance of studying texture as one of the key                 The texture coefficient was proposed by two
elements that determine the morphological features               Australian researchers, Howarth and Rowlands, in
of rupture was noted in [4]. Studies of small-scale              1986 [12, 13] to quantify texture, taking into account
variations in mineralogical composition and texture              the shape, size, and location of mineral grains that
associated with rock faults within the San Andreas               made up rocks, as noted in [14]. The relationship
continental transform fault zone were described in [5].          between a rock’s engineering properties and texture
Crystallographic textures of specimens of granulite,             has been investigated through examples of carbonate
amphibolite, schist and gneiss were measured,                    rocks [15]. Grain shape, elongation, orientation,
classified, and compared with similar textures of                roundness, packing density, porosity and matrix
monomineral rocks in [6]. In [7], analysis of the crystal        content were evaluated by the texture coefficient.

                                                            66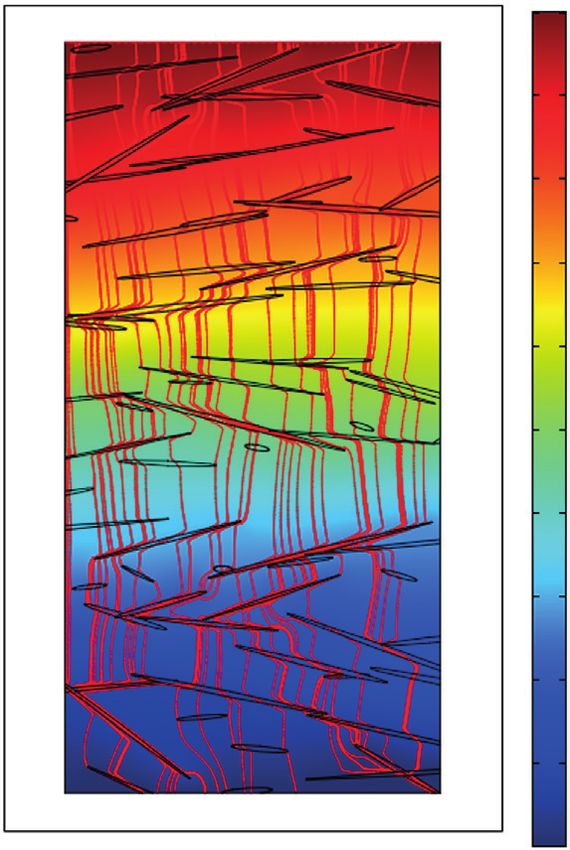
MINING SCIENCE AND TECHNOLOGY (RUSSIA)                                                                             eISSN 2500-0632

          ГОРНЫЕ НАУКИ И ТЕХНОЛОГИИ                                                                                       https://mst.misis.ru/
          2021;6(2):65–72                          Voznesensky A. S., Kidima-Mbombi L. K. Formation of synthetic structures and textures of rocks...

Specimens of Cretaceous carbonates, including grain               The pore network model was used in [29], to simulate
size and percentage, matrix type, dolomite percentage             diagenetic cycles of sedimentary reservoir rocks. An
and carbonate percentage were investigated in relation            example of the use of two extended fracture criteria -
to compressive strength and Young's modulus [16].                 the “nonlocal Coulomb-Mohr softening criterion” and
Quantitative petrographic studies of the influence                the “multilayer criterion” - for simulating underground
of the distribution of minerals and their sizes on the            constructions and rock specimens in layered mica
strength and other geotechnical properties of low-                schist with overlying rocks of complex texture, was
porosity volcanic rocks were discussed in [17]. The               given in [30]. The textures of three different facies of
relationship between the texture coefficient and                  diabase alteration were studied using microscopy and
sinuosity of the matrix of a rock containing pores (on            X-ray microtomography to calculate rock permeability
the one hand) and Young's modulus, ultimate strength,             by numerical simulation [31].
ultimate yield and shear modulus under uniaxial                        For the numerical simulation of various structures
compression (on the other), was investigated in [18].             and textures of rocks with inclusions and fractures
Experimental numerical simulation by the method of                by the finite-element method in the COMSOL
discrete elements and laboratory testing of granite               Multiphysics environment, the use of this software in
specimens under uniaxial compression and Brazilian                conjunction with Matlab, on the basis of which this
tests (for tensile strength) were performed in [19], to           system was created, may be useful. The structures
study the effect of the size and distribution of mineral          obtained in this way can then be used for carrying out
grains on the strength and nature of microfractures in            computer generated simulations to determine physical
granite rocks. The influence of the pre-existing texture          properties of geomaterials and study the influences
of natural fractures on the shape of the reservoir in the         on them of the effects of diverse physical nature. The
course of its hydraulic fracturing was studied in [20]            complexity and laboriousness of manually drawing
using a block model of discrete elements. The influence           such textures with a large number of structural
of the mineral composition and texture of the rock on             elements, as well as with permanent changes in the
the slake durability index (Slake Durability, SDI), as            course of performing a series of experiments, make
well as the relationship between the SDI of some rocks            this operation practically unfeasible.
and their engineering (geotechnical) properties were                   The aim of the study was to develop a technology
studied in [21]. The relationship between the texture             for the automated synthesis of structures and textures
and mechanical properties of various rocks was studied            of rocks with random variations of given textural
in [22]. The rock texture features were quantified using          parameters, characteristic of natural geomaterials,
the texture coefficient. The developed model was                  for use in numerical experiments for determining the
applied to determine the rating of intact rock mass in            physical properties under diverse effects.
the RMR rock mass classification.
     A special place is occupied by methods of image                              1. Research techniques
processing and synthesis of structures to establish their              Finite-element simulation of geometric shapes of
relationships with the physical properties of rocks.              various structures and textures of rocks is carried out
     The study [23] was devoted to the automatic                  by means of drawing the elements and their placement
identification of rocks in thin sections using texture            within the simulated object using software. With
analysis. The publication [24] is devoted to the creation         this approach, it is also possible to set the physical
of petrographic images using thin sections and the                properties of various parts of the model, grids, initial
quantitative determination of the spatial location                conditions and boundary conditions, which can change
of selected rock components using two-dimensional                 in accordance with the scenarios for conducting
(2D) Fourier transform. The texture segmentation                  numerical experiments.
algorithm for digital images of borehole walls was                     As an example of the formation of a structure
discussed, based on the "texture energy" index, and               created using a program written in Matlab codes, in
allowed to automatically divide the recorded sequence             COMSOL Multiphysics, we consider a fragment of a
into strata [25]. The use of the statistical texture model        drawing of a rock specimen with inclusions in the form
proposed by Ma and Gagalovich to create a synthetic               of ellipses [32]. The introduction of a random number
image comparable to the original one, was described               generator makes it possible to obtain the uniqueness of
in [26]. The study by [27] was devoted to the automatic           each combination of geometric parameters and study
identification of rocks in thin sections using texture            the influence of random factors on the experiment
analysis. Stress-strain curves and rupture evolution              results.
                                                                                                 Code snippet
processes in rocks, based on synthetic digital models
under uniaxial compression that allowed the simulation            clc                                         Initial operations
of various structural details and heterogeneous                   clear all
diversity of the studied rocks, were studied in [28].             clear fem

                                                             67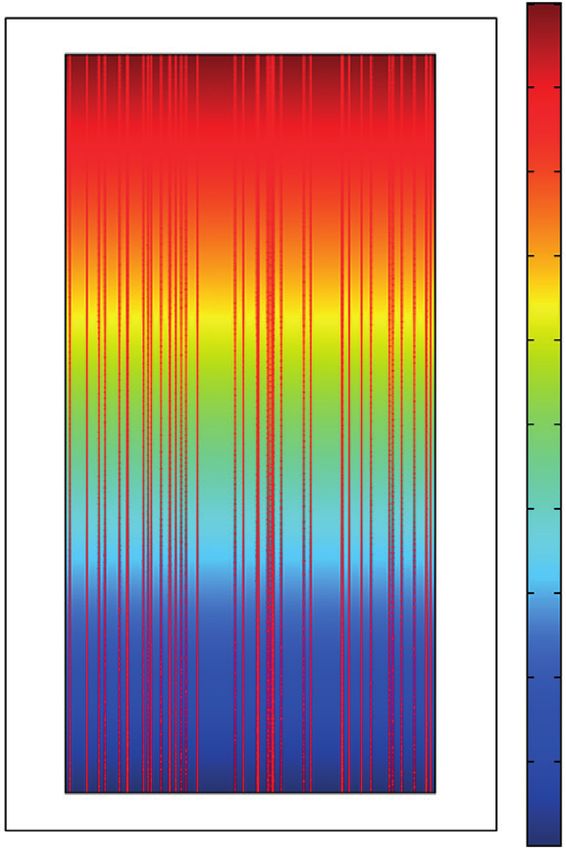
MINING SCIENCE AND TECHNOLOGY (RUSSIA) eISSN 2500-0632
ГОРНЫЕ НАУКИ И ТЕХНОЛОГИИ https://mst.misis.ru/
2021;6(2):65–72 Voznesensky A. S., Kidima-Mbombi L. K. Formation of synthetic structures and textures of rocks...
fem.shape = 2; 2. The Findings and Discussion
fem.sshape = 2; 2.1. Demo example
AT = 0.001; Semi-major axis of the The result of generating the structure in accordance
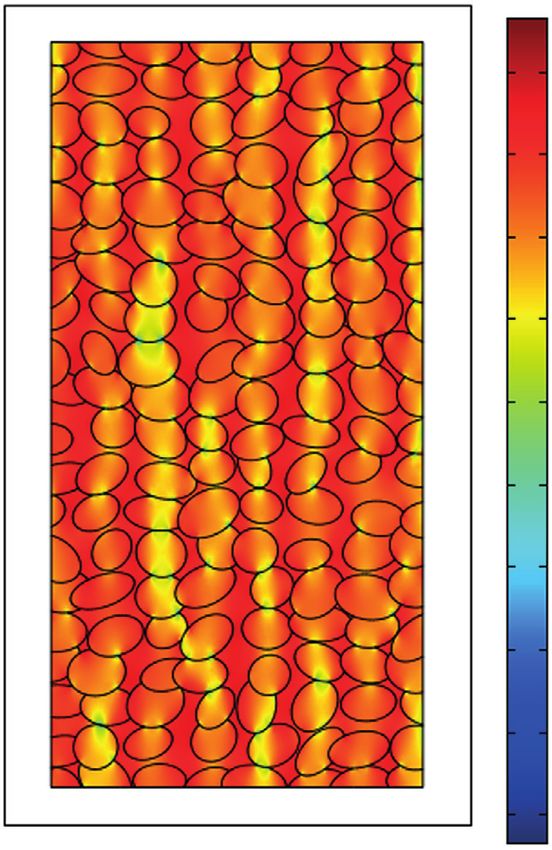
ellipse
with the above code is shown in Fig. 1. In this case, the
BT = 0.0002; Semi-minor axis of the
inclines of the ellipses were randomly set and their
ellipse
size and position did not change. By setting a different
phi = 45; Ellipse tilt
number of ellipses and changing their size boundaries,
LX = 0.032; Specimen width
the incline angle and positions, it was possible to obtain
LY = 0.064; Specimen height
structures corresponding to different types of rocks.
NX = 15; Ellipses horizontal quantity
NY = 18; Ellipses vertical quantity
YMIN=BT/3; Y fields
XMIN=AT/3; X fields
DX = (LX-2*XMIN)/(NX+1); Distance between inclusions
along X
DY = (LY-2*YMIN)/(NY+1); Distance between inclusions
along Y
r1 = rect2(LX,LY,’base’,’cor- Specimen formation
ner’,’pos’,[-LX/2 -LY/2]);
for j=1:NX
display=j
CX = -LX/2+XMIN+DX*(j);
for i=1:NY
CY = -LY/2+YMIN+DY*(i);
k = (i-1)*NX+j;
A=pi/2*random(‘Uni- Tilt angle of ellipses from
form’,-1,1,1,1) –90o to +90o
r{k} = ellip2(AT,BT,’pos’,[CX Formation of ellipses of
CY],’rot’,A); inclusions
r1 = r1 – r{k}; Formation of structure
r1 = r1 + r{k};
end; Fig. 1. The program code result
end;
fem.geom =r1; Structure building The resulting structures can be used for numerical
display=’femgeom’ experiments to study physical properties of rocks. We
fem.mesh = meshinit(fem); Grid formation will now consider examples of such studies.
display=’femmesh’
2.2. Generation of the structure
fem.mesh = meshrefine(fem);
of a sandstone specimen and simulating
display=’meshrefine’ ts uniaxial compression test (UCT)
figure, geomplot(fem) Grid formation
We will consider the simulation of a sandstone
fem.mesh =
meshinit(fem,’report’,’off’); specimen of dimensions 32×32×64 mm in the form of
fem.appl.mode = ‘FlPlaneStrain’; Selection of a COMSOL a rectangular prism with a square base. The specimen
Multiphysics section included high-modulus grain-inclusions with a
fem.appl.equ.f = {0 0 1}; structure of 6×18 grains, placed in cement matrix.
fem.appl.equ.c = 1; Semi-axes of the grains were of the following sizes:
fem.appl.bnd.h = 1; a large one of 1.8 to 2.9 mm and a smaller one of 1.3
fem = multiphysics(fem); to 2.1 mm. Orientation angles of the main axis of
fem.xmesh = meshextend(fem); the ellipses were ±90° from the horizontal direction.
fem.sol = femlin(fem,’re- The model’s elastic properties, elastic modulus E and
port’,’off’); Poisson's ratio ν are given in Table 1.
figure Table 1
postplot(fem,’tridata’,’u’) Grid generation Elastic properties of the model elements
Structure elements E, GPa ν
This code corresponds to the generation of the Cement 1 0.2
structure in 2D space. Similarly, the generation in 3D
Grains 100 0.25
space can be carried out.
68MINING SCIENCE AND TECHNOLOGY (RUSSIA) eISSN 2500-0632
ГОРНЫЕ НАУКИ И ТЕХНОЛОГИИ https://mst.misis.ru/
2021;6(2):65–72 Voznesensky A. S., Kidima-Mbombi L. K. Formation of synthetic structures and textures of rocks...
In the simulation, the boundary conditions were In Fig. 2a, the areas with the minimum
set under which vertical displacements of the lower compressive stresses (in absolute magnitude) are
end were prohibited and the displacement of the marked in red. The compression stresses at the grain
upper end was 0.1 mm downward, corresponding to contacts are marked in yellow, green, and blue. The
the vertical compression of the specimen. areas of increased stresses, forming vertical chains,
The results of calculating the stresses in the are marked in yellow. The maximum value of normal
specimen are shown in Fig. 2a; Fig. 2b shows the curve vertical stress in the y = 0 cross-section (in absolute
of vertical normal stresses in the y = 0 cross-section. magnitude) reached 223.8 MPa, and the average stress
In this case, it was assumed that negative values in this cross-section amounted to 77.0 MPa. The ratio
corresponded to the compressive stresses. of the maximum to average stress was 2.91. Large
Surface: sy normal stress global sys. values of local stresses can cause destruction of the
Max: 3.195e7
Deformation: Displacement specimen’s internal structure. If the specimen had a
×108
0.035 structure with a homogeneous modulus of elasticity,
the compressive stresses averaged over the cross-
0.030 0
section would not cause such a rupture.
0.025
–0.5 2.3. Simulating horizontal fracturing
0.020 in a limestone specimen
0.015 –1.0 Another structure, simulating a system of frac-
tures of horizontal, vertical or oblique orientation with
0.010
–1.5 the angles in a given range, can also be formed from
0.005 ellipses. A system of elliptical fractures with a predo-
–2.0 minantly horizontal arrangement in a two-dimensio-
0
nal formulation of the problem is considered below.
–0.005 –2.5
The structure contained a network of elliptical
fractures, arranged as 15 horizontal and 10 vertical
–0.010
rows with an incline of ±40° relative to the horizontal
–3.0
–0.015 axis; the semi-major axis was 6 × 10⁻⁴ to 10.4 × 10⁻³ mm
and the semi-minor axis was 1.2 × 10⁻⁴ to 2.8 × 10⁻⁴ mm.
–0.020 –3.5
The deviations of the fracture centres from the uniform
–0.025 grid were ±4.9 mm horizontally and ±8 × 10⁻² mm
–4.0 vertically. The fractures were located in a rock specimen
–0.030 32×32×64 mm in size. When generating the size, incline
–0.035 –4.5 and position of the ellipse centres, a random number
–0.02 –0.01 0 0.01 0.02 generator with uniform distribution was used.
Min: –4.669e8 For the specimen of Cretaceous sediments, the rock
а conductivity was taken to be equal to the conductivity
of limestone σr = 10–4 Sm/m; the conductivity of water
0
σw = 10 Sm/m; and the oil conductivity was taken to be
1 × 10⁻⁹ Sm/m. The values of conductivity of the media
and the specimens are given in Table 2.
− 1×10 8 On the upper side of the specimen, a voltage of
100 V was set, relative to the lower side; the boundary
σ в, МПа
condition of the lower side corresponded to ground.
The simulation allowed us to obtain the distributions
− 2×10 8 of the local current on the upper side of the specimen.
In addition, in the course of the simulation, the lines
of the electric current density were plotted, and the
effective (averaged) specific electrical conductivity
− 3×10 8 (EC) of the specimen was determined.
− 0.02 − 0.01 0 0.01 0.02
x, м In the simulation, three cases were considered:
b 1) a homogeneous isotropic specimen without
Fig. 2. The simulated structure of a sandstone specimen fractures;
and distribution of vertical compressive stresses 2) a specimen with fractures filled with oil or air
over the volume (a) and in the y = 0 cross-section (b) with low conductivity, less than the cement matrix
of the specimen conductivity;
69MINING SCIENCE AND TECHNOLOGY (RUSSIA) eISSN 2500-0632
ГОРНЫЕ НАУКИ И ТЕХНОЛОГИИ https://mst.misis.ru/
2021;6(2):65–72 Voznesensky A. S., Kidima-Mbombi L. K. Formation of synthetic structures and textures of rocks...
Surface: Electric potential [V] Max: 100 Surface: Electric potential Max: 100 Surface: Electric potential Max: 100
Streamline: Total current density Streamline: Total current density Streamline: Total current density
100
0.035 0.035 100 0.035 100
0.030 90 0.030 0.030
90 90
0.025 0.025 0.025
80
0.020 0.020 80 0.020 80
0.015 70 0.015 0.015
70 70
0.010 0.010 0.010
60
0.005 0.005 60 0.005 60
0 50 0 50 0 50
–0.005 –0.005 –0.005
40 40 40
–0.010 –0.010 –0.010
–0.015 30 –0.015 30 –0.015 30
–0.020 –0.020 –0.020
20 20 20
–0.025 –0.025 –0.025
–0.030 10 –0.030 10 –0.030 10
–0.035 –0.035 –0.035
–0.02 –0.015 –0.01 –0.005 0 0.005 0.01 0.015 0.02 0 –0.02 –0.015 –0.01 –0.005 0 0.005 0.01 0.015 0.02 0 –0.02 –0.015 –0.01 –0.005 0 0.005 0.01 0.015 0.02 0
Min: 0 Min: 0 Min: 0
а b c
Fig. 3. Current flow lines for specimens: homogeneous isotropic (a);
with fractures filled with oil or air (b); with fractures filled with conducting saline water (c)
3) a specimen with fractures filled with saline Conclusions
water with high conductivity, greater than the matrix 1. The approach to the numerical simulation
conductivity. of heterogeneous structures containing elliptical
The calculated results are shown in Fig. 3 and inclusions generated from the Matlab programme, in
Table 2. conjunction with COMSOL Multiphysics (where finite-
The initial and simulated conductivities of the element simulation is performed), is quite effective.
media and specimens are presented in Table 2. 2. The possibilities of simulating sandstones
Table 2 containing high-modulus grain-inclusions placed in a
The conductivities of the media included in the model, cement matrix have been demonstrated. The solution
as well as the averaged conductivities of the specimens: of the problem of determining local stresses in a
homogeneous isotropic; with fractures filled with oil
or air; with fractures filled with conducting saline water
specimen with such a structure under uniaxial strain in
the direction of the longest side was considered. It was
Homogeneous Fractures, Fractures,
Medium shown that the local stresses significantly exceeded the
specimen oil saline water
Limestone 1 × 10 4 values averaged over the specimen’s cross-sectional
Fracture filling – 1 × 10⁻⁹ 1 × 101 width; elongated areas of increased stress were present,
Specimen 1 × 10 –4
4.304 × 10 –6
1.376 × 10⁻⁴ oriented along the straining direction.
3. As an example of a fractured structure analysis,
For the homogeneous isotropic limestone the influence of the filler on the electrical resistance
specimen in Fig. 3а, the current flow lines are linear of a limestone specimen, containing a system of thin,
and directed vertically. Following on from the data in elliptical, predominantly horizontal fractures was
Table 2, for this specimen, exactly the same value of considered. The change in the lines of current flow at
electrical conductivity was obtained for the rock, which different ratios between the matrix and the fracture
was taken when forming the model. filler conductivities and their effect on the effective
For the specimen with fractures filled with low-con- (averaged) conductivity of the rock specimen was
ductivity liquid or air (in Fig. 3b), the current flow lines clearly demonstrated. The lower conductivity of the
are bent, increasing the current path and decreasing the fracture filler leads to increased length and decreased
cross-section, that leads to decreasing the specimen’s cross-section of the current flow lines that, in turn,
effective conductivity by more than 10 times. leads to a significant decrease of the conductivity
For the specimen with fractures filled with of the fractured rock specimen. The higher filler
conducting saline water, the conductivity increases by conductivity results in slightly increased conductivity
almost 40% due to the partial flow of current through of the fractured specimen compared to that of the
the liquid. homogeneous isotropic specimen.
70MINING SCIENCE AND TECHNOLOGY (RUSSIA) eISSN 2500-0632
ГОРНЫЕ НАУКИ И ТЕХНОЛОГИИ https://mst.misis.ru/
2021;6(2):65–72 Voznesensky A. S., Kidima-Mbombi L. K. Formation of synthetic structures and textures of rocks...
References
1. Ivankina T. I., Matthies S. On the development of the quantitative texture analysis and its application
in solving problems of the Earth sciences. Physics of Particles and Nuclei. 2015;46:366–423. https://doi.
org/10.1134/S1063779615030077
2. Daryono L. R., Titisari A. D., Warmada I. W., Kawasaki S. Comparative characteristics of cement
materials in natural and artificial beachrocks using a petrographic method. Bulletin of Engineering Geology and
the Environment. 2019;78:3943–3958. https://doi.org/10.1007/s10064-018-1355-x
3. Nachev V. A., Kazak A. V., Turuntaev S. B. 3D digital mineral-mechanical modeling of complex
reservoirs rocks for understanding fracture propagation at microscale. In: Society of Petroleum Engineers – SPE
Russian Petroleum Technology Conference 2020, RPTC 2020. Society of Petroleum Engineers; 2020. https://doi.
org/10.2118/201979-MS
4. Sangirardi M., Malena M., de Felice G. Settlement induced crack pattern prediction through the jointed
masonry model. In: Carcaterra A., Paolone A., Graziani G. (eds.) Proceedings of XXIV AIMETA Conference 2019.
AIMETA 2019. Lecture Notes in Mechanical Engineering. Springer, Cham. 2020. https://doi.org/10.1007/978-3-
030-41057-5_158
5. Bradbury K. K., Davis C. R., Shervais J. W., Janecke S. U., Evans J. P. Composition, Alteration, and Texture
of Fault-Related Rocks from Safod Core and Surface Outcrop Analogs: Evidence for Deformation Processes and
Fluid-Rock Interactions. Pure and Applied Geophysics. 2015;172:1053–1078. https://doi.org/10.1007/s00024-
014-0896-6
6. Nikitin A. N., Ivankina T. I., Ullemeyer K., Vasin R. N. Similar quartz crystallographic textures in rocks of
continental earth’s crust (by neutron diffraction data): II. Quartz textures in monophase rocks. Crystallography
Reports. 2008;53:819–827. https://doi.org/10.1134/S1063774508050167
7. Abd Elmola A., Charpentier D., Buatier M., Lanari P., Monié P. Textural-chemical changes and
deformation conditions registered by phyllosilicates in a fault zone (Pic de Port Vieux thrust, Pyrenees).
Applied Clay Science. 2017;144:88–103. https://doi.org/10.1016/j.clay.2017.05.008
8. Allo F. Consolidating rock-physics classics: A practical take on granular effective medium models. The
Leading Edge. 2019;38(5):334–40. https://doi.org/10.1190/tle38050334.1
9. Hu X., Huang S. Physical Properties of Reservoir Rocks. In: Hu X., Hu S., Jin F., Huang S. (eds) Physics
of Petroleum Reservoirs. Springer Geophysics. Springer, Berlin, Heidelberg. 2017. https://doi.org/10.1007/978-
3-662-55026-7_2
10. Frischbutter A., Janssen C., Scheffzük C., Walther K., Ullemeyer K., Behrmann J. H., et al. Strain
and texture measurements on geological samples using neutron diffraction at IBR-2, Joint Institute for
Nuclear Research, Dubna (Russia). Physics of Particles and Nuclei. 2006;37:S45–S68. https://doi.org/10.1134/
S1063779606070033
11. Hudleston PJ, Lan L. Rheological information from geological structures. Pure and Applied Geophysics.
1995;145:605–620. https://doi.org/10.1007/BF00879591
12. Howarth D. F., Rowlands J. C. Development of an index to quantify rock texture for qualitative
assessment of intact rock properties. Geotechnical Testing Journal. 1986;9(4):169–179. https://doi.
org/10.1520/GTJ10627J
13. Howarth D. F., Rowlands J. C. Quantitative assessment of rock texture and correlation with drillability
and strength properties. Rock Mechanics and Rock Engineering. 1987;20:57–85. https://doi.org/10.1007/
BF01019511
14. Azzoni A., Bailo F., Rondena E., Zaninetti A. Assessment of texture coefficient for different rock types
and correlation with uniaxial compressive strength and rock weathering. Rock Mechanics and Rock Engineering.
1996;29:39–46. https://doi.org/10.1007/BF01019938
15. Kamani M., Ajalloeian R. Evaluation of Engineering Properties of Some Carbonate Rocks Trough
Corrected Texture Coefficient. Geotechnical and Geological Engineering. 2019 Apr 15;37:599–614. https://doi.
org/10.1007/s10706-018-0630-8
16. Ajalloeian R, Mansouri H, Baradaran E. Some carbonate rock texture effects on mechanical behavior,
based on Koohrang tunnel data, Iran. Bulletin of Engineering Geology and the Environment. 2017;76:295–307.
https://doi.org/10.1007/s10064-016-0861-y
17. Ömer Ü., Florian A. Influence of micro-texture on the geo-engineering properties of low porosity
volcanic rocks. In: Engineering Geology for Society and Territory – Volume 6: Applied Geology for Major Engineering
Projects. Springer International Publishing; 2015. P. 69–72. https://doi.org/10.1007/978-3-319-09060-3_12
18. Song R., Zheng L., Wang Y., Liu J. Effects of Pore Structure on Sandstone Mechanical Properties
Based on Micro-CT Reconstruction Model. Advances in Civil Engineering. 2020;2020: 9085045. https://doi.
org/10.1155/2020/9085045
19. Zhou J., Zhang L., Yang D., Braun A., Han Z. Investigation of the quasi-brittle failure of alashan
granite viewed from laboratory experiments and grain-based discrete element modeling. Materials (Basel).
2017;10(7):835. https://doi.org/10.3390/ma10070835
71MINING SCIENCE AND TECHNOLOGY (RUSSIA) eISSN 2500-0632
ГОРНЫЕ НАУКИ И ТЕХНОЛОГИИ https://mst.misis.ru/
2021;6(2):65–72 Voznesensky A. S., Kidima-Mbombi L. K. Formation of synthetic structures and textures of rocks...
20. Zhao X., Wang T., Elsworth D., He Y., Zhou W., Zhuang L., et al. Controls of natural fractures on
the texture of hydraulic fractures in rock. Journal of Petroleum Science and Engineering. 2018;165:616–626.
https://doi.org/10.1016/j.petrol.2018.02.047
21. Rahimi M. R., Mohammadi S. D., Beydokhti A. T. Effects of Mineral Composition and Texture
on Durability of Sulfate Rocks in Gachsaran Formation, Iran. Geotechnical and Geological Engineering.
2020;38:2619–2637. https://doi.org/10.1007/s10706-019-01173-9
22. Ozturk C. A., Nasuf E. Strength classification of rock material based on textural properties. Tunnelling
and Underground Space Technology. 2013;37:45–54. https://doi.org/10.1016/j.tust.2013.03.005
23. Wang L. Automatic identification of rocks in thin sections using texture analysis. Mathematical
Geology. 1995;27:847–865. https://doi.org/10.1007/BF02087099
24. Prince C. M., Ehrlich R. Analysis of spatial order in sandstones. I. Basic principles. Mathematical
Geology. 1990;22:333–359. https://doi.org/10.1007/BF00889892
25. Luthi S. M. Textural segmentation of digital rock images into bedding units using texture energy
and cluster labels. Mathematical Geology. 1994;26(2):181–196. https://doi.org/10.1007/BF02082762
26. Ye S. J., Rabiller P., Keskes N. Automatic high resolution texture analysis on borehole imagery. In:
SPWLA 39th Annual Logging Symposium 1998. Society of Petrophysicists and Well-Log Analysts (SPWLA); 1998.
27. Wang L. Automatic identification of rocks in thin sections using texture analysis. Mathematical Geology.
1995;27:847–865. https://doi.org/10.1007/BF02087099
28. Xiao H, He L, Li X, Zhang Q, Li W. Texture synthesis: A novel method for generating digital models
with heterogeneous diversity of rock materials and its CGM verification. Computers and Geotechnics.
2021;130:103895. https://doi.org/10.1016/j.compgeo.2020.103895
29. Algive L, Bekri S, Lerat O, Nader F, Vizika O. Reactive pore network modeling technology to evaluate the
impact of diagenesis on the petrophysical properties of a rock. In: Society of Petroleum Engineers – International
Petroleum Technology Conference 2009, IPTC 2009. 2009, pp. 3452–3461. https://doi.org/10.3997/2214-4609-
pdb.151.iptc14049
30. Kazerani T, Nilipour N, Garin E, Seingre G. Application of numerical modelling for large-scale
underground excavation in foliated rock mass. In: ISRM Regional Symposium, EUROCK 2015. International
Society for Rock Mechanics; 2015, pp. 931–936.
31. Coelho G., Branquet Y., Sizaret S., Arbaret L., Champallier R., Rozenbaum O. Permeability of sheeted
dykes beneath oceanic ridges: Strain experiments coupled with 3D numerical modeling of the Troodos
Ophiolite, Cyprus. Tectonophysics. 2015;644:138–150. https://doi.org/10.1016/j.tecto.2015.01.004
Information about the authors
Aleksandr S. Voznesensky – Doctor of Sciences (Engineering), Professor of the Department of Physical
Processes of Mining and of Geocontrol, National University of Science and Technology “MISiS” (NUST
“MISiS”), Moscow, Russian Federation; SPIN 5976-3030; ORCID 0000-0003-0926-1808; e-mail al48@mail.ru
Lemuel Ketura Kidima-Mbombi – PhD student, Department of Physical Processes of Mining and of
Geocontrol, National University of Science and Technology “MISiS” (NUST “MISiS”), Moscow, Russian
Federation
Received 11.05.2021
Revised 29.05.2021
Accepted 15.06.2021
72You can also read