QRishing: The Susceptibility of Smartphone Users to QR Code Phishing Attacks
←
→
Page content transcription
If your browser does not render page correctly, please read the page content below
QRishing: The Susceptibility of Smartphone
       Users to QR Code Phishing Attacks

         Timothy Vidas, Emmanuel Owusu, Shuai Wang, Cheng Zeng,
                 Lorrie Faith Cranor, and Nicolas Christin

                         Carnegie Mellon University
                           Pittsburgh, PA, USA
       {tvidas,eowusu,shuaiwang,chengzeng,lorrie,nicolasc}@cmu.edu

      Abstract. The matrix barcodes known as Quick Response (QR) codes
      are rapidly becoming pervasive in urban environments around the world.
      QR codes are used to represent data, such as a web address, in a com-
      pact form that can be scanned readily and parsed by consumer mobile
      devices. They are popular with marketers because of their ease in de-
      ployment and use. However, this technology encourages mobile users to
      scan unauthenticated data from posters, billboards, stickers, and more,
      providing a new attack vector for miscreants. By positioning QR codes
      under false pretenses, attackers can entice users to scan the codes and
      subsequently visit malicious websites, install programs, or any other ac-
      tion the mobile device supports. We investigated the viability of QR-
      code-initiated phishing attacks, or QRishing, by conducting two exper-
      iments. In one experiment we visually monitored user interactions with
      QR codes; primarily to observe the proportion of users who scan a QR
      code but elect not to visit the associated website. In a second experi-
      ment, we distributed posters containing QR codes across 139 different
      locations to observe the broader application of QR codes for phishing.
      Over our four-week study, our disingenuous flyers were scanned by 225
      individuals who subsequently visited the associated websites. Our survey
      results suggest that curiosity is the largest motivating factor for scanning
      QR codes. In our small surveillance experiment, we observed that 85% of
      those who scanned a QR code subsequently visited the associated URL.

      Keywords: Phishing, Mobile, Security, QR Code, Smartphone

1   Introduction
A Quick Response code (QR code) is a two-dimensional matrix of black and
white pixels [20] that can be used to store information in a compact and optically-
scannable form. QR codes have gained popularity due to their higher information
density and improved readability compared to one-dimensional barcodes. As the
number of smartphone users grows rapidly [8], businesses are turning to QR
codes en masse to provide a fun and simple way to direct smartphone users to
their websites and products. QR codes are designed to be readable regardless
of orientation and in cases where a code is partially damaged or masked. These
properties facilitate the use of QR codes in consumer applications to convey
information to users.
2       Vidas et al.

Fig. 1: Screen capture of the most popular “barcode scanner” on Android: ZXing.
With default settings, the URL is prominently shown to the user after scanning.

    QR codes are typically “scanned” by photographing the QR code using a
mobile device, such as a smartphone. The image is then interpreted by a QR
code reader that users may install as an application on their mobile device. The
reader decodes the message and performs an operation based on the message. For
example, if the encoded data contains a link to a mobile application download,
the reader may launch a marketplace application such as Google Play or Apple
App Store. The content represented by a QR code is often a hyperlink, and the
associated action is to launch the device’s web browser and visit the website
specified by the code.
    QR codes can be found on store-front windows, magazines, newspapers, web-
sites, posters, mass mailings, and billboards. Businesses display QR codes on ad-
vertisements to direct people to their websites. One study found over 14 million
U.S. mobile users scanning QR codes during June 2011 [26].
    The ease with which one can create and distribute QR codes has not only
attracted businesses, but also scammers seeking to direct people to phishing
websites. Phishing is a semantic attack that cons individuals, under the guise
of a legitimate organization or individual, into visiting a malicious website or
providing sensitive information [21]. With the increased usage of QR codes, QR
code phishing, or QRishing (phonetically: “krihsh-ing”), presents a threat to this
new, convenient technology. Concerns for the safety of QR codes are increas-
ing [11, 24, 26, 28]. An attacker might place a sticker of a QR code containing
malicious content over a legitimate QR code or create an entirely new QR code
advertisement masquerading as a legitimate entity.
    Some QR code reader applications may perform actions without first present-
ing the human-readable QR code content to the user. For example, an application
may automatically open a hyperlink in the device’s web browser without permit-
ting the user to first verify the hyperlink. In this case, it is easier for attackers
to deceive users into divulging private information or, even worse, installing ma-
licious software on their phones. On the other hand, if the barcode application
displays the URL to the user, an astute user may notice a suspicious-looking
URL. However, use of “URL shorteners” can make it more difficult for users to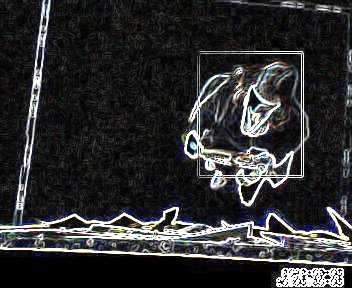
QRishing       3

evaluate a URL. Figure 1 depicts an application displaying the URL to the user
and awaiting further action by the user.
    To frame the scope of the problem, we tested the most popular reader applica-
tions from the Android and Apple marketplaces in January 2012. We downloaded
and tested the top ten free applications for “barcode scanner” from Google Play
and the Apple App Store. Thirty percent of these top ten free scanning applica-
tions in the Google Play Market and 50% in the Apple App Store immediately
visit a scanned URL in the default configuration. Tables showing the particular
applications and results can be found in the appendix.
    The purpose of this study is to measure the threat QR codes pose as a
phishing attack vector and to identify ways to improve the safety of QR code
interaction. We are interested in the behaviors of smartphone users when they
see QR codes posted in public places, including whether or not they look for
context around the QR code, scan the QR code, and visit the website from the
QR code.
    We further motivate the problem with related work in Section 2. The user
study consisted of two experiments: (1) A QRishing experiment and (2) a base-
line surveillance study of user interaction with QR codes, which we describe
in Section 3 and Section 4, respectively. Security implications of the study are
presented in Section 5 and conclusions in Section 6.

2   Related Work

Phishing is a type of semantic attack where the malicious party attempts to
gain sensitive information (e.g., account credentials or credit card numbers) by
baiting victims with communications and content that appears to be from a
legitimate party (e.g., a counterfeit password change website). Existing research
has repeatedly shown that typical computer users have difficulty distinguishing
between legitimate content and phishing content [14–16, 32]. QRishing is an
extension of phishing that utilizes QR codes.
    Downs et al. interviewed 20 non-expert computer users about their decision-
making process when they encountered suspicious looking emails [16]. Their
study suggests that simply being aware of Phishing-style scams is insufficient.
Furthermore, their findings suggest that providing message-specific contextual
cues (e.g., “this website is requesting a password”) may be more effective than
sender-specific cues, as scammers exploit the fact that many victims have a real
account with the entity that is being faked.
    The economic viability of typosquatting demonstrates the usefulness of mis-
spelled and misleading domain names [22]. The only technological controls cur-
rently available to counter QRishing rely on the user to identify questionable
URLs or involve cues from external tools, such as domain blacklisting services.
Such cues have previously been shown to be misunderstood by users [17] who
may not even understand the difference between positive and negative cues [14].
    Dhamija et al. found that nearly a quarter of their 22 participants did not use
browser-based cues (e.g., the address bar and status bar) leading to incorrect
identification of fraudulent websites [15]. We find similar results, in the case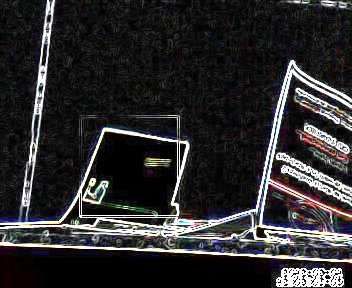
4      Vidas et al.

where QR codes are used as a medium for phishing – specifically, 36% of our
phishing participants indicated that they did not or could not recall checking
the link.
    The ease with which one can access web content via QR codes may induce
more users to ignore browser-based cues as compared to entering or follow-
ing a link. A typical QR code use case involves a scan and a click. Perceptive
and security-conscious users may pause to examine the hyperlink but, in gen-
eral, there is very little explicit interaction with the encoded data. The use of
shortened URLs and the limited screen space of smartphones further obscures
browser-based cues.
    Similar to other phishing work, non-technical controls, such as increasing
user education [27], may produce similar effects when applied to QRishing. A
combination of automated detection systems along with user education may
prove to be the best approach [21].
    The security and usability research communities have explored various pro-
posals for combating phishing attacks. Zhang et al. leveraged message-specific
contextual cues for automated phishing detection in their implementation of
CANTINA [32]. Dhamija et al. presented a defense against phishing attacks
that made use of trusted paths to prevent window spoofing and independently
computed images that allowed users to authenticate the remote party by visually
verifying that the expected image was received [14].
    Phishing and the effects of malware are perhaps more threatening on mobile
devices than on traditional computers. The management model, long patching
cycle, limited screen space, and myriad of input types and sensors found on
mobile devices make mobile oriented malware particularly distressing [19, 30].
    Concurrent to our research, an Internet vigilante claimed to have conducted
a QRishing attack by changing his Twitter icon to a QR code. This QR code
represented a shortened URL that ultimately led victims to a webpage that
reportedly hosted a WebKit browser exploit and secondary exploits for iOS and
Android devices. This five-day attack is claimed to have garnered 1200 victims
of which 500 successfully executed the secondary OS-specific payload [31].
    In addition to the claimed QRishing attack via Twitter, industry researcher
Eric Mikulas has recently presented work on QR code phishing attacks [29].
Following our study, Mikulas conducted a similar attack predominately using
small stickers to place QR codes around Pittsburgh, PA. Similar to our study,
these QR codes lead smartphone users to an informative website about QR code
risks. After posting 80 stickers and receiving fewer website visits than expected,
Mikulas said he plans to “attach them to fliers offering a false incentive or even
place his stickers on top of existing advertisements and QR codes.”

3   QRishing Experiment

The ease with which one can create and distribute QR codes may make them at-
tractive to scammers seeking to direct people to phishing websites. The purpose
of this study is to understand how users interact with QR codes in public spaces
and to assess the susceptibility of smartphone users to QRishing attacks. In this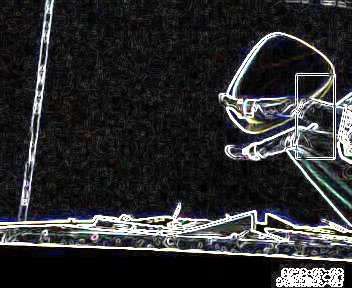
QRishing        5

  (a) qrcode only     (b) qrcode inst.     (c) qrcode SNS         (d) ripoff SNS

Fig. 2: An example flyer for each of the four conditions deployed in the QRishing
experiment. (a) shows qrcode only –flyers with a QR code. (b) shows qrcode in-
structions –flyers with a QR code and usage instructions. (c) shows qrcode SNS –
flyers advertising a mock SNS study with QR code. (d) shows ripoff SNS –flyers
advertising a mock SNS study with rip-off tabs.

experiment, we posted flyers around the city of Pittsburgh, PA. Each passerby
who scanned one of the flyers was directed to a a brief online survey.

3.1   Methodology
We posted flyers with QR codes both on the Carnegie Mellon University campus
and in public locations around Pittsburgh (e.g., at bus stops, public bulletin
boards at restaurants, coffee shops, etc). All flyers were posted in public locations
where flyers are routinely placed. Each QR code on a poster represented a unique
URL to our webserver, allowing us to unambiguously know in which location the
participant observed our flyer. We used random, unique URLs similar to popular
“URL shortening” services for each flyer. Such URLs are commonly used in
QR code advertising. Further, the use of random URLs minimizes the risk that
after scanning one flyer, curious participants could easily determine and visit
URLs associated with other flyers. In the last week of January and first week of
February 2012, we posted flyers at 139 different locations: 104 campus locations,
35 off-campus locations. Each flyer was checked weekly and, if needed, replaced.
This experiment had four conditions (pictured in Figure 2):
  – qrcode only. A flyer with only a QR code.
  – qrcode instructions. In addition to the QR code graphic, includes instruc-
    tions on how to use a QR code.
  – qrcode SNS. Innocuous flyer utilizing a QR code (a “social networking”
    user study advertisement).
  – ripoff SNS. A user study flyer similar to 3, but with traditional rip-off tabs
    instead of a QR code.
    All conditions were randomly distributed across the locations and ran simul-
taneously for four weeks. When a person scanned the QR codes (or visited the
URL on the rip-off tab), they were taken to our website where they were informed
about the experiment and prompted to participate in an optional survey.
    Conditions qrcode only and qrcode instructions did not have any advertised
function, thus any participant in these conditions is likely to have scanned the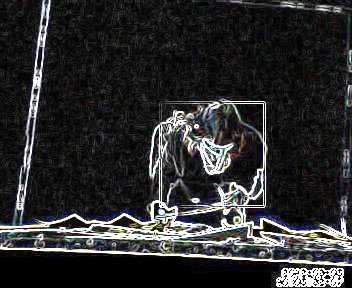
6      Vidas et al.

Fig. 3: Survey responses. Most participants scanned QR codes out of curiosity,
agree than QR codes are useful, read the URL prior to visiting the website, and
know the term “QR code.”

QR code out of curiosity, compulsion, fun, etc. Conditions qrcode only, qrcode in-
structions and qrcode SNS all involve the use of QR codes and thus provided
insight into the frequency with which QR codes on flyers are scanned. Without
a QR code, ripoff SNS served as a performance baseline to compare with the
other three conditions.
    Regardless of condition, upon visiting the URL, participants were notified of
the study via webpage and given the choice to follow a link to take an optional
survey. We also recorded the access time, IP address, and user-agent from the
server web log. Upon completion of the survey (or electing not to participate in
the survey) the participant was automatically taken to a debrief webpage for the
experiment. Participants who reported being under 18 years old were informed
that their data would not be used in research and we discarded associated data.

3.2   Results

Of the 139 posted flyers, 85 (61%) were utilized by participants to visit the
study website at least once, totaling 225 hits across all conditions. Examination
of source address, access time and poster location (URL) indicated that only once
did the same device scan a QR code twice. One hundred twenty-two participants
(54%) completed the optional survey. Seventeen participants started, but did not
complete the survey, and five participants self-reported to be under 18, and were
removed from the study.
    In the survey, participants were asked “Do you know what a QR code is?” The
majority (83%) of survey takers responded “Yes,” indicating some familiarity
with the technology. Even 51% of participants in ripoff SNS, which did not use
a QR code, answered “Yes,” further indicating that participants were aware of
the technology. We posit that although some smartphone users may not know
the term “QR code,” the majority of users know the function of a QR code when
presented with one.
    We also asked participants about the primary reason they chose to scan the
QR code (including an option for “I did not scan a QR code”). We observed far
more participants scanning the QR code out curiosity than for related informa-
tion. Figure 3 shows the distribution of survey responses from participants. More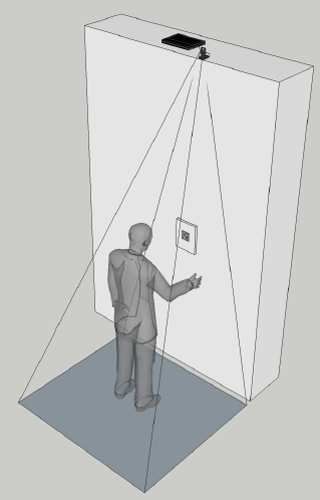
QRishing       7

Fig. 4: Mobile vs desktop users by     Fig. 5: Visited URLs and Survey
condition.                             Completion by condition

than 75% of the survey respondents scanned the flyer out of curiosity (64%) or
for fun (14%). Less than 4% claim to have scanned the QR code because the re-
lated information seemed useful. Twenty percent of the respondents indicate that
they did not scan a QR code, and all of these participants were in ripoff SNS.
As expected, participants not using a mobile device were also predominately in
the condition without a QR code, ripoff SNS, though not exclusively (Figure 4).
    Among the four conditions, qrcode only had the most participants while rip-
off SNS had the least number of participants. Figure 5 shows the distribution
of participants who both visited the URL and completed the survey across the
four conditions. While curiosity was reported to be the main reason for initially
scanning a QR code, participants were significantly more likely (χ2 = 8.7344, df
= 1, p = 0.003) to complete the survey in conditions that explicitly advertised
a study than those that had no advertised functionality.
    Fifty-eight percent of respondents report reading the URL prior to visiting
the link. While this behavior is likely safer than that of the 36% who did not
read the URL, they still visited an obscure URL to an unrecognized domain (we
registered the domain just prior to the study).
    Across all four conditions we found that men were at least 2.5 times more
likely to participate, especially in qrcode only where we observed more than 7.6
times as many male participants. While we are uncertain of exactly how many
individuals passed our flyers, nor how many of them possessed mobile devices, we
can approximate percentages based on demographic data for the respective areas.
For the on-campus flyers we can compare to CMU’s general population [25], and
for off-campus flyers we can compare to Pittsburgh census [12] data for the
area we posted flyers. Further, we can use market penetration data [4] [5] to
approximate percentages of smartphone owners. The gender distribution on-
campus is 63% male, 37% female [25], and off-campus in the Pittsburgh area
is 52% male, 48% female [12]. Among U.S. smartphone users, the gender is
distributed 47% male, 53% female [5]. The incumbent population suggests that
approximately 50–60% of our participants should be male, yet we observed 75%.
    The only condition that fell within the expected gender ratio was qrcode in-
structions. As shown in Figure 6, qrcode instructions has fewer male respondents
and more “Prefer not to answer” than the other three conditions. There is no
way to tell the gender of those who selected “Prefer not to answer.” While the
8 Vidas et al.
Fig. 6: Self-reported gender by con- Fig. 7: Poster performance by loca-
dition. qrcode instructions has fewer tion type. For each location type,
male and more “Prefer not to an- green bars show the number of fliers
swer” participants than any other posted, and yellow bars show accu-
condition. mulated clicks.
result is not statistically significant, it is clear that in our experiment qrcode in-
structions had more respondents who wished not to reveal their gender.
Our two most observed age ranges (on and off campus) were 18–24 and 25–
34, together accounting for 78% of our participants. This closely aligns with the
two age groups that have most adopted smartphones [4].
We found that flyers at bus stops far outperformed other locations. On aver-
age, flyers posted at bus stops solicited nearly seven URL visits per flyer. Figure 7
shows the distribution of off-campus flyers as grouped by bus stop, restaurant,
coffee shop and other. Flyers posted at bus stops may receive more attention
simply due to behavior at such a location. For example, those waiting for the
bus to arrive are likely bored and are forced to wait idly at the location for a
non-trivial duration.
We examined other metrics such as day-of-week, time-of-day, and user per-
ception of QR code usefulness, all of which did not prove useful as a predictor
of behavior. Additionally, we examined the networks from which devices were
connecting, and the results were as expected in the U.S. Of the cellular network
users 54% used Verizon Wireless, 31% AT&T, and 15% Sprint. The non-cellular
users primarily (63%) used campus networks while the primary home Internet
providers where Comcast (18%) and Verizon (6%).
3.3 Limitations
Unlike the envisioned attack scenario, we are bound by ethical, legal, and In-
stitutional Review Board limitations in the presentation and placement of QR
codes. A would-be attacker may have little consideration for vandalism, cov-
ering existing QR codes with his own, or any number of other less scrupulous
activities.
Like many on-campus studies, our observed population for on-campus flyers
is biased to the local population of CMU. Similarly, our off-campus flyer loca-
tions were subject to the respective populations in Pittsburgh and may not be
representative of other areas.
In qrcode SNS and ripoff SNS, the “social networking user study,” the fly-
ers will have only attracted individuals interested in such a study. Other falseQRishing 9
pretenses could have been employed, such as a local band or work-from-home
opportunities, but would have similarly limited the set of individuals attracted
to the flyer.
In our experiments we used “shortened URLs,” which have their own security
implications [23]. It is possible that users may be more likely to follow a typical
URL, but we felt that using a shortened URL exhibited more realistic conditions
as shortened URLs are often used in QR code advertisements. The short property
of shortened URLs also fits nicely with mobile devices as the limited screen space
will cause many URLs to be truncated for display, resulting in the user only
having the ability to observe part of the URL. Further, we wanted seemingly
random URLs so that users could not easily predict the URL of a poster they
had not physically encountered.
Particular to ripoff SNS, participants may have been less likely to correctly
type or may have had less desire to participate in the study due to the URL
format. The URLs used in all conditions were similar to those found in popular
URL shortening services (e.g., http://bit.ly, http://goo.gl). Such a random
pattern (e.g., skx0r132) may be perceived differently by participants than a link
consisting of a domain name and a common webpage naming convention (e.g.,
study.php).
4 Surveillance Experiment
Since QR codes are abundant in urban areas, we wanted to observe how people
interact with them in public spaces. Specifically, we wanted to identify how
many participants would scan the QR code and also visit the associated website
versus the number of participants who would scan the QR code but elect not to
visit the website. This observation provides insight about the potential for QR
codes as a phishing attack vector because examining the URL is a practical and
effective defense against many phishing threats. The use of QR codes minimize
the person’s effort in obtaining a URL; the person does not have to manually
transcribe the URL from the source material. Such reduced interaction may
encourage the unsafe behavior of visiting a questionable website without seeing
the URL, sacrificing security in favor of usability.
This section describes the methodology, experimental design, and analysis of
the surveillance experiment. We refer to this experiment as surveillance exp in
the subsequent text.
4.1 Methodology
We posted a flyer containing a QR code on a bulletin board at Carnegie Mel-
lon University and placed it under video surveillance. By comparing captured
video footage of people scanning the QR code with server logs, we were able to
identify the number of participants who scanned the code as well as the num-
ber of participants who actually visited the URL encoded in the QR code. If a
corresponding entry did not exist on the server we assumed that the participant
scanned the QR code, but chose not to visit the website. The experiment had
two conditions: an incentive condition and a no-incentive condition.10 Vidas et al.
– surv qrcode only. In the no-incentive case, we collected two weeks of footage
using a flyer containing only a QR code, similar to Figure 2(a).
– surv incentive. Following the incentive case, we collected two additional
weeks of footage using a flyer offering the chance to win a $50 Amazon gift
card.
The sequence of events a participant followed in both conditions is as follows.
First, a person who walks by the bulletin board noticed our flyer. They became
a participant in our study when they entered the field of view of the camera and
scanned the QR code. If the participant chose to visit the website (or the reader
application automatically opened the link), they were presented with a simple
web page that thanked the person for their interest in the study and asked
them to take a survey. The person may have selected “continue” to further
participate by taking an online survey, selected “cancel” to continue directly
to the debrief material, or simply elected to close the browser. Similar to the
qrishing exp experiment, participants who reported that they were under the
age of 18 received an additional debrief message stating that their data would
not be used in the study and that they were not eligible to receive the incentive.
Every time a participant accessed our secure server, we recorded the time
of access, the IP address, and user-agent in the web server log. The IP address
was used to assess the connection type (e.g., campus Wi-Fi). Participants in
surv incentive were asked to provide their email address in order to be notified
in the event they won the gift card. Providing an email address was at the sole
discretion of participant. Furthermore, we ensured that a participant’s email was
not correlated with her survey responses.
4.2 Data Capture
We posted a flyer containing a QR code in the Gates Center for Computer Sci-
ence on CMU’s Pittsburgh campus. The flyer was posted on an announcements
board located on the main floor of the building, an area which is open to the
public and access-controlled only at night. A camera and netbook were mounted
above the board to capture the activity of people around the poster. We checked
the flyer daily to ensure it was unobstructed and that there were no other QR
codes nearby. After some field trials at the site using both Android and iPhone
smartphones, we concluded that a 3-by-3 inch QR code would best ensure the
participant was within the field of view of the camera.
The netbook was configured to capture data only when motion was detected.
The camera recorded four frames per second for as long as there was motion,
and for 60 seconds thereafter. Each time a picture was captured, it was imme-
diately processed with an edge-detection algorithm in order to minimize storing
more data than required by the experiment and to protect the privacy of the
participant. The experiment configuration is depicted in Figure 8.
An example of data captured from one participant’s interaction is shown in
Figure 9. This figure shows a participant approaching the flyer, photographing
the flyer, and leaving the experiment area.QRishing 11
(a) Front (b) Above
Fig. 8: Surveillance experiment equipment configuration. The camera and net-
book are mounted on the area above the announcements board. The box around
the person represents the field of view of the camera. (a) shows the setup from
the front, facing the board. (b) shows an isometric view from above.
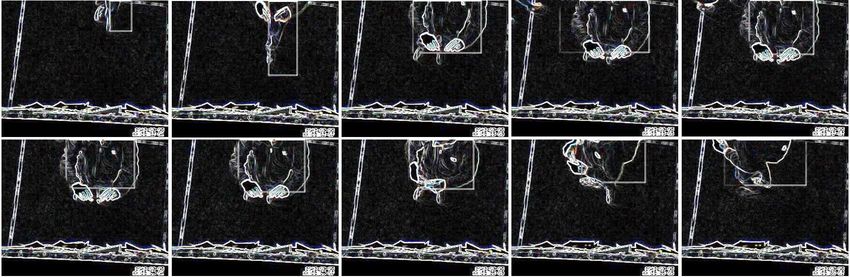
Fig. 9: A participant photographing the flyer posted on the bulletin board at the
bottom of each frame. The sequential progression is from left-to-right and top-
to-bottom. The rectangles that overlay the participant indicate software motion
detection. Each frame is processed using an edge-detection algorithm in order to
minimize capturing more data than required by the experiment and to protect
the privacy of the participant.
4.3 Removing False Positives
Due to the sensitivity of the software motion detection and the communal nature
of the experiment site, the vast majority of collected images are not imminently
useful. In many cases, passersby will briefly trigger data capture, people will
move chairs into the field-of-view or otherwise congregate or loiter. Our flyer was
secured at each corner with thumb-tacks, however other flyers may have been
secured only at the top leading to some circumstances where activity outside of
camera view caused flyers to move. The situation most apt to provide a false
positive is when a subject appears to be facing the flyer, but it is not clear if
the subject is actually photographing the flyer. By examining such situations in
context with time-adjacent images, we are able to identify unrelated activities,
such as posting or retrieving a flyer unrelated to our study. Examples of each
of these false positives are provided in Figure 10. The captured images provide
enough fidelity to accurately determine which should be discarded from analysis.12 Vidas et al.
(a) Foreign object (b) External effects (c) Possible partici- (d) Posting an un-
(wind) pant related flyer
Fig. 10: The communal nature of the experiment site encourages inhabitants to
loiter, as seen in (a) where an individual has moved a chair into the experiment
area and relaxed. (b) depicts nearby “wind” which occasionally caused nearby
flyers to trigger motion detection. From the frame shown in (c), it is difficult to
discern if the person in is scanning the flyer or not. However with the additional
context of time-adjacent frames, it is obvious that the person is searching for
the best location to post a flyer unrelated to the study. The posting, (d), is
performed several seconds after (c).
4.4 Results
We collected data for four weeks beginning February 7, 2012, two weeks using
the surv qrcode only display (10 participants) followed by two weeks using the
surv incentive display (two participants). We conducted a follow-on experiment
by re-posting surv qrcode only for two more weeks (six participants) at which
point we could no longer use the location. From video analysis we determined
that three individuals likely scanned the QR code, but elected not to visit the
URL. Of these three individuals, one was from the surv incentive, one was from
the surv qrcode only and one was from the follow-on no incentive condition. In
our study 85% (15/18) of people that scanned a QR code proceeded to visit the
website, however our results may not be representative of a larger population.
Nine participants visited the URL in the surv qrcode only (plus five more in the
follow-on), and only one in surv incentive. This ratio suggests that the incentive
may not have actually enticed the participants to scan the QR code. Moreover,
more people scanned the poster in the follow-on than in surv incentive, further
re-enforcing the tendency to scan the no incentive condition.
Five participants, all in the surv qrcode only, started the survey. Of these
five, one was under 18 and discarded, another selected “Prefer not to answer”
and “Neutral” for every question. The remaining three participants were all
students of age 18-24, two male and one female. Of these three, two completed
the survey. Interestingly, one answered the question “How often do you scan a
QR code?” with “Every time I see one” while the other answered “Rarely.” The
devices of the nine participants include four iPhones, four Android devices, and
one BlackBerry.
4.5 Limitations
This experiment was conducted in a single, on-campus location, limiting results
to a single population. The location was in the computer science building, leadingQRishing 13
to a relatively technologically-sophisticated population. The location was near a
primary walking path and near a coffee shop, both of which contribute to a wider
demographic, but the single location certainly has population bias. Further, the
participant pool may have degraded between conditions, since the same location
was used for both conditions. For example, participants may not scan a new
poster, anticipating that the new poster is part of the same study.
Another technical limitation was the subjectivity in determining whether a
person scanned the QR code. If a correlated entry appeared in the server logs,
the person certainly scanned the QR code. However, without the server log entry,
we are forced to decide whether the images indicate that a person scanned the
QR code. As shown in the results, nearly all (85%) of people who scanned the
code also visited the website leaving 15% subject to scrutiny. None-the-less,
the analysis is subjective and it is possible that some instances may have been
misclassified.
5 Security Implications
Unsurprisingly, of the 229 participants we observed, more than 80% (184) used
a mobile device in our studies. Contrary to national metrics from around the
time of our study showing an Android majority [9] [4], we observed 57% (105)
using an Apple iOS device and 38% (69) using an Android based device (the
remaining five percent used Blackberry and Windows mobile devices). Given
that the majority used either an iOS or Android device, it is also no surprise
that of the mobile clients, 96% of browsers are WebKit based. Figure 11 shows
user-agent distribution for the measured devices.
Fig. 11: Observed user-agent and mobile vs desktop browser distribution.
At the time of this research, known vulnerabilities and public exploits existed
that target the WebKit browser directly [6] [1] or a content handler (such as PDF
files [2]) for all Android and iOS devices observed in this study. In order to take
advantage of such vulnerabilities, an attacker must persuade the user to visit
a web site serving malicious content, possibly using a QR code. A successful14 Vidas et al.
attack will result in the attacker having remote access to the same resources as
the browser.
In many cases, executing in the same context as the browser may be enough
to achieve attack objectives such as reading browser cookies or stealing website
passwords. Other attack objectives require more privileged access. This elevated
access is often referred to as “rooting” or “jailbreaking” the mobile device. Root-
ing exploits are often very dependent on the operating system version.
We observed the operating system distribution for iOS and Android devices.
The fragmentation present for Android is consistent with what has been reported
in the literature and by Google [7, 18, 30].1 We observed nine different iOS ver-
sions, but greater than 80% (89) of iOS devices were running the most recent,
5.0.1. In Android we observed 11 different iOS versions, and no single version
was present on more than 30% of devices. The two versions with the highest
percentage of devices were 2.3.3(18%) and 2.3.4 (27%), neither of which were
the most current software within an Android branch at the time of the study
(in this case 2.3.7). Rooting exploits not requiring physical device access were
publicly available at the time [13] [3] for 83% (59) of Android and 17% (19) of
iOS devices we observed.
Compared to the actions required from an unscrupulous attacker, conducting
our study demanded significantly more effort. For example, we spent considerable
time ensuring that flyers at all locations were available. Since each location
required a unique flyer, we tracked which specific flyers were posted so that
the distribution of conditions and specific URLs were maintained throughout
the experiment. Similarly, our exposure was limited to locations where we were
ethically and legally permitted to post QR codes. A would-be attacker does not
have such problems, permitting the attacker to expend significantly less time and
receive significantly more exposure when compared to this study. For this reason,
our findings should be considered an extreme lower bound on the susceptibility
of QRishing.
In many cases QRishing would be conducted physically, meaning that an
attacker would have to find some way to post QR codes where a user might
approach and scan the code. The physical format of QRishing could be realized
in many forms: full posters, sticker overlays, etc. In our study we simply posted
disingenuous flyers. When compared to digital forms of phishing, such as email,
the cost of performing a QRishing attack is likely comparatively high. The cost
of printing QR codes is negligible, but it takes time to post them and other
risks, such as being physically caught placing a malicious QR code, represent
considerable potential cost. On the other hand, an attacker, unbound by legal
and ethical issues, can place QR codes in a wider range of places than we were
permitted.
Mobile browsers are largely not employing technical controls that have been
available in desktop browsers for some time. For instance, technical controls may
be used to assist the user in making security-conscious decisions. Some reader
applications already display the QR code content prior to performing an action,
1
Google’s self-reported numbers [7] are grouped less precisely than ours. But when
we group ours accordingly, they align closely.QRishing 15
such as visiting a website. While this simple action requires the user to “click one
more button,” the opportunity to at least assess the potential for a questionable
domain is beneficial. This could be augmented with security-specific controls
that are already ubiquitous in desktop browsers such as comparing the scanned
URL to a blacklist or some other “safe browsing” technology.
Security indicators for valid certificates and SSL/TLS connections are widely
adopted by desktop-browser vendors and allow consumers to assess the security
of their communications over the web. However, the deployment of technical
controls and security indicators to mobile browsers is complicated by the rela-
tively small screen real estate for handheld devices. In an empirical study of ten
mobile browsers and two tablet browsers, Amrutkar et al. find that many of the
World Wide Web Consortium’s (W3C) guidelines for security indicators in web
user interfaces are not implemented on mobile browsers and that there is little
consistency among mobile browsers that do implement security indicators [10].
Another technological control specific to smartphones is to enable timely ap-
plication of security updates to mobile browsers and core device software. Feature
updates could be separated from security updates. The separation would allow
security updates to be applied quickly and independently of feature updates,
allowing economic motivations to drive the release (or not) of feature updates.
This control does not specifically address the threat of QR codes, but can mit-
igate the subsequent threats posted by the malicious websites. Similarly, if the
browser was a self-contained component, similar to other mobile applications, it
could be updated independent of the core software of the device. In this light,
alternative browsers such as Firefox mobile, provide a method to use an updated
browser on old devices where system software is no longer updated.
6 Conclusion
We presented two experiments demonstrating that QR codes are a viable method
for conducting phishing attacks. We posted QR code posters across 139 different
locations and found that 225 individuals scanned at least one poster over a four-
week period. Overall, 61% of the disingenuous posters were scanned by at least
one person.
Most users (75%) scanned the QR code out of curiosity or for fun. Compar-
atively, very few scanned in order to solicit more information about the context
surrounding the QR code. The results of our surveillance experiment indicate
that most users who scan a QR code will subsequently visit the related URL,
even if the domain is unfamiliar and uses “URL shortener” style URLs. Provid-
ing security controls that already exist in desktop browsers to mobile browsers
may foster safer behavior than what we observed in this study.
While a QRishing attack likely requires more resources than a typical email
oriented phishing attack, the cost of conducting a QRishing attack is negligible.
However, indirect costs, such as physically being caught, present considerable ad-
ditional risk over traditional phishing mechanisms. None-the-less, if the attacker
wishes to target a particular audience, such as smartphone users, QRishing may
be a viable option. The ease with which such an attack can be mounted against16 Vidas et al.
current smartphones is particularly concerning given the long patching cycle and
potential for an attacker to gain elevated privileges on the device. With or with-
out the security-specific controls, user awareness of new threats like QRishing
will be critical as mobile devices become increasingly popular.
References
1. About the security content of iOS 4.3. http://support.apple.com/kb/HT4564,
Mar. 2011.
2. About the security content of iOS 5.0.1. http://support.apple.com/kb/HT5052,
Nov. 2011.
3. CVE-2011-3874 - libsysutils rooting vulnerability (zergRush). http://code.
google.com/p/android/issues/detail?id=21681, Nov. 2011.
4. Generation app: 62% of mobile users 25-34 own smartphones. http://blog.
nielsen.com/, Nov. 2011.
5. The Male vs. Female Debate Goes Mobile. http://blog.compete.com, Nov. 2011.
6. Android bug opens devices to outside control: experts. http://www.reuters.com/
article/2012/02/24/us-google-android-security-idUSTRE81N1T120120224,
Feb. 2012.
7. Android Developer Guide: Platform Versions (Feb 1, 2012). http://developer.
android.com, Feb. 2012.
8. Cisco Visual Networking Index: Global Mobile Data Traffic Forecast Update
20112016. White Paper: http://www.cisco.com/en/US/solutions/collateral/
ns341/ns525/ns537/ns705/ns827/white_paper_c11-520862.html, Feb. 2012.
9. comScore Reports December 2011 U.S. Mobile Subscriber Market Share.
http://www.comscore.com/Press_Events/Press_Releases/2012/2/comScore_
Reports_December_2011_U.S._Mobile_Subscriber_Market_Share, Feb. 2012.
10. C. Amrutkar, P. Traynor, and P. C. van Oorschot. An Empirical Evaluation of Se-
curity Indicators in Mobile Web Browsers. Technical Report GT-CS-11-10, Georgia
Institute of Technology, 2011.
11. L. Borrett. Beware of Malicious QR Codes. http://www.abc.net.au/technology/
articles/2011/06/08/3238443.htm, June 2011.
12. U. C. Bureau. Pittsburgh census map. http://www.city.pittsburgh.pa.us/cp/
html/census_map.html, 2000.
13. chpwn, MuscleNerd, and chronicdevteam. iOS Jailbreaking Website. http://
jailbrea.kr/.
14. R. Dhamija and J. Tygar. The battle against phishing: Dynamic security skins. In
Proceedings of SOUPS 2005, pages 77–88. ACM, 2005.
15. R. Dhamija, J. Tygar, and M. Hearst. Why phishing works. In SIGCHI conference
on Human Factors in computing systems, pages 581–590. ACM, 2006.
16. J. Downs, M. Holbrook, and L. Cranor. Decision Strategies and Susceptibility to
Phishing. In Proceedings of SOUPS 2006, pages 79–90. ACM, 2006.
17. S. Egelman, L. Cranor, and J. Hong. You’ve been warned: an empirical study
of the effectiveness of web browser phishing warnings. In SIGCHI conference on
Human factors in computing systems, pages 1065–1074. ACM, 2008.
18. A. Gahran. Why ‘Android fragmentation’ isn’t so bad. http://www.cnn.com/
2012/02/17/tech/mobile/android-fragmentation-gahran/, Feb. 2012.
19. J. Han, E. Owusu, T.-L. Nguyen, A. Perrig, and J. Zhang. ACComplice: Loca-
tion Inference using Accelerometers on Smartphones. In Proceedings of the 4th
COMSNETS, Jan. 2012.QRishing 17
20. M. Hara, M. Watabe, T. Nojiri, T. Nagaya, and Y. Uchiyama. Optically readable
two-dimensional code and method and apparatus using the same, Mar. 10 1998.
US Patent 5,726,435.
21. P. Kumaraguru, S. Sheng, A. Acquisti, L. Cranor, and J. Hong. Teaching Johnny
not to fall for phish. ACM Transactions on Internet Technology, 10(2):7, 2010.
22. T. Moore and B. Edelman. Measuring the perpetrators and funders of typosquat-
ting. Financial Cryptography and Data Security, pages 175–191, 2010.
23. A. Neumann, J. Barnickel, and U. Meyer. Security and privacy implications of
url shortening services. In Proceedings of the Workshop on Web 2.0 Security and
Privacy, 2010.
24. R. Newman. Consumer Alert: QR Code Safety. Better Business Bureau.
http://sandiego.bbb.org/article/consumer-alert-qr-code-safety-28037,
June 2011.
25. Office of Institutional Research and Analysis. Carnegie mel-
lon factbook. http://www.cmu.edu/ira/factbook/pdf/facts2012/
entire-fb-for-web-as-of-3-1-121.pdf, Feb. 2012.
26. S. Radwanick. 14 Million Americans Scanned QR Codes on their Mobile Phones
in june 2011. http://www.comscore.com, Aug. 2011.
27. S. Sheng, B. Magnien, P. Kumaraguru, A. Acquisti, L. Cranor, J. Hong, and
E. Nunge. Anti-phishing phil: The design and evaluation of a game that teaches
people not to fall for phish. In Proceedings of SOUPS 2007. ACM, 2007.
28. C. Tamir. AVG (AU/NZ) Cautions: Beware of Malicious QR Codes. PCWorld.
https://appsec-labs.com/blog/tag/qrcode, June 2011.
29. D. M. Todd. Security expert warns smartphone users of the risks in scanning
cybercoding. http://www.post-gazette.com. Accessed, June 2012.
30. T. Vidas, D. Votipka, and N. Christin. All your droid are belong to us: A survey of
current android attacks. In Proceedings of the 5th USENIX WOOT, pages 10–10.
USENIX Association, 2011.
31. P. Wagenseil. Anti-anonymous hacker threatens to expose them. http://www.
msnbc.msn.com. Accessed, Mar. 2012.
32. Y. Zhang, J. Hong, and L. Cranor. Cantina: a content-based approach to detecting
phishing web sites. In Proceedings of the 16th international conference on World
Wide Web, pages 639–648. ACM, 2007.18 Vidas et al.
Appendix
No. Application [Vendor] Auto No. Application [Vendor] Auto
Visit Visit
1 Barcode Scanner [Versolab] no 1 Barcode Scanner [ZXing] no
2 ShopSavvy (Barcode and QR Scan- yes 2 ShopSavvy Barcode Scanner yes
ner) [ShopSavvy, Inc.] [ShopSavvy, Inc.]
3 RedLaser Barcode and QR Scanner no 3 QuickMark Barcode Scanner no
[eBay, Inc.] [SimpleAct, Inc.]
4 ScanLife Barcode and QR Reader yes 4 RedLaser Barcode and QR Reader no
[Scanbuy, Inc.] [eBay Mobile]
5 AT&T Code Scanner [AT&T Inc] no 5 ScanLife Barcode and QR Reader yes
6 pic2shop - Barcode Scanner no [Scanbuy, Inc.]
[Vision Smarts] 6 Barcode scanner [george android] no
7 Bakodo - Barcode Scanner no 7 i-nigma Barcode Scanner yes
[Dedoware, Inc] [3G Vision]
8 NeoReader - QR reader yes 8 AT&T Code Scanner no
[NeoMedia Technologies, Inc] [AT&T Service, Inc.]
9 i-nigma QR Code scanner yes 9 ixMAT Barcode Scanner no
[3GVision] [ixellence.com]
10 MOBILETAG - Barcode Scanner yes 10 BARCODE SCANNER no
[Mobile Tag] [Jet Ho]
(a) iOS Applications (b) Android Applications
Table 1: QR code reader applications tested. Five of the top ten free iOS ap-
plications and three of the top ten free Android applications automatically visit
URLs scanned from QR codes.
Many mobile devices do not have any QR code reading software pre-installed.
Tables 1(a) and 1(b) show the specific applications tested, whether the appli-
cation automatically visits a URL retrieved from a barcode, and the order (top
to bottom) of popularity on March 8, 2012. Several of the most popular iOS
applications were either not free, or did not scan QR codes. We did not test any
applications that were not free. Thirty percent of these top ten free scanning
applications in the Google Play Market and 50% in the Apple App Store im-
mediately visit a scanned URL in the default configuration. When applications
employ this feature, the user has no opportunity to visually inspect the URL
prior to visiting that URL.You can also read