Quantifying Sweet Taste Liker Phenotypes: Time for Some Consistency in the Classification Criteria - MDPI
←
→
Page content transcription
If your browser does not render page correctly, please read the page content below
nutrients
Article
Quantifying Sweet Taste Liker Phenotypes: Time for
Some Consistency in the Classification Criteria
Vasiliki Iatridi 1, *, John E. Hayes 2,3          and Martin R. Yeomans 1
 1   School of Psychology, University of Sussex, Falmer BN1 9QH, UK; martin@sussex.ac.uk
 2   Department of Food Science, College of Agricultural Sciences, The Pennsylvania State University,
     University Park, PA 16802, USA; jeh40@psu.edu
 3   Sensory Evaluation Center, College of Agricultural Sciences, The Pennsylvania State University,
     University Park, PA 16802, USA
 *   Correspondence: V.Iatridi@sussex.ac.uk; Tel.: +44-1273-67-8916

 Received: 17 December 2018; Accepted: 4 January 2019; Published: 10 January 2019

 Abstract: Taste hedonics is a well-documented driver of food consumption. The role of sweetness in
 directing ingestive behavior is largely rooted in biology. One can then intuit that individual differences
 in sweet-liking may constitute an indicator of variations in the susceptibility to diet-related health
 outcomes. Despite half a century of research on sweet-liking, the best method to identify the distinct
 responses to sweet taste is still debated. To help resolve this issue, liking and intensity ratings for
 eight sucrose solutions ranging from 0 to 1 M were collected from 148 young adults (29% men).
 Hierarchical cluster analysis (HCA) revealed three response patterns: a sweet-liker (SL) phenotype
 characterized by a rise in liking as concentration increased, an inverted U-shaped phenotype with
 maximum liking at 0.25 M, and a sweet-disliker (SD) phenotype characterized by a decline in liking
 as a function of concentration. Based on sensitivity and specificity analyses, present data suggest the
 clearest discrimination between phenotypes is seen with 1.0 M sucrose, where a liking rating between
 −15 and +15 on a −50/+50 scale reliably distinguished individuals with an inverted U-shaped
 response from the SLs and the SDs. If the efficacy of this approach is confirmed in other populations,
 the discrimination criteria identified here can serve as the basis for a standard method for classifying
 sweet taste liker phenotypes in adults.

 Keywords: sweet taste; hedonics; sweetness; taste test; individual differences; classification method

1. Introduction
      Hedonic responses to taste stimuli are dissociable construct from motivation or a desire to
eat (i.e., “liking” vs. “wanting”) as proposed by Berridge [1], and these responses influence dietary
intake [2–4]. Elsewhere, a conceptual model linking sensation to intake via affective/hedonic responses
has also been proposed [5]. Under these models, it is highly plausible that interpersonal variations in
hedonic responses to sweet taste—in conjunction with genetic and epigenetic inputs, environmental
forces, and other acquired individual characteristic—may contribute to variations in the susceptibility
for obesity and obesity-related diseases. For almost half a century, observations of distinct individual
liking patterns to sweet taste stimuli have repeatedly been made, thereby challenging the widespread
belief that sweetness is universally highly liked. Witherly and colleagues, for example, speculated
that humans exhibit up to four distinguishable responses to various sweetened beverages [6], which,
as was also illustrated later by Drewnowski [7], could be described as a rise in liking with increasing
sweetener concentration followed by a decline (Type I), a rise and then a plateau (Type II), a monotonic
decline (Type III), and a non-systematic change in liking (Type IV).

Nutrients 2019, 11, 129; doi:10.3390/nu11010129                                www.mdpi.com/journal/nutrients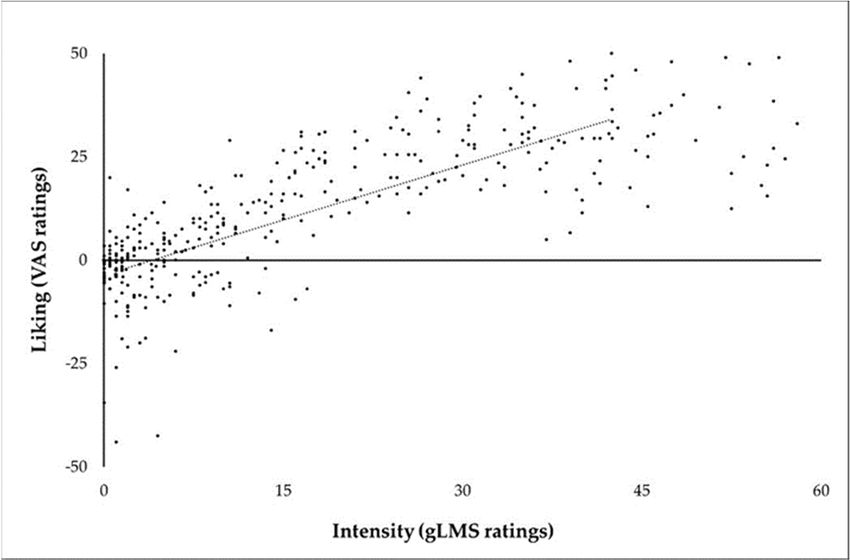
Nutrients 2019, 11, 129 2 of 24
Nutrients 2019, 11, x FOR PEER REVIEW 2 of 25
Since
Since thethe pioneering
pioneeringwork workofofPangborn
Pangborn [8],
[8], sensory
sensory scientists
scientists using
using simple
simple sucrose
sucrose solutions
solutions and
and
multiple different scaling methods in laboratory settings have similarly identified at least four
multiple different scaling methods in laboratory settings have similarly identified at least four
different
different sweet
sweettaste
tasteliker
likerphenotypes.
phenotypes.As Assummarized
summarized inin
Figure
Figure1, the associated
1, the associated response
response patterns are
patterns
characterized by either a positive slope, a horizontal (“flat”) slope, an inverted
are characterized by either a positive slope, a horizontal (“flat”) slope, an inverted U-shape, or a U-shape, or a negative
slope.
negative Simpler
slope. schemes
Simpler also exist,also
schemes where participants
exist, are dichotomized
where participants into sweetinto
are dichotomized likers (SLs)likers
sweet and
sweet
(SLs) anddislikers
sweet (SDs). The SL
dislikers phenotype
(SDs). The SL(sometimes
phenotypereported
(sometimes as the Type II phenotype)
reported as the Typegenerally refers
II phenotype)
to liking for ever-higher sweetness (e.g., in References [9,10]) and accounts for 48.5%
generally refers to liking for ever-higher sweetness (e.g., in References [9,10]) and accounts for 48.5% of the published
literature [11]. In contrast,
of the published literaturethe[11].
SD phenotype,
In contrast,which the SDshares a very similar
phenotype, which distribution
shares a very (48.2%) with
similar
the SL phenotype [11], has been defined differently across various studies:
distribution (48.2%) with the SL phenotype [11], has been defined differently across various studies:it can describe either as
a monotonically decreasing liking as sucrose concentration increases (e.g.,
it can describe either as a monotonically decreasing liking as sucrose concentration increases (e.g., in in References [12,13]),
or a liking [12,13]),
References for moderate levels
or a liking for of sweetness,
moderate levelswhich is graphically
of sweetness, which ispresented
graphically as presented
an inverted U
as an
(e.g., in Reference [14]) and sometimes also called Type I phenotype (e.g.,
inverted U (e.g., in Reference [14]) and sometimes also called Type I phenotype (e.g., in References in References [15,16]).
To note, aTo
[15,16]). few studies
note, a few identifying both subtypes
studies identifying bothofsubtypes
the SD response
of the SD pattern classified
response pattern them into a single
classified them
group reported
into a single as SD
group phenotype,
reported as SDasphenotype,
well (e.g., inas References
well (e.g., in [17,18]).
References [17,18]).
Figure 1. Graphical
Graphicalrepresentation
representationofofthethe
most commonly
most commonly reported
reported sweet tastetaste
sweet likerliker
phenotypes. The
phenotypes.
green
The line line
green corresponds to atophenotype
corresponds a phenotype characterized byby
characterized a arise
riseininliking
liking with
with increasing
increasing sucrose
concentration (e.g., sweet liker phenotype), yellow line illustrates an inverted U-shaped hedonic
response as a function of sucrose concentration (e.g., inverted-U phenotype), grey line represents an
insensitive response to changes in sucrose concentration, and red line corresponds to a phenotype
characterized by a decline in liking
liking as
as sucrose
sucrose concentration
concentration increases
increases (e.g.,
(e.g., sweet
sweet disliker
disliker phenotype).
phenotype).
from Reference
Adapted with permission from [11].
Reference [11].
Accordingly, an important question to be addressed is how these distinct hedonic responses to
sweet taste can be defined and identified. Among 71 studies we recently reviewed [11], four main
phenotyping methods (each relying on different classification criteria) were identified: the visual or
algorithmic interpretation
interpretationofofhedonic
hedonicresponses from
responses multiple
from sucrose
multiple concentrations
sucrose (Method
concentrations 1a and
(Method 1a
and Method
Method 1b, respectively),
1b, respectively), the “highest
the “highest preference
preference usingmethod
using ratings” ratings” method
that that dichotomizes
dichotomizes participants
participants
based basedthey
on whether on whether they like
like the highest the highest
sucrose sucrosetested
concentration concentration
the most tested
(Methodthe2),
most (Method
the “average
2), the above
liking “average liking above
mid-point” mid-point” or “positive/negative
or “positive/negative liking”liking
liking” method where method where
ratings areliking ratings
compared to
are compared
one to one or
or two predefined two predefined
cut-off cut-off
scores (Method scores
3), and the(Method
“highest3), and the via
preference “highest
pairedpreference
comparisons”via
paired comparisons” method that categorizes participants based on which sucrose concentration they
prefer the most (Method 4). As detailed in our recent review [11], Method 2 and Method 3 suffer from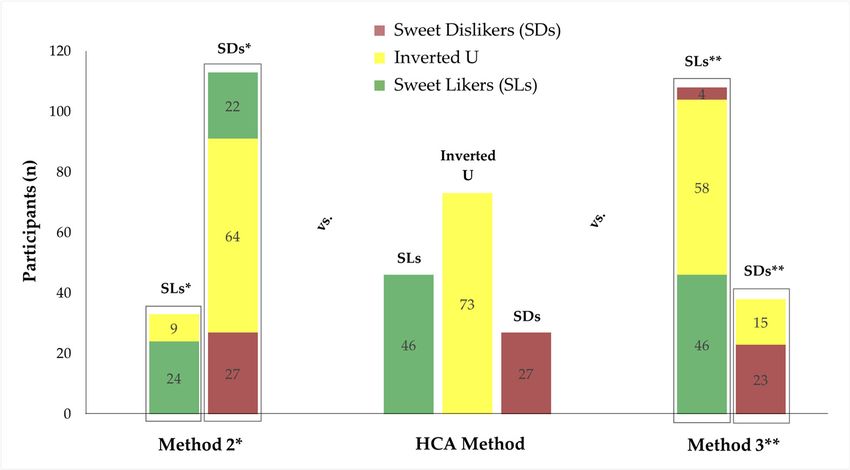
Nutrients 2019, 11, 129                                                                                 3 of 24

method that categorizes participants based on which sucrose concentration they prefer the most
(Method 4). As detailed in our recent review [11], Method 2 and Method 3 suffer from arbitrariness
associated with the strength of the taste stimuli and/or the classification rating thresholds, and both
methods are prone to misclassification. The dependence on visual inspection in Method 1a raises the
potential for subjective interpretation, and Method 4 involves a choice paradigm based on preference
rather than liking per se.
      Considering these methodological challenges, along with the ongoing debate over the role of
sugar intake as a factor in obesity [19–22], there is strong need for a more precise and consistent
method to identify sweet taste phenotypes. The numerous prior studies that have investigated the
presence of different sweet taste liker phenotypes and their potential relationship to dietary intake
(e.g., in References [14,18,23]) or to body mass index (BMI: e.g., in References [13,16,24–26]) have used
widely different methods to define phenotypes; presumably, this has contributed to the inconsistencies
reported across studies. Accordingly, in our recent review [11], we suggested that a rapid and
reliable phenotyping method is needed to facilitate comparisons across future studies. In our review,
we proposed that an optimal sucrose concentration be identified that best separates distinct sweet taste
liker phenotypes, in terms of sensitivity and specificity. In 2015, Asao et al. [27] piloted this idea in order
to discriminate SLs from SDs. However, as commonly happens with small pilot studies, their sample
size likely affected the phenotyping process, potentially leading to an underestimation of the true
number of distinct response patterns, a limitation the authors noted in their report. Further, the total
number of stimuli they used was rather large [27], raising additional issues of fatigue, adaptation,
and inattentiveness. Finally, their participants were tested after they had fasted for an average of
12.1 h [27], which may influence the appetitiveness of the stimuli.
      The present study aimed to extend the approach used by Asao et al. [27] while also eliminating
some of the methodological issues mentioned above toward a goal of defining a new standardized
phenotyping method. We had three aims. First, we identified different sweet taste liker phenotypes
statistically. Second, we analyzed these phenotyping data to identify a single sucrose concentration
where an application of one or two specific cut-off liking scores ensures the most reliable and
replicable definition of each of the identified phenotypes. Last, potential relationships between
the motivational state and baseline characteristics of our participants with these sweet taste liker
phenotypes were explored.

2. Materials and Methods

2.1. Participants
      A total of 148 non-diabetic participants aged 18–34 were recruited from students and staff at the
University of Sussex between September and December 2017 (Table 1). Cohort size was determined by
the suggested minimum of 100 participants in our recent methodological review for the successful
identification of the main sweet taste liker phenotypes [11], which was further increased to adjust for
the expected underrepresentation of the SD phenotype in our young adult population. Inclusion criteria
comprised being medication free (other than oral contraception), smoking less than five cigarettes a
week, and having no history of diagnosed eating disorders. Individuals with a current respiratory
illness or having recently (less than two weeks) undergone a dental procedure, those being on a weight
loss or a medically induced special diet, and women with an irregular menstrual cycle were also
excluded. At enrollment, participants gave their written informed consent for inclusion in the study,
but they were naive to the study’s hypothesis until they had completed all tasks (debriefing provided).
The University of Sussex Science and Technology Cross-Schools Research Ethics Committee approved
the protocol on the 22 September 2017 (ER/VI40/1), and the study was conducted in accordance with
the 1964 Declaration of Helsinki.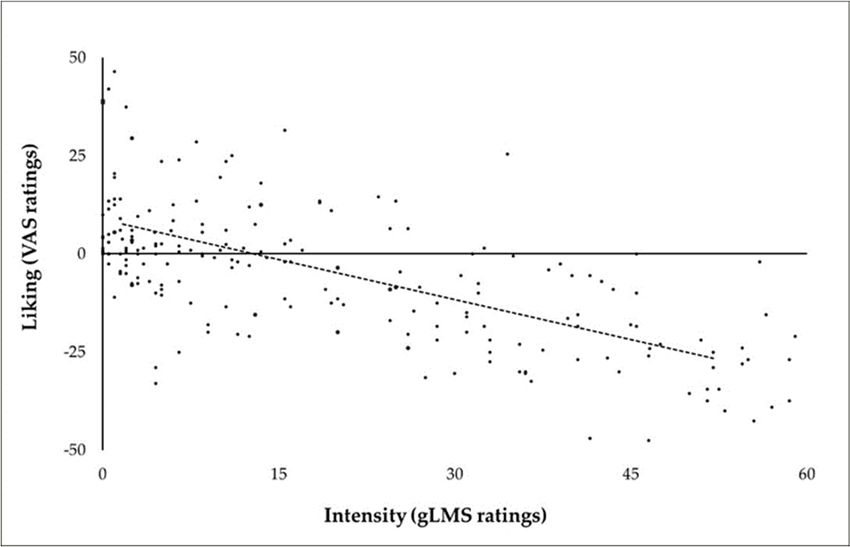
Nutrients 2019, 11, 129                                                                                                  4 of 24

                                           Table 1. Participant characteristics.

                                                                                Sweet Taste Like Phenotype 1,2
                                                   Total                                Inverted
                                                                  Sweet Liker                            Sweet Disliker
                                                                                        U-Shaped
                                                  n = 148             n = 46              n = 73              n = 27
    Gender, N (%)
     Woman                                       105 (70.9)         33 (71.7)            48 (65.8)           22 (81.5)
     Man                                         43 (29.1)          13 (28.3)            25 (34.2)            5 (18.5)
    Ethnicity, N (%)
      Caucasian                                  112 (75.7)         39 (84.8)            53 (72.6)           19 (70.4)
      Asian                                       14 (9.4)           2 (4.3)             9 (12.3)            3 (11.1)
      Other                                      22 (14.9)           5 (10.9)            11 (15.1)           5 (18.5)
    Dieting, N (%)
      Once or more times in the past             52 (35.6)          15 (32.6)            23 (31.9)           12 (46.2)
      Never                                      94 (64.4)          31 (67.4)            49 (68.1)           14 (53.8)
    Added sugar in drinks/cereals, N (%)
     More when being younger                     72 (48.6)          18 (39.1)            39 (53.4)           14 (51.9)
     Same as when being younger                  27 (18.2)          11 (23.9)             9 (12.3)           7 (25.9)
     Never                                       49 (33.1)          17 (37.0)            25 (34.3)           6 (22.2)
    Age range (median) in years               18.2–34.0 (20.2)   18.3–32.8 (19.8)     18.2–34.0 (20.2)   18.2–34.0 (20.9)
    BMI range (median) in   kg/m2             17.8–32.4 (22.1)   17.9–29.1 (23.0)     17.8–32.4 (21.6)   18.2–30.3 (22.7)
      BMI, body mass index; Q1, 25th percentile; Q3, 75th percentile. All frequencies reported refer to valid percentages.
      1 Participants demonstrating erratic responses to sweet stimuli (n = 2) were excluded from this analysis. 2 p > 0.05
      for all between group comparisons performed with chi-square or Kruskal Wallis tests.

2.2. Taste Test

2.2.1. Taste Stimuli
      To ensure sufficient individual ratings for the development of hedonic curves while trying to
minimize confounding effects of adaptation [28] and sensory specific satiety [29], the taste test consisted
of seven different aqueous sucrose solutions (0.03125, 0.0625, 0.125, 0.25, 0.5, 0.67, and 1 M) and one
water blank, replicated in two separate blocks, for a total of 16 tastings.
      The particular concentration range tested was equivalent to sucrose solutions between 1.07% and
34.23% (w/v) based on density at 20 ◦ C [30], and were chosen to reflect four different considerations:
(1) previously reported effects of age on sucrose recognition thresholds [31–33]; (2) the most commonly
used sucrose concentrations in prior relevant studies (reviewed in Reference [11]); (3) the sweetness
typically encountered in sugar-sweetened beverages [34]; and (4) a compromise between equal log
spacing and serial dilution for sample preparation.
      All sweet stimuli were prepared at least 24 hours in advance by dissolving food-grade sucrose in
mineral water at room temperature. Solutions were stored at 4 ◦ C until used. On the experimental day,
solutions were allowed to warm up to room temperature prior to presentation, and were presented as
10 mL samples in transparent 60 mL glass cups labelled with random three digit codes. For the solute
and rinsing, we used a commercial mineral water with the lowest dry residue concentration available
at the time (Volvic, Danone Waters London and Ireland Ltd., London, U.K.).

2.2.2. Rating Scales
     Participants evaluated liking and intensity for each stimulus using a horizontal visual analogue
scale (VAS) end-anchored with “dislike extremely” (scored −50) and “like extremely” (scored +50)
and a vertical generalized labeled magnitude scale (gLMS) with properly positioned descriptors
ranging from “no sensation” (scored 0) to “strongest imaginable sensation of any kind” (scored +100),
respectively. To ensure within and between-subjects compliance, training for both scales was provided.
The practice session for VAS involved rating liking for a series of non-food items, while training in the
use of gLMS was applied by evaluating responses to noise and light [35].
Nutrients 2019, 11, 129 5 of 24
On the basis of Cabanac’s theory regarding possible enhancement of stimulus value by internal
state (“alliesthesia” [36]), two series of VAS appetite ratings [37] were completed before the first and
after the second taste test block. All ratings were collected using the Sussex Ingestion Pattern Monitor
(SIPM version 2.0.13, University of Sussex, Falmer, U.K.), a computer-based system developed to
record and score rating data.
2.2.3. Procedure
The taste test was conducted approximately 2 h after breakfast (between 09.30 am and 12.30 pm
depending on each participant’s personal routine). Participants were also asked to abstain from
smoking, chewing gum, and tooth brushing for the 2 h prior to testing; no restrictions applied to water
consumption. During both taste test blocks, a “sip and spit” protocol was followed: participants were
instructed to place the entire 10-mL solution in their mouth, swirl it around for 10 s, and expectorate
it. They then rated their liking and sweetness intensity before rinsing their mouth with water and
proceeding to the next sample. Stimuli were presented in randomized order with participants blinded
to the concentration of sucrose tasted each time. After the taste test was complete, demographic
(date of birth, sex, and ethnicity) and lifestyle characteristics (“Have you ever been on a diet in order
to lose weight?” with possible answers “Yes, one or more times in the past” or “Never,” and “Did you
usually add more sugar in your coffee, tea or cereals when you were younger?” with possible answers
“Yes, I used to add more sugar in my coffee, tea or cereals when I was younger,” or “No, I add the
same sugar as I did in the past,” or “Never added sugar in my coffee, tea or cereals”) were collected.
2.3. Anthropometry
To minimize any possible interactions between the sensory ratings and anthropometric
measures, participants revisited the laboratory for a separate early morning session (08:30–10:30)
for anthropometry; this visit was scheduled between two days and two weeks after the taste test.
Height was measured to the nearest 0.1 cm using a stadiometer and weight to the nearest 0.1 kg
using a calibrated body composition analyzer (MC-780MA P, TANITA, Tokyo, Japan). Standardized
procedures were followed, including wearing light clothing and no shoes [38].
2.4. Statistical Analysis
Our primary goals were to (a) algorithmically identify the different sweet taste liker phenotypes
in our study cohort and (b) to determine the specific sucrose concentration and associated cut-off
score(s) for liking ratings that most reliably allowed for the identification of those distinct phenotypes.
Assumptions of normality were tested prior to the main statistical analyses using visual inspection
(histograms, Q-Q plots, and bloxplots), and summary statistics (skewness and kurtosis z-scores
computed by dividing skewness or kurtosis values with the associated standard errors). Z-scores
(absolute values) larger than 1.96 were indicative of a normal distribution. All ratings are reported as
means and standard errors (normally distributed), while medians and ranges are used for age and
BMI (not normally distributed); categorical characteristics are expressed as percentages.
Interclass correlation coefficients (ICCs) were calculated to assess test–retest reliability of liking
ratings over the two taste test blocks. Given our experimental design, an average measures absolute
agreement two-way mixed-effects model was selected [39]. Per the guidelines, an ICC value less
than 0.5 indicates poor reliability, values between 0.5 and 0.75 reflect moderate reliability, and values
between 0.75 and 0.9 indicate good reliability [40].
As the first step to achieve the principle aim of the current study, an agglomerative hierarchical
cluster analysis (HCA) was performed and meaningful groups (clusters) of participants who shared
similar liking patterns within each group but were heterogeneous in the between-group contrasts were
identified. The mean liking ratings from the eight replicated concentrations in the two taste test blocks
were treated as the dimensions for the HCA. The squared Euclidean distance between pairs of cases or
clusters and the between-groups (average) linkage method were selected to assist with the mergingNutrients 2019, 11, 129 6 of 24
process [41]. The final decision on the true number of clusters in our dataset was dictated graphically
by interpreting the scree plot of coefficients of the agglomeration schedule we designed (Office Excel
2013 for Windows, Microsoft, Washington, DC, USA) and then applying this information (“stopping
rule”) to the dendrogram provided by the statistical software on the HCA output [41].
We then implemented a two-by-two cross tabulation function to estimate the dyads of sucrose
concentration and liking score with the highest sensitivity and specificity in predicting the three
distinct sweet taste liker phenotypes. In each two-by-two cross tabulation table, the phenotyping
results emerged when a specific dyad of sucrose concentration and liking score was used as the
classification criteria for the identification of the sweet taste liker phenotype under investigation
were contrasted with the associated phenotyping results suggested by the HCA. The number of
true positives (e.g., classified as SL by both the dyad tested and the HCA) and the number of true
negatives (e.g., not classified as SL by both the dyad tested and the HCA) indicated the sensitivity
and specificity attached to that particular dyad of sucrose concentration and liking score, respectively.
Reported liking ratings for stimuli from 0.03125 M to 1.0 M sucrose and potential cut-off values ranging
between −20 and +20 in 5-point increments were tested for their prediction value. A K-1 series of
sensitivity-specificity tests were conducted, where k represents the number of main clusters previously
identified in the HCA.
To test the hypothesis that the sucrose concentration (within subject factor) and the initial clusters
or subsequent sweet taste liker phenotypes (between subject factor), as well as their interaction,
affect liking and intensity ratings of the presented sweet taste stimuli, two-way mixed ANOVAs with
Greenhouse-Geisser correction were carried out. We also employed separate one-way ANOVAs to
contrast liking and intensity (both mean ratings and ratings across each of the eight concentrations) by
sweet taste liker phenotype. In cases of violation of the equal variances assumption, Brown–Forsythe
tests were applied, instead [42]. Post hoc Fisher’s least significant difference (LSD) and Games-Howell
tests were used as appropriate to further understand the nature of specific paired comparisons.
Nonparametric (Mann–Whitney) tests for the previously reported not normally distributed continues
variables (age and BMI) and Pearson’s chi-square tests for the categorical variables (gender, ethnicity,
dieting history, and habitual use of table sugar) were used to investigate for differences in participant
characteristics across the distinct sweet taste liker phenotypes. To explore whether there were also gender
differences in measures of interest, additional chi-square tests were performed. Phi symmetric measures
instead of Pearson’s results are reported in cases of cells with an expected count less than 5.
To ensure participants’ compliance with the taste test protocol, changes in hunger and thirst before
and after delivering the taste test were explored using paired t-tests. We also calculated multiple linear
regressions to investigate the degree to which pre- and post-test hunger and thirst predicted liking
and intensity ratings across the study sample. The influence of pre- and post-test levels of hunger
and thirst was further explored using either one-way ANOVAs or Brown–Forsythe tests [42] to detect
differences across the distinct sweet taste liker phenotypes.
The extent to which our method for the identification of the distinct sweet taste liker phenotypes
agrees with those in previous literature (see Introduction for details) was assessed by Cohen’s Kappas
and 95% confidence intervals (CIs) based on the “Estimate ± 1.96 × Standard Error” formula [43];
participants exhibiting an inverted U-shaped response were excluded from this analysis due to the
bimodal nature of the phenotyping results elicited by Method 2 and 3. The relevant frequency
distributions were also estimated. For the comparison with Method 2 participants who rated the
highest sucrose concentration, namely the 1 M solution, as the most pleasant were considered as SLs,
whilst all remainder liking patterns were classified into the SD phenotype [44,45]. The agreement with
Method 3 was tested using the 0.5 M sucrose solution and the corresponding neutral cut-off hedonic
score of 0 (zero) as the classification criteria to discriminate SLs from SDs [23].
Unless otherwise stated, data were analyzed using SPSS Statistics for Windows, version 24.0
(IBM Corp., Armonk, NY, USA). An alpha level of 0.05 was set as the threshold for statistical significance
and all performed statistical tests were two-tailed.Nutrients 2019, 11, 129 7 of 24
3. Results
Nutrients 2019, 11, x FOR PEER REVIEW 7 of 25
3.1. Participant
3. Results Characteristics
Participant characteristics are summarized in Table 1; three (two women and one man) failed to
3.1. Participant Characteristics
report to the laboratory for both sessions. As a whole the cohort tested here was relatively young and
lean (MdnParticipant characteristics
= 20.2 years and Mdn are summarized
= 22.1 in Table 1; threeand
kg/m2 , respectively) (twowas
women and comprised
mainly one man) failed to
of women
report to the laboratory for both sessions. As a whole the cohort tested here was relatively
(70.9%); most self-identified as Caucasian (75.7%). Nearly half of the participants reported that they young and
lean (Mdn = 20.2 years and Mdn = 22.1 kg/m2, respectively) and was mainly comprised of women
currently add less sugar in their drinks and cereals than when they were younger, and one in three
(70.9%); most self-identified as Caucasian (75.7%). Nearly half of the participants reported that they
had been on a diet for weight loss at least once in the past. Overall, the women were slightly younger
currently add less sugar in their drinks and cereals than when they were younger, and one in three
than had
the been
men on (Mdn = for
a diet 21.1 yearsloss
weight foratmen onceMdn
leastand in the=past.
20.1Overall,
years for
thewomen;
women wereU =slightly Z = −3.263,
1454.5,younger
p = 0.001), and had a lower average BMI (Mdn = 23.4 kg/m 2 for men and Mdn = 21.6 kg/m2 for
than the men (Mdn = 21.1 years for men and Mdn = 20.1 years for women; U = 1454.5, Z = −3.263, p =
women; U=
0.001), and had a Z
1475.5, = −2.861,
lower averagep BMI
= 0.004).
(Mdn This
= 23.4was
kg/m expected, as itMdn
2 for men and reflects
= 21.6the typical
kg/m differences
2 for women; U in
BMI between
= 1475.5, Zmen and pwomen
= −2.861, = 0.004).and
Thisthe
wasdifferences
expected, asinitBMI across
reflects different
the typical age groups
differences in BMIin the U.K. [46].
between
men and women and the differences in BMI across different age groups in the U.K. [46].
3.2. Taste Test
3.2. Taste Test
Test-retest reliability analysis comparing liking ratings across the two taste test blocks indicated
moderateTest-retest reliability analysis
to good reproducibility comparing
based on theliking
ICC ratings
cut-offsacross the twoby
suggested taste test blocks
Portney andindicated
Watkins [40]
moderate to good reproducibility based on the ICC cut-offs suggested by Portney and Watkins [40]
for all but the 0.125 M solution (Figure 2). The two highest sucrose concentrations (0.67 and 1.0 M),
for all but the 0.125 M solution (Figure 2). The two highest sucrose concentrations (0.67 and 1.0 M),
and water were associated with the strongest agreement between the two repetitions. As expected,
and water were associated with the strongest agreement between the two repetitions. As expected,
therethere
was was
a main effect
a main of concentration
effect of concentrationononliking
liking across allparticipants
across all participants with
with significantly
significantly different
different
2
meanmean
hedonic scores
hedonic reported
scores forfor
reported different
differentsolutions
solutions (F(2.12, 312.15)= =
(F(2.12, 312.15) pNutrients 2019, 11, 129 8 of 24
for 0.03125 M) and the highest (M = −1.5, SEM = 1.44 for 1.0 M) sucrose concentration as neutral; that
is, they neither liked them nor disliked them (t(69) = 1.46, p = 0.148 for the paired comparison between
the lowest versus the highest concentration).
Regarding the 12 participants classified into one of the remaining clusters (clusters 4 to 10),
plotting liking as a function of concentration revealed that participants in cluster 9 (n = 2) and those
in cluster 10 (n = 3) followed a classical SL and a SD liking pattern, respectively. Their ratings
from the eight different sucrose concentrations resulted, however, in steeper liking curves (“extreme”
responses) than those in our main SL and SD clusters, which explains why they emerged as separate
groups during the clustering procedure. Indeed, before we applied the “stopping rule” as appropriate
(see Section 2.4 for details), participants grouped into clusters 9 and 10 and those grouped into clusters
1 and 3, respectively, had been considered as homogenous only subsequent to the inverted U-shaped
phenotype merged with the SL phenotype. Likewise, an inverted U-shaped response corresponding
to corresponding to that of cluster 2 was observed for participants classified into cluster 4 (n = 2),
cluster 7 (n = 2), and cluster 8 (n = 1): among the heterogeneous mean liking ratings to those of cluster
2, a different optimal sweetness (0.5 M for cluster 4 and 0.67 M for cluster 8) and a higher rating
for the breakpoint concentration of 0.25 M sucrose (M = 8.9, SEM = 1.15 for cluster 2 and M = 28.5,
SEM = 4.50 for cluster 7, t(70) = −2.84, p = 0.006) stand out. Two single cases of erratic responses were
also identified and eliminated from further analysis (cluster 5 and cluster 6).
3.2.2. Identifying Distinct Sweet Taste Like Phenotypes: New Classification Criteria
With regard to the specific sucrose concentration and liking thresholds that best discriminated
between the three main clusters, the 1 M solution and liking scores of −15 or lower for the identification
of SDs and +15 or higher for the identification of SLs were associated with the lowest number of false
negative classifications (90.9 and 97.7 percentage sensitivity for SDs and SLs, respectively) and the
lowest number of false positive classifications (93.9 and 93.5 percentage specificity for SDs and SLs,
respectively). The results are shown in Tables 2 and 3.
Table 2. Sensitivity and specificity checks to discriminate sweet dislikers (cluster 3) from the rest of
sweet taste liker phenotypes.
Sucrose Concentration (M)
Liking Cut-Off Scores 0.25 0.5 0.67 1.0
Sensitivity Specificity Sensitivity Specificity Sensitivity Specificity Sensitivity Specificity
(%) (%) (%) (%) (%) (%) (%) (%)
−20 13.6 100.0 36.4 100.0 45.5 99.1 81.8 96.5
−15 13.6 100.0 54.5 97.4 68.2 95.6 90.9 * 93.9 *
−10 27.3 99.1 63.6 94.7 77.3 92.1 95.5 87.7
−5 50.0 94.7 77.3 93.0 95.5 86.0 100.0 77.2
0 59.1 89.5 90.9 86.8 100.0 76.3 100.0 68.4
Percentages (%) with an asterisk (*) indicate the dyad of sucrose concentration and liking cut-off score with the
highest combined sensitivity and specificity for the prediction of the sweet disliker phenotype across all dyads tested.
We then applied these classification criteria individually to participants who were assigned to the
remaining clusters. The revised grouping (SL phenotype: n = 46; 31.5%, inverted U-shaped phenotype:
n = 73; 50%, SD phenotype: n = 27; 18.5%) was in agreement with the classification suggested by the
visual interpretation of the shape of the relevant liking curves in all participants except those initially
classified into cluster 4. Those participants met the new SD phenotype criteria rather the criteria
associated with the inverted U-shaped response pattern. A closer inspection of their hedonic responses
revealed that they actually had rated all sucrose solutions as neutral or unpleasant. In addition,
integrating the very small clusters into the main groups of responses reduced overfitting and allowed
for the subsequent statistical analyses required.Nutrients 2019, 11, 129 9 of 24
Table 3. Sensitivity and specificity checks to discriminate sweet likers (cluster 1) from the rest of sweet
taste liker phenotypes.
Sucrose Concentration (M)
Liking Cut-off Scores 0.25 0.5 0.67 1.0
Sensitivity Specificity Sensitivity Specificity Sensitivity Specificity Sensitivity Specificity
(%) (%) (%) (%) (%) (%) (%) (%)
0 95.5 26.1 100.0 40.2 100.0 55.4 100.0 64.1
5 79.5 43.5 100.0 54.3 97.7 63.0 100.0 77.2
10 56.8 67.4 100.0 67.4 97.7 76.1 97.7 89.1
15 38.6 84.8 88.6 79.3 88.6 87.0 97.7 * 93.5 *
20 20.5 88.0 63.6 87.0 79.5 96.7 84.1 97.8
Percentages (%) with an asterisk (*) indicate the dyad of sucrose concentration and liking cut-off score with the
highest combined sensitivity and specificity for the prediction of the sweet liker phenotype across all dyads tested.
Confirming the diverse nature of the sensory responses to sweet taste among participants classified
into the three main sweet taste liker phenotypes, overall liking and intensity significantly varied across
these newly defined distinct groups, F(2, 56.21) = 89.44, p < 0.001 for liking and F(2, 77.95) = 5.74,
p = 0.005 for intensity. A main effect of sucrose concentration (F(4.44, 635.19) = 8.53, p < 0.001,
ηp2 = 0.056), as well as a strong interaction effect between sucrose concentration and phenotype
(F(8.88, 635.19) = 78.65, p < 0.001, ηp2 = 0.524) on liking were also found. As shown in Figure 3,
follow-up analysis indicated that participants with an inverted U-shaped response liked the three
lower sucrose concentrations at a similar level when compared with both SLs and SDs. When liking
ratings of those stimuli were separately contrasted between the two extreme phenotypes, we found
that SLs rated them as less pleasant than SDs did. Liking for the 0.125 M sucrose solution did not differ
between groups, whereas liking ratings for the rest of the sweet taste stimuli significantly differed by
cluster (p < 0.001
Nutrients 2019, 11,for most
x FOR paired
PEER comparisons).
REVIEW 10 of 25
Figure
Figure 3. Liking
3. Liking ratings
ratings (mean±
(mean ± standard
standarderror of of
error thethe
mean) as a as
mean) function of sucrose
a function solutions
of sucrose by the by
solutions
threesweet
the three sweet taste
taste liker
liker phenotypes.
phenotypes. Ratings
Ratings were
wereaveraged
averagedacross the the
across twotwo
tastetaste
test test
blocks. The The
blocks.
response pattern for the sweet liker phenotype is displayed with a dotted line, the response pattern
response pattern for the sweet liker phenotype is displayed with a dotted line, the response pattern of
of inverted U-shaped phenotype with a solid line, and the response pattern of sweet disliker
inverted U-shaped phenotype with a solid line, and the response pattern of sweet disliker phenotype
phenotype with a dashed line. Different colors denote the different ranges of liking ratings for 1 M
with a dashed line. Different colors denote the different ranges of liking ratings for 1 M sucrose which,
sucrose which, according to the relevant sensitivity and specificity checks (see Tables 2 and 3 for
according to the relevant sensitivity and specificity checks (see Tables 2 and 3 for details), could be
details), could be used for the reliable discrimination between the three distinct sweet taste liker
used phenotypes:
for the reliable
greendiscrimination
color corresponds between the of
to the range three distinct
liking ratings sweet
for 1 Mtaste
sucroseliker phenotypes:
representing sweetgreen
colorlikers,
corresponds to the range of liking ratings for 1 M sucrose representing sweet
yellow color indicates the hedonic response spectrum to 1 M sucrose characteristic of the likers, yellow
colorinverted
indicates the hedonic
U-shaped response
phenotype, spectrum
and red to 1 M sucrose
color corresponds to the characteristic of the inverted
range of liking ratings U-shaped
for 1 M sucrose
phenotype,
for sweetand red color corresponds to the range of liking ratings for 1 M sucrose for sweet dislikers.
dislikers.Nutrients 2019, 11, 129 10 of 24
WeFigure
next sought
3. Likingto examine
ratings (meanthe perceived
± standard variations
error in sweetness
of the mean) forofthe
as a function different
sucrose stimuli
solutions by thebetween
three
the three sweet
sweet taste
liker liker phenotypes.
phenotypes. PairedRatings were averaged
comparisons betweenacross the two taste
the intensity ratingstestfor
blocks.
each The
successive
responseand
concentration pattern
thefor the sweet
intensity liker phenotype
ratings is displayed
for the previous with a dotted
indicated line, the response
that participants were pattern
clearly able
of inverted U-shaped phenotype with a solid line, and the response pattern
to distinguish between the different sucrose concentrations (p = 0.002 for water and 0.03125 M, and of sweet disliker
phenotype with a dashed line. Different colors denote the different ranges of liking ratings for 1 M
p’s < 0.001 for all remainder pairs). Rated intensity also increased as sucrose concentration increased
sucrose which, according to the relevant sensitivity and specificity checks (see Tables 2 and 3 for
across all three sweet taste like phenotypes, F(2.32, 336.30) = 535.25, p < 0.001, ηp2 = 0.787 (Figure 4).
details), could be used for the reliable discrimination between the three distinct sweet taste liker
SDs overall perceived the taste stimuli as sweeter (M = 23.3, SEM = 1.62) than both SLs (M = 17.2,
phenotypes: green color corresponds to the range of liking ratings for 1 M sucrose representing sweet
SEM = likers,
0.73; pyellow
= 0.001)
colorand participants
indicates classified
the hedonic responseinspectrum
the inverted
to 1 MU-shaped phenotype
sucrose characteristic of (M
the = 19.2,
SEM = inverted
0.96; p =U-shaped
0.015). No interaction effect between concentration and sweet taste like
phenotype, and red color corresponds to the range of liking ratings for 1 M sucrose phenotype on
intensity was, however, observed, F(4.67, 333.68) = 521.10, p = 0.082, 2 = 0.027.
for sweet dislikers. ηp
Figure 4. Intensity ratings (mean ± standard error of the mean) as a function of sucrose solutions by the
Figure 4. Intensity ratings (mean ± standard error of the mean) as a function of sucrose solutions by
three sweet taste liker phenotypes. Ratings are averaged across the two taste test blocks. The intensity
the three sweet taste liker phenotypes. Ratings are averaged across the two taste test blocks. The
curve of thecurve
intensity sweetofliker phenotype
the sweet is displayed
liker phenotype with a dotted
is displayed with aline, theline,
dotted intensity curve ofcurve
the intensity the inverted
of the
U-shaped phenotype with a solid line, and the intensity curve of the sweet disliker
inverted U-shaped phenotype with a solid line, and the intensity curve of the sweet disliker phenotype with a
dashed line. with a dashed line.
phenotype
To explore whether the identified sweet taste liker phenotypes were merely indirect consequences
of differences in perceived intensity rather than true differences in hedonics per se, liking ratings were
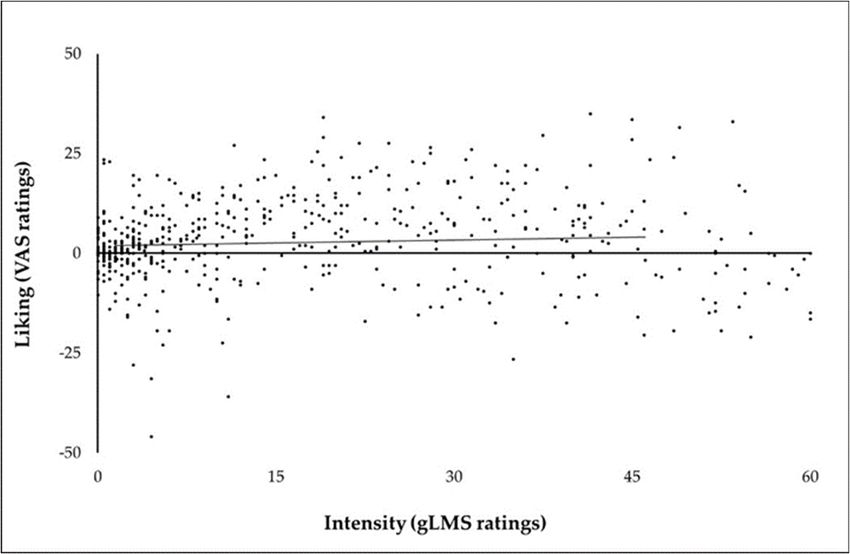
also plotted as a function of intensity separately for the three main clusters. As shown in Figure 5a–c,
no such indication was found.
3.2.3. Pre- and Post-Test Levels of Hunger and Thirst
Pre-test levels of hunger (M = −7.5, SEM = 2.11) and thirst (M = 0.3, SEM = 1.68) confirmed
participants’ compliance with the taste test preparation instructions, whereas the increase in hunger
(t(147) = −3.25, p = 0.001) and decrease in thirst (t(147) = 2.32, p = 0.022) over time was also in line
with the effects of the “sip and spit” and “mouth rinsing with water” parts of the taste protocol.
Neither hunger nor thirst ratings before taste test block 1 or after taste test block 2 predicted liking
(F(2, 145) = 2.065, p = 0.130 for pre-test levels of hunger and thirst; F(2, 145) = 0.607, p = 0.546 for
post-test levels of hunger and thirst) or intensity (F(2, 145) = 1.041, p = 0.356 for pre-test levels of hunger
and thirst; F(2, 145) = 0.403, p = 0.669 for post-test levels of hunger and thirst) across the study sample.
When ratings of hunger and thirst were examined against the three distinct sweet taste liker phenotypes,
non-significant differences were found (F(2, 143) = 2.410, p = 0.093, and F(2, 143) = 0.094, p = 0.910 for
pre-test levels of hunger and thirst, respectively; F(2, 76.22) = 0.986, p = 0.378, and F(2, 143) = 0.107,Nutrients 2019, 11, 129 11 of 24
p = 0.899 for post-test levels of hunger and thirst, respectively). These data clearly show that the group
differences in sweet liking cannot be attributed to the observed changes in hunger or thirst.
Nutrients 2019, 11, x FOR PEER REVIEW 11 of 25
(a)
(b)
(c)
Figure 5. Individual ratings of liking as a function of perceived intensity for the sweet taste stimuli in
Figure 5. Individual ratings of liking as a function of perceived intensity for the sweet taste stimuli
(a) sweet likers, (b) individuals exhibiting an inverted U-shaped hedonic response, and (c) sweet
in (a) sweet
dislikers. Lines individuals
likers, (b) exhibiting
represent the average ratingsan inverted
across U-shaped
individuals classifiedhedonic response,
within each phenotype.and (c) sweet
dislikers. Lines represent the average ratings across individuals classified within each phenotype.
3.3. Participant Characteristics by Sweet Taste Liker Phenotype
Possible variations in participant characteristics relative to sweet taste liker phenotype were also
examined. Gender (χ2 (2, N = 146) = 2.39, p = 0.302), ethnicity (φ = 0.152, p = 0.496), dieting history
(χ2 (2, N = 144) = 1.84, p = 0.400), habitual use of table sugar (φ = 0.194, p = 0.240), age (H(2) = 2.60,Nutrients 2019, 11, 129 12 of 24
Nutrients 2019, 11, x FOR PEER REVIEW 12 of 25
p = 0.273) and BMI (H(2) = 0.67, p = 0.717) did not differ between groups. All associated values by
phenotype3.3.are summarized
Participant in Tableby1.Sweet Taste Liker Phenotype
Characteristics
Possible variations in participant characteristics relative to sweet taste liker phenotype were also
3.4. Comparison to Existing
examined. Gender (χClassification Methods
2(2, N = 146) = 2.39, p = 0.302), ethnicity (φ = 0.152, p = 0.496), dieting history
(χ2(2, N = 144) = 1.84, p = 0.400), habitual use of table sugar (φ = 0.194, p = 0.240), age (H(2) = 2.60, p =
When Method 2 (rating the 1 M sucrose solution or not as the most pleasant) and Method 3 (rating
0.273) and BMI (H(2) = 0.67, p = 0.717) did not differ between groups. All associated values by
the 0.5 Mphenotype
sucrose are solution higher
summarized than1.0 or not) were used to distinguish the different sweet taste
in Table
liker phenotypes, the proportions of SD and the SL were respectively overestimated: 113 participants
3.4. Comparison to Existing Classification Methods
were classified as SDs according to Method 2 and 108 as SLs according to Method 3. Compared with
When
our phenotyping method, Method 2in (rating
boththe 1 M the
cases, sucrose solution
majority ofor not as
those the most pleasant)
participants (56.6% and
ofMethod
SDs in 3Method 2
(rating the 0.5 M sucrose solution higher than 0 or not) were used to distinguish the different sweet
and 53.7% of SLs in Method 3) exhibited an inverted U-shaped response. Focusing on Method’s 2
taste liker phenotypes, the proportions of SD and the SL were respectively overestimated: 113
phenotypic classification, all 27 participants classified as SDs using our method were also identified
participants were classified as SDs according to Method 2 and 108 as SLs according to Method 3.
as SDs using Method
Compared with 2. ourRegarding
phenotypingthe SL phenotype,
method, in both cases,22
theout of 46ofparticipants
majority initially
those participants (56.6%fell
of into the
SL phenotype were classified
SDs in Method 2 and 53.7% asofSDs
SLs inusing
MethodMethod 2. Those
3) exhibited 22 participants
an inverted liked Focusing
U-shaped response. the 1 M sucrose
on Method’s 2 phenotypic
solution significantly lower than classification,
the previous all 27 concentration
participants classified
(M =as25.3
SDs using
for 1our M method
versuswere M = 30.6 for
also identified as SDs using Method 2. Regarding the SL phenotype, 22 out of 46 participants initially
0.67 M, p = 0.014), while no significant difference was observed when compared with the third higher
fell into the SL phenotype were classified as SDs using Method 2. Those 22 participants liked the 1 M
sucrose concentration
sucrose solution(M = 25.3 forlower
significantly 1 Mthanversus M = 28.4concentration
the previous for 0.5 M, p(M==0.222).
25.3 for The kappaMcoefficient
1 M versus = 30.6 was
accordingly lowM,
for 0.67 at p0.447 (95%
= 0.014), CI:no
while 0.286 to 0.608).
significant In contrast,
difference the agreement
was observed when comparedwithwithMethod 3 was good
the third
highercoefficient
with a Kappa sucrose concentration (M = 25.3
at 0.879 (95% for 1 Mtoversus
CI: 0.764 M All
0.993). = 28.4
SLsforidentified
0.5 M, p = 0.222).
using The
ourkappa
method were
coefficient was accordingly low at 0.447 (95% CI: 0.286 to 0.608). In contrast, the agreement with
also classified as SLs by Method 3. The two phenotyping approaches were also in line regarding the
Method 3 was good with a Kappa coefficient at 0.879 (95% CI: 0.764 to 0.993). All SLs identified using
SD phenotype: only four SDs using our method were discordantly classified as SLs using Method 3.
our method were also classified as SLs by Method 3. The two phenotyping approaches were also in
Those participants
line regarding hadthe aSDmean liking
phenotype: forfour
only theSDs0.5using
M barely overwere
our method the discordantly
neutral point (M =as1.1)
classified SLsand their
liking rating
usingfor the 13.M,
Method which
Those was our
participants hadconcentration
a mean liking forofthe
choice for distinguishing
0.5 M barely over the neutral sweet
point (Mtaste liker
= 1.1)
phenotypes, andas
was their
lowliking
as −rating
28.7. for the 1 M, which
A graphical was our concentration
representation of choice
of the level for distinguishing
of consistency/disagreement
sweet taste liker phenotypes, was as low as −28.7. A graphical representation of the level of
among the methods compared here is provided in Figure 6.
consistency/disagreement among the methods compared here is provided in Figure 6.
Figure 6. Figure 6. Comparison
Comparison of theofdistribution
the distributionofofsweet
sweet taste
tasteliker
likerphenotypes
phenotypesin ourinstudy
our sample
study when
sample when
different classification methods were used. Method 2 (rating the 1 M sucrose solution or not as the
different classification methods were used. Method 2 (rating the 1 M sucrose solution or not as the most
most pleasant) and Method 3 (rating the 0.5 M sucrose solution higher than 0 or not) were, by
pleasant)definition,
and Method limited3 to
(rating the 0.5 group
a two-response M sucrose solution
phenotyping higher
outcome thandistribution),
(binomial 0 or not) were,
while by
HCA definition,
limited tomethod
a two-response
(rating the 1 group
M sucrosephenotyping
solutions higheroutcome
than +15,(binomial
lower thandistribution),
−15, or betweenwhile
−15 andHCA
+15) method
allowed
(rating the for the identification
1 M sucrose solutions higherof three than
distinct sweet
+15, tastethan
lower −15, or between
liker phenotypes. −15 and
133 participants (77.4%)
+15) allowed
versus 27 (18.5%)
for the identification ofwere
three classified
distinctas SDs
sweetandtaste
108 participants (74.0%) versus
liker phenotypes. 13346 participants
(31.5%) were classified
(77.4%) versus
as SLs when Method 2 and Method 3 were contrasted with the method we proposed here (HCA
27 (18.5%) were classified as SDs and 108 participants (74.0%) versus 46 (31.5%) were classified
as SLs when Method 2 and Method 3 were contrasted with the method we proposed here (HCA
method), respectively. Different colors of the stacked columns and the associated data labels (numbers)
correspond to the number of participants classified into the phenotype of the same color when the
HCA method was used. Data labels (numbers) within each column add up to the total number of
participants classified into the phenotype illustrated at the upper end of the relevant column. Asterisks
(*/**) denote alternatives to our definition for SLs and SDs. SDs, sweet dislikers; SLs, sweet likers.Nutrients 2019, 11, 129 13 of 24
4. Discussion
4.1. General Findings
The present report describes how hedonic responses to taste stimuli of varied sweetness can be
algorithmically interpreted using HCA, and clustered into groups that represent similar sweet-liking
patterns. For the current dataset, consistent differences in liking ratings across the eight sucrose
solutions were found, which then allowed a clear characterization of participants as SLs, those with
an inverted U-shaped response, or as SDs. Another key feature of the study was the subsequent
identification of the 1 M aqueous sucrose solution and the VAS-based cut-off liking scores of −15 and
+15 as the statistically reliable criteria to efficiently categorize individuals into these three different
sweet taste liker phenotypes.
4.2. HCA Selection Advantages
Regarding our decision to use HCA for the identification of different sweet taste liker phenotypes,
this was principally driven by the need for a statistically robust and unbiased merging of individuals
into groups. Indeed, using an advanced statistical clustering technique allowed the three sweet taste
liker phenotypes to emerge, whereas this would have been difficult to discern using more traditional
visual inspection methods, particularly if the inspector was assuming a simple dichotomous mode.
HCA is also based on hedonic responses across multiple stimuli rather than based on an arbitrarily
selected single liking rating or the average value of hedonic scores of different stimuli. Accordingly,
most elements of subjectivity and arbitrariness noted in the other phenotyping methods discussed
earlier were controlled for. When we re-analyzed our current data using other widely used methods
(defined as Methods 2 and 3 in the introduction, and in our recent review [11]), many participants were
misclassified relative to the cluster analysis performed here, as the bimodal phenotyping approach in
those methods assumes a priori that there are only two distinct response patterns. Critically, the HCA
analysis shown here, as well as other recent studies [9,13], all suggest that response patterns for sweet
stimuli are better described by three distinct phenotypes. Regarding the observed overestimation
of SDs by Method 2 and of SLs by Method 3, this was a consistent feature of those methods in our
recent evaluation of the impact of different sweet taste liker classification approaches [11]. In contrast,
discriminating participants between the different sweet taste liker phenotypes based on a single
sucrose concentration and predetermined cut-off liking scores as used in Method 3, led to the least
misclassifications, further supporting the utility of such a phenotyping approach.
4.3. Phenotyping Results
Our findings confirm some [8,9,13,47,48] but not all, studies using phenotyping methods that
allowed for a non-dichotomous identification of sweet-liking patterns. Indeed, in some published
reports, participants with an inverted U-shaped response were considered as outliers [12,15,17], whilst
elsewhere they were treated as homogeneous with the SDs [49–51]. Here, the generated icicle plot of
our statistical output (not shown) revealed that during the final stages of the clustering process, SLs
merged with those from the inverted U-shaped phenotype before SDs joined them both, uncovering
a greater resemblance of the SL rather than of the SD phenotype to the inverted U-shaped response
group. It is then plausible to assume that eliminating or misclassifying this intermediate phenotype
is problematic and possibly obfuscates potential relationships between sweet taste liker phenotypes
and health outcomes of interest. We also noticed that the sucrose concentration associated with
the highest liking in the inverted U-shaped response group (i.e., the 0.25 M), was in line with the
concentration observed in most previous work [15–18,27,52,53], although lower values have also been
reported [8,14,48,54]. Practically speaking, this commonly identified 0.21–0.3 M range of sucrose
concentration threshold in individuals who like intermediate levels of sweetness is lower than the
sugars composition of the commercially available sweetened beverages [34]. This may potentiate the
argument for reexamining the utility of sugar-tax policies [55]. The multisensory aspects of tastingNutrients 2019, 11, 129 14 of 24
real-life products should not, however, be disregarded [56], as well as the possible attenuating or
enhancing effects of other flavor components on perceived sweetness in complex products [57–60].
As sagely noted by Pangborn, “a change in one ingredient can cause multiple physical-chemical
interactions which alter several sensory attributes simultaneously: appearance, aroma, texture, taste
etc.” [61] (p. 65).
Turning now to the frequency distribution of the identified sweet taste liker phenotypes, one third
of our participants were classified as SLs, a proportion consistent with observations by others who also
used HCA as their phenotyping method of choice [9,13,14]. Conversely, results in Asao et al. [27] and
Kim et al. [62] indicate that this sweet-liking pattern accounted for roughly 50% of their study samples.
Two possible explanations can be considered. First, the absence of a monotonically negative slope
implies that individuals in both cohorts generally exhibited stronger liking for sweetness. Notably,
in Kim et al. [62], two thirds of those classified in the inverted U-shaped phenotype rated 0.7 M as
the most liked, a sucrose concentration breakpoint twice as high as the concentration we identified.
Second, in those studies, sweet-liking was assessed under extreme motivational states with participants’
hunger [27,62] and/or satiety [62] being manipulated. Critically, when the same Korean researchers
replicated their study using a more typical pretest protocol (i.e., refraining from eating for one to
two hours prior to the taste test), their measures generally correspond with the data shown here.
Focusing on the frequency distribution of the monotonically negative slope regardless of the SD label,
our findings disagree with previous observations. For example, of the 650 age diverse adults tested
by Garneau et al. [13], only 55 exhibited decreasing liking as concentration increased. Presumably,
this is due to the relatively low sucrose concentrations they used; indeed, the highest concentration
they used (0.40 M) fell near the concentration breakpoint we identified for our inverted U-shaped
phenotype. In contrast, SDs in Kim et al. [9] were approximately as frequent as SLs and as participants
in the inverted U-shaped phenotype (31.7, 32.5, and 35.8%, respectively). Nonetheless, they reported
that, for the purposes of the study, two distinct clusters were treated as a single sweet-liking pattern
representing the SD phenotype, with no further information provided; each of those clusters accounted
for 10 and 21.7% of the total sample, respectively [9].
Here, despite the similar liking ratings of the lowest and the highest sucrose concentration by
participants classified into the inverted U-shaped phenotype, perceived sweetness varied considerably
when intensity ratings of those stimuli were contrasted. Therefore, this type of response cannot
be attributed to reduced sensitivity to taste stimuli or from differences in recognition thresholds;
rather, it appears to reflect a distinct liking pattern. Figure 5a,c indicated that this is also true
for the SL and the SD phenotype, since inclusion of intensity ratings in the liking plots generated
the expected liking patterns. In previous research, any differences in sweetness intensity between
participants, when reported, were interpreted independent of the associated phenotyping results
(e.g., in References [45,63,64]). The few studies that have contrasted sweetness intensity between the
defined sweet taste liker phenotypes have had mixed outcomes: some studies report greater overall
sweetness intensity in SDs than in SLs and/or than in other phenotypes in line with what we observed
here [12,15,49,65], but the majority found no differences in sweet taste perception [10,13,16,66–71].
These inconsistencies could arise from several factors including the phenotyping methods and the
stimuli concentrations used in these studies. Many of the most relevant studies did not, however,
specifically report differences in sweetness intensity between their defined sweet taste liker phenotypes,
limiting meaningful contrasts between our findings and prior work.
4.4. Recommended Criteria for the Identification of Distinct Sweet Taste Liker Phenotypes
Except for a pilot experiment [27], this is the first study suggesting specific criteria for the
identification of the distinct sweet taste liker phenotypes that could be considered as both statistically
robust and easy-to-apply. One core element of the proposed simpler approach is the administration of
a single sucrose concentration that allows for both a less time-consuming and resource-demanding
assessment process and for elimination of potential issues from the contrast effects which areYou can also read