Shining a Spotlight on DNA: Single-Molecule Methods to Visualise DNA - MDPI
←
→
Page content transcription
If your browser does not render page correctly, please read the page content below
molecules
Review
Shining a Spotlight on DNA: Single-Molecule
Methods to Visualise DNA
Gurleen Kaur 1 , Jacob S. Lewis 1,2           and Antoine M. van Oijen 1,2, *
 1   School of Chemistry and Molecular Bioscience and Molecular Horizons, University of Wollongong,
     Wollongong 2522, Australia; gk980@uowmail.edu.au (G.K.); jacobl@uow.edu.au (J.S.L.)
 2   Illawarra Health and Medical Research Institute, Wollongong, New South Wales 2522, Australia
 *   Correspondence: vanoijen@uow.edu.au; Tel.: +61-2-4221-4780

 Received: 12 December 2018; Accepted: 29 January 2019; Published: 30 January 2019

 Abstract: The ability to watch single molecules of DNA has revolutionised how we study biological
 transactions concerning nucleic acids. Many strategies have been developed to manipulate DNA
 molecules to investigate mechanical properties, dynamics and protein–DNA interactions. Imaging
 methods using small molecules and protein-based probes to visualise DNA have propelled our
 understanding of complex biochemical reactions involving DNA. This review focuses on summarising
 some of the methodological developments made to visualise individual DNA molecules and discusses
 how these probes have been used in single-molecule biophysical assays.

 Keywords: DNA; single molecules; fluorescence microscopy; DNA complexes; protein complexes

1. Introduction
     The development of physical tools to study biological processes on DNA with high resolution has
yielded unprecedented insight into the molecular mechanisms that define life. An array of methods
have been developed to allow for the visualisation and manipulation of individual DNA molecules.
Many of these advancements have been driven by our quest to understand how DNA is read, copied,
stored and protected inside cells. Progress through technical innovations and multi-disciplinary research
efforts combining chemistry, molecular biology and microscopy have provided detailed snapshots
of the inherent molecular structure, dynamics and roles DNA adopts during biochemical reactions.
In particular, studies of DNA replication have benefited greatly from single-molecule fluorescence
microscopy, where information obtained from traditional methodologies is combined with single-molecule
imaging. This marriage of information has led to many significant breakthroughs and subsequently has
challenged our understanding of how these multi-protein complexes operate on DNA.
     To introduce this review, first, a few words on why single-molecule DNA studies are important,
especially given the considerable effort required to carry them out. So why study DNA molecules with
single-molecule sensitivity when it is often easier to study averaged populations in solution-phase
experiments? It is clear that a wealth of knowledge may be extracted from ensemble-based
methods examining the averaged properties of DNA. However, detailed understanding of short-lived
intermediate states in complex processes or rare events simply cannot be gained by looking at an
ensemble of DNA molecules. Further, it is not possible to directly examine the dynamics of DNA
transitioning from an inactive state/complex to an active state/complex when only a small fraction of
molecules exist in a particular state at a given moment. Only single-molecule-based approaches are
able to probe the heterogeneity of molecular behaviours across a population without the need to trap
intermediate states, synchronise reactions or infer transitions from one discrete conformation to another.
     Over the last two decades, a variety of single-molecule techniques have been developed to
examine DNA in isolation and within the context of biological processes. These techniques include:

Molecules 2019, 24, 491; doi:10.3390/molecules24030491                          www.mdpi.com/journal/molecules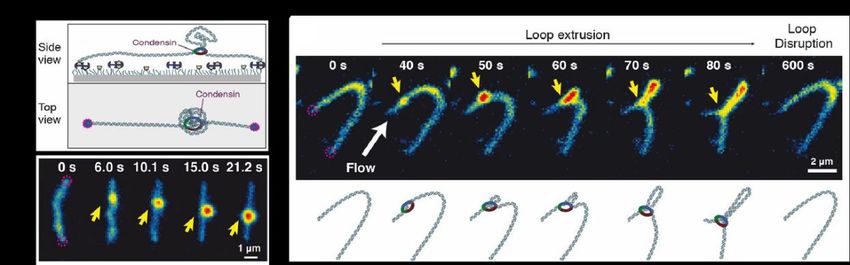
Molecules 2019, 24, 491                                                                                    2 of 20

atomic force microscopy [1], magnetic tweezers [2], optical monitoring of fluorescent probes [3,4],
single-molecule fluorescence resonance energy transfer (smFRET) [5] and tethered-bead flow
stretching [6]. Each technique has limitations, whether it is throughput, time resolution, or the
modifications of DNA required to visualise particular processes or conversions between states.
More often than not, these limitations are inherent to the physical or temporal selectivity needed
in order to resolve single DNA molecules and adequately study them. Generally, this means localising
DNA in a discrete volume, so it can be physically separated and distinguished from other molecules.
Localisation is frequently carried out by attachment of DNA to a solid surface (i.e., beads, glass or
proteins) and confinement to a microfluidic channel controlled by flow, electrochemical gradients or
lasers. Moreover, depending on the time resolution of the experiment or type of data being collected,
(i.e., real-time, staged or end-point), it is important to precisely track individual target molecules over
time. In doing so, detailed information can be extracted from single-molecule time trajectories at a level
of detail that is otherwise hidden in conventional ensemble studies. Access to these particular details
has been made possible through the development of sensitive electron-multiplying charge-coupled
device cameras, software/algorithm development, improvement of conjugation chemistry, preparation
of new fluorescent chemical compounds and reconstitution of complex multi-protein complexes.
       After the publication of the structure of the double helix [7,8], attention was focused on
understanding the role of nucleic acids in biological processes, specifically those that use DNA as a
template. It was not surprising that these efforts resulted in methodological advancements to achieve
the direct visualisation of single DNA molecules. Electron microscopy (EM) was at the forefront of
these methodological developments. Building on work from William and Wyckoff [9], Hall and later
Griffith established shadow-casting EM as an ideal technique to visualise individual DNA molecules in
isolation and bound to specific protein complexes [10,11] (Figure 1). Intensive research using EM over
the next two decades resulted in numerous high-resolution DNA structures. Through interpretation
of these high-resolution static snapshots, researchers realised that DNA molecules vary in structure
across whole populations and that DNA exists in different types of shapes and topological forms,
depending on its origin and what biological processes were acting on it. Although continued progress
and tool development in EM has rapidly expanded in the intervening thirty years, the challenges
remain the same. How can we select individual DNA molecules and study their behaviours to better
understand the structures and dynamics across entire populations? Furthermore, how do we reconcile
these behaviours in the context of complex biochemical reactions, such as DNA replication?
     Molecules 2019, 24, x FOR PEER REVIEW                                                            3 of 20

          Figure
      Figure     1. Visualising
             1. Visualising  DNADNA molecules
                                  molecules   using
                                            using   electronmicroscopy.
                                                  electron   microscopy.An
                                                                        Anelectron
                                                                           electron micrograph
                                                                                    micrograph generated
                                                                                               generated by
          by shadow-casting electron microscopy of multiple DNA polymerase proteins bound to individual
      shadow-casting electron microscopy of multiple DNA polymerase proteins bound to individual DNA
          DNA molecules (reproduced with permission from [11]).
      molecules (reproduced with permission from [11]).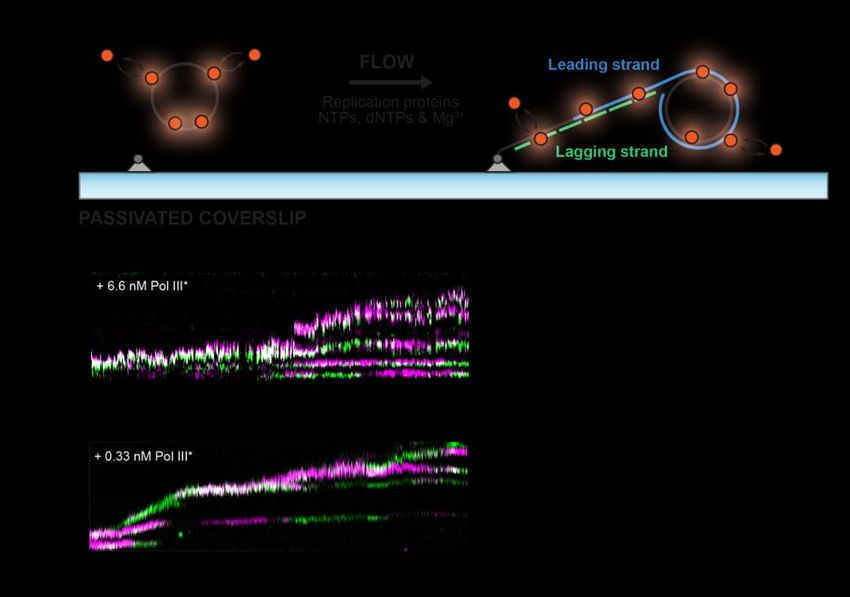
Molecules 2019, 24, 491 3 of 20
Visualisation of DNA and the transactions that occur on it by single-molecule approaches has
expanded so rapidly that it is not possible to comprehensively review all of it. Therefore, with a
focus on single-molecule fluorescence methods to visualise DNA, this review will use a small number
of representative areas of study to explore the development and evolution of the impressive toolkit
that has been developed to understand the dynamics of DNA. Moreover, we will contextualise
these fluorescence-based tools in studying the molecular details fundamental to DNA replication.
Figure 1. Visualising DNA molecules using electron microscopy. An electron micrograph generated
Thesebytoolkits are broadly divided into those which detect single DNA molecules using the binding or
shadow-casting electron microscopy of multiple DNA polymerase proteins bound to individual
attachment of small(reproduced
DNA molecules molecules and
withthose whichfrom
permission utilise enzymatic activity or binding (Figure 2).
[11]).
Figure 2.2. Overview
Overview of of
different fluorescent
different probes
fluorescent developed
probes to detect
developed singlesingle
to detect DNA DNAmolecules using
molecules
single-molecule fluorescence
using single-molecule microscopy.
fluorescence (From left(From
microscopy. to right)
leftDNA binding
to right) DNA dyes such asdyes
binding YOYO-1suchandas
SYTOX
YOYO-1Orange (SxO) remain
and SYTOX Orangelargely
(SxO) non-fluorescent in solution and become
remain largely non-fluorescent highly
in solution andfluorescent upon
become highly
interaction with the
fluorescent upon bases in
interaction DNA,
with enabling
the bases directenabling
in DNA, visualisation
direct during complex
visualisation biochemical
during complex
reactions.
biochemical Fluorescently labelled proteins
reactions. Fluorescently such
labelled as single-stranded
proteins binding proteins
such as single-stranded binding(SSB) provide
proteins a
(SSB)
provide to
method a method
visualisetolong
visualise
pieceslong pieces of single-stranded
of single-stranded DNA. Modified DNA.nucleotides
Modified nucleotides such as
such as 5-bromo-2-
5-bromo-2-deoxyuridine
deoxyuridine can be incorporated
can be incorporated directly
directly into into synthesised
the newly the newly synthesised DNA and
DNA and labelled bylabelled
treatment by
treatment
with with fluorescently
fluorescently labelled antibodies.
labelled antibodies. Fluorescent
Fluorescent dye molecules
dye molecules such assuch
Cy3as and
Cy3 and
Cy5 Cy5can can
be
be installed
installed at specific
at specific positions
positions in in theDNA
the DNAusedusedininsingle-molecule
single-moleculefluorescence
fluorescence resonance
resonance energy
transfer (smFRET)
(smFRET) studies
studiestotomonitor
monitorconformational
conformational dynamics.
dynamics. DNADNA methyltransferases
methyltransferases (MTases)
(MTases)are
ableable
are to recognise specific
to recognise sequences
specific within DNA
sequences withinandDNAcovalently link fluorescently
and covalently labelled cofactors
link fluorescently to
labelled
generate high-resolution
cofactors optical mapsoptical
to generate high-resolution of large DNA
maps offragments.
large DNA fragments.
2. Visualisation of DNA Dynamics and Topological Intermediates
2. Visualisation of DNA Dynamics and Topological Intermediates
Single-molecule fluorescence microscopy has allowed unprecedented examination of the
Single-molecule fluorescence microscopy has allowed unprecedented examination of the
dynamics of DNA in solution. By coupling fluorescence microscopy with the ability to localise
dynamics of DNA in solution. By coupling fluorescence microscopy with the ability to localise
individual DNA molecules, many unanswered questions in DNA polymer dynamics and topology
individual DNA molecules, many unanswered questions in DNA polymer dynamics and topology
have been revisited. As DNA itself has no fluorescent properties that can be exploited for
have been revisited. As DNA itself has no fluorescent properties that can be exploited for single-
single-molecule detection, it must be “stained” to be detected. Typically, fluorescent ligands that
molecule detection, it must be “stained” to be detected. Typically, fluorescent ligands that intercalate
intercalate between base pairs or bind into the helical grooves are used. The first real-time visualisation
between base pairs or bind into the helical grooves are used. The first real-time visualisation of single
of single DNA molecules, carried out by Morikawa and Yanagida [12] by staining the double-stranded
DNA molecules, carried out by Morikawa and Yanagida [12] by staining the double-stranded (ds)
(ds) DNA isolated from T4 bacteriophage with DAPI, allowed for different structural transitions to be
observed. However, the poor spectroscopic and binding properties of standard dye molecules such
as DAPI made it difficult to obtain high-quality images of single DNA molecules. The development
and commercial production of new dsDNA-binding dyes that remained largely non-fluorescent
in solution and displayed large increases in their fluorescent quantum yield upon binding DNA
have revolutionised single-molecule imaging of DNA. Of particular note are two dye molecules:
YOYO-1 and SYTOX Orange (SxO). Both YOYO-1 and SxO have transformed our capacity to carry
out detailed single-molecule studies of DNA, both in isolation and within complex biochemical
reactions. Therefore, in the following paragraphs we will describe the properties of YOYO-1 and
SxO that make them invaluable to studying DNA at the single-molecule level. Moreover, we will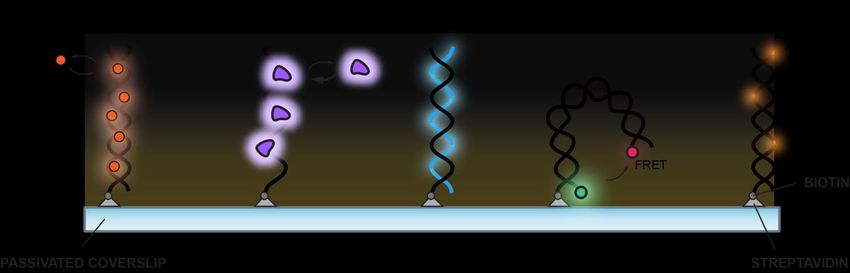
Molecules 2019, 24, 491                                                                          4 of 20

discuss milestone studies that utilised YOYO-1 and SxO during investigations of DNA dynamics and
topological intermediates.

2.1. YOYO-1
      YOYO-1, a dimeric bis-intercalator, was rapidly adopted by the single-molecule biophysics
community due to its attractive kinetic and fluorescence properties. YOYO-1 is a cyanine dye emitting
fluorescence in the green portion of the spectrum. YOYO-1 is largely non-fluorescent in solution
and interacts with dsDNA with high affinity (KD = 5–50 nM, depending on ionic strength) [13–15].
Binding to dsDNA results in a 1000-fold increase in fluorescence intensity. The subsequent increase in
the signal-to-background ratio allows for easier detection of DNA molecules. Since the development
of YOYO-1 by Rye et al. [16], the dye has been successfully used to study dynamics of individual
molecules of phage genomic DNA in solution [17] and the mechanisms of motion of large DNA
molecules during constant-field and pulsed-field gel electrophoresis [18], as well as visualising
the contour lengths of elongated DNA [19]. The use of YOYO-1, however, is not always fully
compatible with all experimental conditions. While binding tightly to dsDNA, YOYO-1 requires long
incubation times and high temperature to obtain homogeneous DNA staining [20]. In experimental
designs geared towards single-molecule fluorescence real-time imaging, the dye binds rather slowly
to individual DNA molecules (~5 min for every 40 nM of YOYO-1) [14]. Like all intercalating
fluorescent dyes, photocleavage of the DNA as a direct result of irradiation with laser light during
single-molecule imaging represents a challenge [21–23]. This type of DNA damage occurs once
the fluorophores are excited, as they may undergo intersystem crossing, generating free radicals
such as reactive oxygen species (ROS). These free radicals can then attack the DNA phosphate
backbone to produce various forms of oxidative photo damage, resulting in single-strand breaks.
It is the accumulation of single-strand breaks in the DNA that can lead to double-strand breaks
and loss of the DNA from the surface in single-molecule experiments. Consequently, imaging
chemistries are continuously being developed to mitigate this effect, by designing ROS scavenging
systems and new fluorescent probes [24]. A successful approach is enzymatic systems that reduce
the concentration of oxygen in solution, such as glucose oxidase/catalase [25], protocatechuic
acid/protocatechuate-3,4-dioxygenase [26] and pyranose oxidase/catalase [27].

2.2. SYTOX Dyes
      SYTOX dyes were originally designed and marketed for staining dead cells and come in a
range of colours [28]. More recently, SYTOX dyes have been used for single-cell and single-molecule
fluorescence experiments [23,29–31]. In particular, SxO, a cyanine dye, has rapidly become the
gold standard for visualising DNA at the single-molecule level. While the exact structure of SxO is
proprietary, it is reported to be monomeric and to intercalate when binding to dsDNA [32]. SxO has
several key advantages over other fluorescence DNA dyes such as YOYO-1. SxO exhibits a >1000-fold
increase in fluorescence upon binding dsDNA, while showing little base selectivity. SxO also has
relatively high binding and dissociation rates [33,34], allowing equilibrium to be achieved immediately
after introduction of the dye to the DNA. The high binding and dissociation rates also minimise the
number of photobleached dye molecules bound to DNA, as photobleached dye molecules will quickly
disassociate and get replaced. These properties make SxO (and SxG [24]) superior to YOYO-1 when
measuring fluctuations or topological changes in DNA.
Molecules 2019, 24, 491 5 of 20
2.3. Polymer Physics with Single DNA Molecules
DNA is frequently used as a model system to study physical principles of polymer behaviour
as it is large enough to visualise its shape at the single-molecule level, yet small enough such that
thermal fluctuations dominate its motion. Intensive research over many decades resulted in numerous
mathematical models to describe the concentration-dependent arrangement of polymers in solution
and the snake-like motion of polymers, aptly termed reptation [35,36]. It was not until a series
of landmark single-molecule studies were conducted by the Chu lab in the 1990s that a number
of important models and hypotheses concerning the elastic and dynamic properties of DNA were
experimentally tested and verified [37]. These experiments relied on YOYO-1 to stain individual DNA
molecules bound to microbeads, which were then simultaneously manipulated by optical tweezers.
By precisely tracking the molecular fluctuations of individual DNA molecules, Chu and colleagues
were able to directly observe the tube-like motion of DNA in entangled solutions of DNA [38].
These observations were critical in establishing the idea of “molecular individualism”, where identical
molecules in the same initial state will choose several distinct pathways to a new equilibrium
state [39,40]. Finally, using a cross-slot microfluidic chamber, Schroeder and co-workers [29] were
able to track the equilibrium extension of individual DNA molecules in extensional flow and
characterise their viscoelastic properties. This work enabled the first direct observation of polymer
conformation hysteresis.
2.4. Knotted DNA
DNA of short length (less than the persistence length of ~50 nm) is a very stiff polymer.
However, in cells where it is present in much longer forms (up to many centimetres), it displays
a much larger degree of flexibility and conformational freedom, making it highly susceptible to
self-entanglement and knotting [41–43]. Knots in DNA can occur as byproducts of fundamental
biological processes, such as transcription, DNA replication, recombination, topoisomerisation and
compaction [44–47].
Production of DNA knots has been achieved in vitro using high electric fields [48], topoisomerase
enzymes [46,49] DNA recombinases [44,50], cyclisation of linear DNA molecules, and most notably,
through manipulation by optical tweezers [51,52]. Traditionally, EM has been used to image knots with
high resolution. Thus, analysis of EM micrographs has allowed visualisation of numerous, well-defined
types of DNA knots generated under various conditions within a product population [53,54]. While EM
enabled detailed studies into the types of DNA knots present under various conditions, no information
concerning the mobility of DNA knots was available. Using YOYO-1 stained bead–DNA–bead
dumbbells manipulated by optical tweezers, Bao and colleagues developed a system capable of
tying several knots into individual DNA molecules and observing their dynamic behaviour, one
knot at a time [52]. Mechanically knotting DNA with beads at either end meant the DNA was
kept under a fixed tension, making localised knot properties independent of the length of DNA.
By directly imaging confined DNA molecules containing knots, they demonstrated that knots are
able to diffuse via a reptation mechanism. Moreover, the measured knot diffusion constants were
correlated with knot complexity. More recently, however, studies aimed to understand the motion of
knots along DNA has intensified, growing with the development of DNA sequencing applications that
enable reads several tens of thousands of bases long. Given the technical challenges associated with
quantifying knot mobility at the nanoscale, many of these studies have been computer simulations [55].
Recently, however, direct quantification of knot motions on unmodified single DNA molecules has been
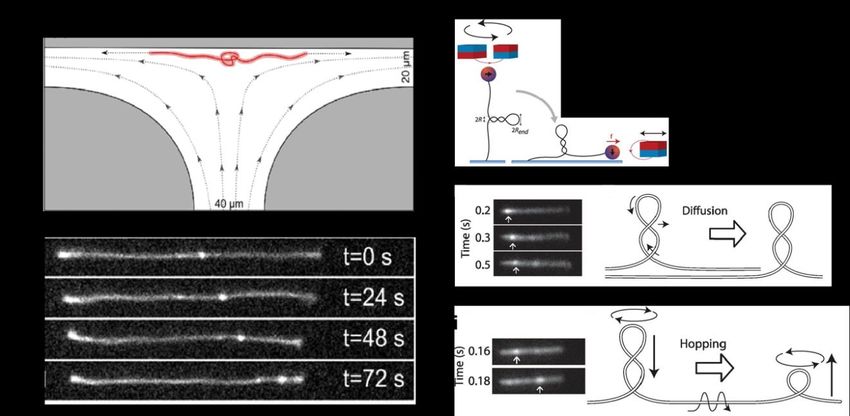
reported. Using T-shaped microfluidic channels and a divergent electric field, Klotz and colleagues
were able to create knotted DNA with different topologies and track their movement over time [56]
(Figure 3A). This novel experimental approach confirmed previous theoretical predications that DNA
knots are able to diffuse along uniformly stretched chains, be driven towards the ends of the molecule
and untie [57]. Moreover, by increasing the electric field, thus increasing tension, knot diffusion slowed.
At higher tensions (Weissenberg number = 1.9), the knots jammed, possibly through intramolecularMolecules 2019, 24, 491 6 of 20
friction [56,58]. Overall, these results are consistent with previous studies showing knots moving
along nanochannel-confined DNA [59] and knots sliding along DNA as they translocated through
nanopores [60].
2.5. DNA Supercoiling
Today, we understand that DNA is topologically polymorphic, that is, it can exist in many
different structural forms. One of these forms, the supercoil, was first illustrated by Vinograd and
co-workers [61] in EM micrographs of circular DNA from polyoma virus. These micrographs revealed
the presence of multiple intertwined loops. These loops, also called plectonemes, play an important role
in the function of DNA inside the cell; for example, the destabilisation of certain DNA sequences [62]
and bringing together of distant DNA loci such as transcriptional enhancers or promotors [63,64].
While high in resolution, the static snapshots generated by EM left many unanswered questions about
the dynamics of plectonemes—are they static? How do they nucleate, grow and shrink?
Mechanistic insights into the dynamics of DNA supercoiling and the effects of related
DNA-processing enzymes that change the state of supercoiling have remained largely speculative,
mainly due to the lack of appropriate experimental tools required to effectively study these dynamic
behaviours. Single-molecule magnetic tweezers, however, have proven an ideal experimental approach
to study DNA mechanics, as they allow twisting and application of a precise stretching force.
However, these single-molecule techniques measure the end-to-end extension of DNA, providing
limited structural information. Dynamic manipulation of DNA using magnetic tweezers was first
demonstrated by Strick et al. [65], where a DNA molecule was torsionally constrained between a glass
slide and a superparamagnetic bead. A pair of magnets pulled the bead vertically toward the magnets
and DNA was supercoiled through the rotation of the bead. As the length of DNA decreased with the
twisting of the bead, plectoneme nucleation was observed. However, it was not until the coupling of
single-molecule magnetic tweezers with fluorescence imaging that the dynamics of plectonemes could
be directly observed. Pioneering work by the lab of Dekker resulted in the development of a magnetic
tweezers apparatus that pulled on SxO-stained DNA molecules sideways while simultaneously
visualising them [66]. In this supercoiled DNA, bright fluorescent spots reflected high local DNA
density, consistent with the existence of plectonemes (Figure 3B). Plectonemes moved along DNA by
diffusion, or unexpectedly, by a fast ‘hopping’ process that facilitated very rapid long-range plectoneme
displacement by nucleating a new plectoneme at a distant position. These findings have important
implications for the processes that take place across genomic DNA, such as the regulation of gene
transactions, sequence searching during DNA recombination or enhancer-activated gene expression.
This novel experimental approach provided a powerful method to visualise and study the dynamics
of DNA supercoiling outside the cell.
The complicated instrumentation and sample preparation required to study plectoneme dynamics
in real-time with single DNA molecules has presented challenges for the accessibility of these
approaches. A high-throughput single-molecule assay for real-time visualisation of supercoiled
DNA molecules using a conventional fluorescence microscope, named ISD (intercalation-induced
supercoiling of DNA) has largely mitigated these barriers [67]. In this approach, SxO is used to
induce supercoiling of linear DNA molecules bound to a surface where the two ends are torsionally
constrained. DNA and plectoneme dynamics are visualised by near-TIRF microscopy, and the
positions and sizes of individual plectonemes can be characterised. Development of ISD has enabled
non-specialist researchers to explore how DNA structure is influenced by DNA sequence and enzymatic
activity on supercoiled DNA.Molecules 2019, 24, 491 7 of 20
Molecules 2019, 24, x FOR PEER REVIEW 7 of 20
Figure 3. Fluorescence
Figure Fluorescencevisualisation
visualisationofof topological
topological intermediates
intermediatesof DNA.
of DNA.(A) Motion
(A) Motionof knots in DNA:
of knots in
(i) A microfluidic
DNA: T-junction
(i) A microfluidic flow cell
T-junction flowwith
cell awith
diverging electric
a diverging field stretches
electric knotted
field stretches linearlinear
knotted DNA
molecules
DNA at its stagnation
molecules point. (ii)
at its stagnation Representative
point. images of
(ii) Representative a single
images of DNA molecule
a single at four time
DNA molecule at
points as a DNA knot (bright fluorescent spot) translates towards one end
four time points as a DNA knot (bright fluorescent spot) translates towards one end of the DNA of the DNA molecule
(reproduced
molecule with permission
(reproduced from [56]).
with permission (B) Dynamics
from [56]). (B) Dynamicsof DNA
of DNA supercoils:
supercoils:(i)(i)Visualisation
Visualisation ofof
plectonemesbyby
plectonemes fluorescence
fluorescence microscopy
microscopy combined
combined with magnetic
with magnetic tweezers.tweezers.
IndividualIndividual DNA
DNA molecules
are supercoiled
molecules by rotating abypair
are supercoiled of magnets
rotating a pair and subsequently
of magnets pulled sideways
and subsequently bysideways
pulled another magnet. (ii)
by another
Fluorescence
magnet. (ii) images of plectoneme
Fluorescence images of diffusion along diffusion
plectoneme an individual
alongsupercoiled DNAsupercoiled
an individual molecule stained
DNA
with SxO. stained
molecule (iii) Fluorescence
with SxO. images of a plectoneme
(iii) Fluorescence images hopping along an individual
of a plectoneme supercoiled
hopping along DNA
an individual
molecule
supercoiledstained
DNAwith SxO (reproduced
molecule stained withwith SxOpermission
(reproduced from
with[66]).
permission from [66]).
2.6.
2.6. DNA
DNA Looping
Looping
DNA
DNA loops loops are
are created
created when
when proteins
proteins or or multi-protein
multi-protein complexes
complexes bind bind toto different
different sites
sites on
on the
the
same
same DNA molecule simultaneously. Consequently, the intermediary DNA loops out, resulting in
DNA molecule simultaneously. Consequently, the intermediary DNA loops out, resulting in
loops potentially up to hundreds of kilobases in length. The seemingly
loops potentially up to hundreds of kilobases in length. The seemingly simple action of DNA loop simple action of DNA loop
creation
creationisiscentral in the
central in coordination
the coordination of manyof fundamental
many fundamentalbiochemical processes,processes,
biochemical the most prominent
the most
examples being the regulation of gene expression [68], site-specific recombination
prominent examples being the regulation of gene expression [68], site-specific recombination [69] [69] and DNAand
replication
DNA replication [30,70].[30,70].
ItIt has
hasbeen beenproposed
proposedthat thatDNADNAlooping
loopingtogether
together with DNA
with DNA supercoiling
supercoiling playplay
critical rolesroles
critical in the in
spatial organization of chromosomes. Structural maintenance of chromosome
the spatial organization of chromosomes. Structural maintenance of chromosome (SMC) protein (SMC) protein complexes
such as condensin
complexes such asand cohesion
condensin play
and key roles
cohesion in restructuring
play genomes during
key roles in restructuring the cell
genomes cycle the
during [71,72].
cell
How SMC complexes participate in these processes is not completely
cycle [71,72]. How SMC complexes participate in these processes is not completely understood. understood. Single-molecule
fluorescence
Single-molecule imaging of single imaging
fluorescence DNA moleculesof single have
DNA enabled direct,have
molecules real-time observation
enabled of DNA
direct, real-time
loops extruded from single Saccharomyces cerevisiae condensin complexes
observation of DNA loops extruded from single Saccharomyces cerevisiae condensin complexes [73]. The looping process
[73].
was observed by staining doubly tethered DNA molecules with SxO while
The looping process was observed by staining doubly tethered DNA molecules with SxO while being being hydrodynamically
stretched in a flow stretched
hydrodynamically of buffer (Figure
in a flow 4). of
By buffer
monitoring
(Figure the4).
fluctuations
By monitoring in fluorescence intensity,
the fluctuations in
the authors were able to determine that condensin-induced loop extrusion
fluorescence intensity, the authors were able to determine that condensin-induced loop extrusion occurred asymmetrically
with an average
occurred rate of 0.6with
asymmetrically kilobase pairs/second.
an average rate of 0.6This finding
kilobase is in stark contrast
pairs/second. to all is
This finding proposed
in stark
models of loop extrusion by two linked motor domains. The authors
contrast to all proposed models of loop extrusion by two linked motor domains. The authors rationalised this unexpected
mechanism
rationalisedby proposing
this unexpected thatmechanism
one site in the condensin that
by proposing complex is stably
one site in thebound to the
condensin DNA, while
complex is stablyits
motor
boundsite translocates
to the DNA, while along
its the
motorsame siteDNA.
translocates along the same DNA.
The details of DNA looping and bending at the nanometre level cannot be studied using
intercalating or groove-binding dyes that sparsely interact with dsDNA in a sequence-independent
manner. To obtain spatial resolution at such length scales, fluorophores can be installed at specific
locations of DNA (or protein) to image specific regions or structural domains of a protein or DNA
molecule. SmFRET is widely used to study the evolution of nanometre-length scale conformational[75,76]. Moreover, the role of DNA looping in facilitating protein diffusion and intersegmental
transfer can be directly addressed using this strategy. In protein-induced fluorescence enhancement
(PIFE) a fluorescent dye on the DNA is placed in proximity to a protein binding site. When the protein
binds to this site, it can enhance the fluorescence intensity of the adjacent dye via PIFE. A DNA-
binding2019,
Molecules restriction
24, 491 enzyme was used to demonstrate the feasibility of the assay, defining its target
8 of 20
search mechanism on DNA through loop-mediated intersegmental transfer [76].
Figure 4.
Figure 4. Fluorescence
Fluorescence imaging
imaging of
of DNA
DNA looploop extrusion
extrusion by
bycondensin.
condensin. (A)
(A) Single-molecule
Single-molecule assay
assay for
for
the visualisation
the visualisation of of condensin-mediated
condensin-mediated DNA DNA looping.
looping. (B)
(B) Snapshots
Snapshots showing
showing DNA
DNA loop
loop extrusion
extrusion
intermediates created
intermediates created byby condensin
condensin on
on aa SxO-stained
SxO-stained doubly
doubly tethered
tethered λ-DNA.
λ-DNA. The
The yellow
yellow arrow
arrow
indicates the location
indicates location ofofthe
theloop
loopbase.
base.(C)(C)Snapshots
Snapshotsshowing
showingthethe
gradual
gradualasymmetric extension
asymmetric of a
extension
DNA
of a DNAlooploop
(yellow arrow)
(yellow on aon
arrow) doubly tethered
a doubly λ-DNA
tethered λ-DNAmolecule (reproduced
molecule with with
(reproduced permission from
permission
[73]).[73]).
from
The details of
3. Visualisation of Single-Stranded
DNA looping and DNA bending at the nanometre level cannot be studied using
intercalating or groove-binding dyes that sparsely interact with dsDNA in a sequence-independent
Single-stranded (ss) DNA is an important intermediate in the fundamental biochemical
manner. To obtain spatial resolution at such length scales, fluorophores can be installed at specific
processes responsible for the maintenance of genome integrity. To date, there is a lack of molecular
locations of DNA (or protein) to image specific regions or structural domains of a protein or DNA
tools that allow direct visualisation of ssDNA using single-molecule fluorescence microscopy. This
molecule. SmFRET is widely used to study the evolution of nanometre-length scale conformational
gap in the single-molecule toolbox is largely due to the inability to reliably produce long segments of
changes of protein–DNA and protein–protein complexes at the single-molecule level. Not only
ssDNA and the unavailability of fluorescent probes that directly bind ssDNA with high selectivity.
is FRET a direct imaging technique; it can also measure distances between fluorophores by the
Moreover, the physical properties of naked ssDNA do not allow it to be readily stretched out under
extent of non-radiative energy transfer between two fluorescent dye molecules (donor and acceptor).
easily accessible experimental conditions, unlike dsDNA. In order to stretch ssDNA to a reasonable
Development of smFRET assays in the Ha and Kim labs have enabled detailed insight into the
length, a force higher than at least 5 pN is required, which is not practical with the laminar flows
thermodynamic and kinetic behaviours of DNA bending and loop formation, with the aim to
typically used in fluorescence-based single-molecule assays [77].
understand the poor ligation efficiencies observed in ensemble cyclisation methods [74–76]. In these
In an effort to overcome these challenges, the properties of single-strand-binding proteins have
smFRET experiments, fluorophores (Cy3 and Cy5) placed at known positions on dsDNA molecules
been exploited. In this context, binding of single-strand-binding proteins (SSB) to ssDNA enables
with complementary overhangs (sticky ends) are immobilised onto the glass coverslip. Fluorescence
stretching and visualisation of ssDNA during single-molecule fluorescence imaging. Bell et al. [78]
signals are observed when molecules are trapped in the looped state due to base pairing between the
generated ssDNA molecules using DNA from bacteriophageλ that had been biotinylated at the 3′
sticky ends. Looping and unlooping of DNA lead to fluorescence intensity fluctuations, where low
FRET signals correspond to the unlooped state and high FRET signals correspond to the looped state.
Subsequently, the looping probability density (J factor) can be extracted from the looping rate and
annealing rate between the two disconnected overhangs. By probing different intrinsic curvatures, the
authors were able to demonstrate that the J factor is sensitive to the intrinsic shape of the DNA [75,76].
Moreover, the role of DNA looping in facilitating protein diffusion and intersegmental transfer can
be directly addressed using this strategy. In protein-induced fluorescence enhancement (PIFE) a
fluorescent dye on the DNA is placed in proximity to a protein binding site. When the protein binds
to this site, it can enhance the fluorescence intensity of the adjacent dye via PIFE. A DNA-binding
restriction enzyme was used to demonstrate the feasibility of the assay, defining its target search
mechanism on DNA through loop-mediated intersegmental transfer [76].
3. Visualisation of Single-Stranded DNA
Single-stranded (ss) DNA is an important intermediate in the fundamental biochemical processes
responsible for the maintenance of genome integrity. To date, there is a lack of molecular tools
that allow direct visualisation of ssDNA using single-molecule fluorescence microscopy. This gap
in the single-molecule toolbox is largely due to the inability to reliably produce long segments of
ssDNA and the unavailability of fluorescent probes that directly bind ssDNA with high selectivity.
Moreover, the physical properties of naked ssDNA do not allow it to be readily stretched out underMolecules 2019, 24, 491 9 of 20
easily accessible experimental conditions, unlike dsDNA. In order to stretch ssDNA to a reasonable
length, a force higher than at least 5 pN is required, which is not practical with the laminar flows
typically used in fluorescence-based single-molecule assays [77].
In an effort to overcome these challenges, the properties of single-strand-binding proteins have
been exploited. In this context, binding of single-strand-binding proteins (SSB) to ssDNA enables
stretching and visualisation of ssDNA during single-molecule fluorescence imaging. Bell et al. [78]
generated ssDNA molecules using DNA from bacteriophage λ that had been biotinylated at the 30
ends, alkali-denatured, neutralised with buffer and subsequently saturated with fluorescently labelled
Escherichia coli SSB. Using this strategy, the authors were able to directly monitor the nucleation and
growth of RecA filaments on SSB-coated ssDNA one molecule at a time. Gibb et al. [79] furthered
this experimental strategy by incubating ssDNA substrates produced from rolling-circle amplification
to produce very long ssDNA curtains anchored to chromium barriers. This approach has allowed
researchers to investigate questions related to protein–ssDNA interactions, especially those critical
in DNA-repair pathways. Using this experimental setup, De Tullio et al. [80] and Kaniecki et al. [81]
watched individual Srs2 helicases disrupt DNA-repair intermediates formed by replication protein A,
Rad51 and Rad52.
4. Studying Biological Processes on DNA: DNA Replication
The classic textbook view taught in biochemistry classes depicts biochemical reactions as being
defined and calculated, resulting in discrete complexes that are largely deterministic. Most biochemical
pathways require the involvement of multiple protein components, typically forming large complexes
which progress through various catalytic states and conformations. Novel fluorescent single-molecule
imaging techniques have made significant headway into challenging these oversimplified views of
biochemical reactions, particularly during DNA synthesis.
Single-molecule approaches have provided a means to simultaneously observe the proteins
and DNA during DNA synthesis, furthering our understanding of the events at the replication fork.
Efficient visualisation of DNA replication at the single-molecule level using in vitro reconstituted
replisomes has largely been achieved using an assay based on rolling-circle amplification of DNA
developed in the van Oijen and O’Donnell laboratories [82–87]. The construction of the template
yields a forked circular DNA which is biotinylated at the 50 tailed end (Figure 5A). The template is
immobilised onto a functionalised glass coverslip, initiating replication through addition of proteins
and flow-stretching the elongating DNA product. During normal conditions, model replisomes readily
generate long segments of newly replicated DNA, hundreds of kilobase pairs long. These long DNA
products can be easily visualised via real-time TIRF microscopy by staining the dsDNA with SxO
or YOYO-1.
Until recently, the replisome was thought to be in a stably associated form during the entirety
of the replication process. During processive replication, a single set of DNA polymerases
are reused for the recurrent synthesis of many Okazaki fragments. Such efficient recycling of
replicative components has been convincingly demonstrated by in vitro bulk-phase biochemical
experiments [88,89]. Single-molecule fluorescence imaging of T7 bacteriophage replisomes has
shown that DNA polymerases undergo rapid and frequent exchange in and out of replisomes [90,91].
The discrepancy with the bulk-phase literature can be explained through the reduction of the exchange
rate of polymerases in and out of the replisome under the highly dilute conditions used in these
original experiments. In the cell, the polymerase exchange mechanism ensures the continuing supply
of polymerases. Recent work conducted in independent laboratories using fluorescently labelled DNA
polymerases have in fact confirmed that DNA polymerases in the gram-negative E. coli replisome are
frequently exchanged at the replication fork [85,92]. These studies were able to extract the dwell times
of individual polymerases at the replication fork, as well as identifying the dependence of exchange
frequency on polymerase concentration (Figure 5B,C). Furthermore, single-molecule studies in other
living cells have seen the exchange of DNA polymerases in the gram-positive bacterium BacillusDNA during DNA synthesis, furthering our understanding of the events at the replication fork.
Efficient visualisation of DNA replication at the single-molecule level using in vitro reconstituted
replisomes has largely been achieved using an assay based on rolling-circle amplification of DNA
developed in the van Oijen and O’Donnell laboratories [82–87]. The construction of the template
yields a2019,
Molecules forked circular DNA which is biotinylated at the 5′ tailed end (Figure 5A). The template
24, 491 is
10 of 20
immobilised onto a functionalised glass coverslip, initiating replication through addition of proteins
and flow-stretching the elongating DNA product. During normal conditions, model replisomes
subtilis
readilyin being recruited
generate and released
long segments from
of newly active replisomes
replicated [93]. Collectively,
DNA, hundreds of kilobasethese
pairsobservations
long. These
support a view of a highly dynamic replisome, one that allows both recycling and
long DNA products can be easily visualised via real-time TIRF microscopy by staining the exchange dynamics
dsDNA
of components.
with SxO or YOYO-1.
Figure 5.
Figure 5. Visualisation of
of replisome
replisomedynamics
dynamicsduring
duringDNA
DNAreplication.
replication.(A)
(A)Cartoon
Cartoonrepresentation
representationof
thethe
of single-molecule
single-moleculerolling-circle
rolling-circlereplication
replicationassay. 50 -biotinylatedcircular
assay. AA5′-biotinylated circular DNA
DNA molecule is is
coupled to
coupled to the
the surface
surface of
of aa passivated
passivated microfluidic
microfluidic flow
flow cell
cell through
through aa streptavidin
streptavidin linkage.
linkage. Addition
Addition
of
of replication
replication proteins
proteins and
and deoxyribonucleotide
deoxyribonucleotide triphosphates
triphosphates (dNTPs)
(dNTPs) initiates
initiates DNA
DNA synthesis.
synthesis. The
The
DNA
DNA products
products are
are elongated
elongated hydrodynamically
hydrodynamically by flow,flow, labelled
labelled with
with SxO
SxO and
and visualised
visualised using
using
fluorescence microscopy. (B) Rapid and frequent exchange of Pol III* (holoenzyme lacking the β2
sliding clamp) is concentration-dependent. Representative kymographs of the distributions of two
different fluorescently labelled Pol III* (magenta and green) on individual DNA molecules at different
concentrations. (C) Exchange times as a function of Pol III* concentration (reproduced with permission
from [85]).
Another widely accepted concept regarding the replisome involves the coordination of leading-
and lagging-strand synthesis for faithful replication. The mechanism behind how the enzymatically
slow steps of primer synthesis and lagging-strand polymerase loading coordinate with the high
rate and continuity of the leading-strand polymerase are largely speculative. Many contradicting
models have emerged in the literature to explain such a mechanism of coordination [30,82,88,94–98].
Recent studies by Duderstadt et al. [99] propose that replication can occur via multiple coordination
pathways and is regulated by both ssDNA looping and leading-strand synthesis pausing. Another
proposed mechanism suggests that leading-strand synthesis is not delayed during priming, but
rather that the leading-strand polymerase synthesises slower than the lagging-strand polymerase [70].
Conformation of the lagging-strand template was investigated using DNA FRET pairs observing
the formation of priming loops on the lagging strand. This implied that DNA synthesis can
continue without interruption and that primers can be synthesised parallel to DNA polymerisation.
In E. coli, the separation of the helicase and primase functionality into two distinct proteins further
complicates the replisome and hence grants access to a broader range of possible coordination
mechanisms. The possibility that the replisome does not coordinate leading- and lagging-strand
synthesis, but instead consists of independent replication proteins acting in kinetically discontinuous
replication has been further investigated by Graham et al. [100]. Experimental evidence provided by
visualising DNA molecules stained with SxO establishes that individual trajectories of both leading-Molecules 2019, 24, 491 11 of 20
and lagging-strand Pol III cores display comparable synthesis rates stochastically scattered with pauses.
Additionally, priming frequency is inversely correlated to DnaG concentration, but has no effect on the
synthesis rates of either polymerase. The replisome is described as containing individual components
that accommodate the discontinuity of lagging-strand synthesis by slowing down. This stochastic
model of DNA replication makes it more likely that a replisome can progress past damage on the
template DNA, an area of study that remains to be investigated.
Novel single-molecule fluorescence tools have been developed to examine eukaryotic DNA
replication in real time. While real-time single-molecule fluorescence assays using entirely reconstituted
eukaryotic replisomes have not yet been achieved, investigation using cell-free extracts derived
from Xenopus eggs have yielded important biochemical insights [101–104]. By visualising individual
DNA molecules replicated by replisomes assembled from undiluted Xenopus extracts, Yardimici and
co-workers [105] demonstrated that no physical association is required between sister replisomes
during elongation. These observations suggested that replisomes emanating from the same origin can
function independently during DNA replication. Replication was detected after partial completion of
the replication reaction by two independent means: the use of fluorescently labelled anti-digoxigenin
to detect incorporation of digoxigenin–dUTP and SxO to stain dsDNA. Individual proteins bound at
the replication fork could not be visualised due to the background arising from the high concentration
of the fluorescent protein needed to compete with the extract’s endogenous protein. To overcome this
limitation, a novel imaging approach termed PhADE (photoactivation, diffusion and excitation) was
developed using photo-switchable fluorescent probes to selectively observe those molecules bound to
a tethered substrate, allowing imaging of single molecules at previously inaccessible concentration
regimes [106]. PhADE exploits the surface confinement of DNA to locally photoactivate DNA-bound
molecules. After photoactivation, diffusion of unbound molecules from the detection volume rapidly
reduces background fluorescence. To demonstrate this approach, the authors labelled the eukaryotic
DNA replication protein flap endonuclease 1 (Fen1) and added it to replication-competent Xenopus egg
extracts. PhADE imaging of high concentrations of the labelled protein (2–4 µM) revealed dynamics of
Fen1 on newly replicated DNA.
Using highly purified proteins, Ticau et al. [107] developed a single-molecule loading assay
to understand stoichiometry and dynamics during helicase loading and activation in eukaryotes.
Surface-tethered DNA molecules were fluorescently labelled with organic dye molecules. One or
two fluorescently labelled licensing factors (i.e., MCM2–7 and Cdc6, or MCM2–7 and Cdt1) were
added in the presence of ATP and the protein binding and unbinding was observed in real time by
colocalising the fluorescence intensity from DNA with the proteins of interest. By monitoring the
arrival and departures of these proteins relative to one another, the short-lived intermediate states
could be elucidated. Furthermore, the stoichiometry of the different factors could be derived by
photobleaching the labelled proteins. These studies revealed important steps in the pathway, such as
the recruitment of MCM2–7 one hexamer at a time [108,109]. Subsequently, by monitoring ORC
dynamics, the authors showed that one ORC complex directs the loading of both helicases in each
double hexamer [108–110]. The findings reveal the complex protein dynamics that coordinate helicase
loading and indicate that distinct mechanisms load the oppositely oriented helicases that are central to
bidirectional replication initiation.
The ability to monitor individual multi-protein complexes on DNA during biological reactions
and observe the short-lived intermediate states has challenged our views of multi-protein systems.
In particular, the principles by which they operate are not as linear and deterministic as previously
suggested. Rather, these multi-protein systems may utilise many different pathways to achieve the
desired outcome. This plurality in behaviour has also been observed more recently in studies with
DNA-repair proteins, with the observation of stochasticity and plasticity governing how proteins
recognise mismatched nucleotides using ATP to stably link themselves to the DNA in order to
facilitate interactions with different proteins [111,112]. The various recent single-molecule studies that
characterise the way in which multi-protein complexes reach a desired biological outcome seem toMolecules 2019, 24, 491 12 of 20
suggest that complex biochemical pathways are largely dictated by the kinetic and thermodynamic
boundary conditions encountered along the way. Thus, these multi-protein complexes display a variety
of behaviours that cannot be described as individual, well-defined pathways, but instead need to be
thought of as complex free-energy landscapes along which reaction coordinates lie.
5. Internal Site-Specific Labelling on DNA: Visualisation of Long DNA Molecules
Labelling DNA site-specifically requires incorporation (or attachment) of small molecules
or functional groups to DNA that are not native to its structure. These modifications may be
achieved chemically or through enzymatic activity. In fluorescence-based approaches, labels are
often fluorophores which enable direct detection of DNA, or haptens, which provide secondary
binding sites for other functionalised moieties (i.e., biotin- or digoxigenin-conjugated nucleotides).
Beyond the scope of single-molecule experiments, labelling DNA in a site-specific manner is of general
interest to many scientific disciplines. Thus, many approaches have been devised (reviewed in [113]).
In the following section, we describe two unique tools from this diverse molecular toolkit that allow
sequence-specific labelling of genomic DNA molecules.
5.1. Molecular DNA Combing
Manipulation of DNA is difficult in its natural coiled state, so most single-molecule imaging
strategies require confinement of DNA to a physical surface, followed by either mechanically stretching
out the DNA, by physically pulling on it or stretching it out in a flow of buffer. Molecular DNA
combing has been used as a single-molecule approach to examine chromosomal DNA that has been
pulse-labelled with halogenated analogues of thymidine [114], including 5-bromo-2-deoxyuridine
(BrdU), 5-iodo-2-deoxyuridine (IdU) and 5-chloro-2-deoxyuridine (CldU). The synthetic halogenated
nucleotides are incubated with dividing cells, and then the DNA is isolated. Subsequently, the modified
nucleotides within the DNA are fluorescently labelled with antibodies. Individual naked DNA
molecules are then visualised by uniformly stretching them onto a silanised microscope coverslip
through the action of a receding air-water meniscus. Molecular DNA combing is a powerful approach
to accurately monitor both spatial and temporal changes during DNA replication of genomes with
single-molecule resolution. Classical techniques used to identify origins of replication include PCR
and 2D gel electrophoresis, which are able to detect changes in DNA intermediates, such as bubbles
and replicating forks. On the other hand, molecular DNA combing allows precise localisation and
quantification of these DNA intermediates. Therefore, it comes as no surprise that molecular DNA
combing has been used to monitor DNA replication in a variety of organisms from bacteria all the
way up to higher eukaryotes [115,116]. This technique is well equipped to measure origin firing and
DNA replication kinetics, as well as genomic rearrangements. Furthermore, molecular DNA combing
allows for high-resolution analysis of repetitive sequences, which are often difficult to investigate with
DNA sequencing techniques. Importantly, molecular DNA combing can be used to monitor replication
defects caused by gene mutations or by chemical agents that induce replication stress or replication
roadblocks [117]. In comparison to other methods that stretch DNA, molecular DNA combing is a
conceptually simple and reliable method to visualise genomic DNA without the need for tedious
genetic manipulation.
Investigation of genomic DNA by molecular DNA combing using single-molecule fluorescence
microscopy was first established in the mid-1990s. Bensimon and co-workers were able to quantify
the fork speed, symmetry, origin usage and inter-origin distance of bacteriophage λ DNA [114].
Since then, molecular DNA combing has proved invaluable in studying the dynamics of individual
replicons in eukaryotes, mitigating the shortcomings of other techniques such as DNA-chip-based
approaches. For instance, using the chip method to analyse duplication of S. cerevisiae genomes [118],
the average rates of replication fork progressions and origin efficiencies were obtained. Using molecular
DNA combing, analysis of chromosome VI revealed that replication origins, although well-defined,
fired stochastically with no apparent correlation between adjacent origins [119]. While molecularMolecules 2019, 24, 491 13 of 20
DNA combing has bridged the technological gap between the examination of gross chromosomal
abnormalities and sequence-specific alterations [120–122], reliable fibre analysis has been typically
restricted to molecules of 200–500 kilobase pairs in length. Advancements by Kaykov et al. [123]
have been able to substantially improve the procedure to analyse entire chromosomes in fission yeast
and 12-megabase fragments from human cells. This technical advancement has led to detection of
previously unseen origin clusters in human cells. Furthermore, it revealed that origins in human cells
fire stochastically during replication, forming clusters of fired origins. Molecular DNA combing has
also been applied to study protein binding of DNA-processing enzymes. Binding of the bacterial
chromosomal initiation protein DnaA has been observed on combed genomic DNA from E. coli [124].
However, it was not known if DnaA was bound specifically. More recently, Gueroui and co-workers
were able to visualise transcription of combed DNA [125]. The transcription activity of T7 RNA
polymerase occurred when DNA was stretched close to normal length, but not when overstretched to
~150% the normal contour length. Together, these results open the possibilities to study single enzymes
on combed DNA by single-molecule imaging.
5.2. Optical Mapping
Optical mapping was developed to create high-throughput, high-resolution genomic maps that
contain information about the structure of an organism’s genome. Fundamentally a single-molecule
approach, optical mapping requires the mapping of several overlapping DNA molecules to build
a physical genomic map. Like mapping roads to depict structural information of a location
without needing to detail each individual home, genome mapping can be a powerful tool for
understanding variations of large pieces of rearranged or altered genomic DNA. Since their initial
development [19], genome-wide optical maps have contributed heavily to establishing structural
variations and rearrangements, scaffolding and validating overlapping DNA segments for several
large sequencing projects [126–128]. Several platforms have transitioned to labelling genomes
relying on sequence-specific modification of DNA at short target sites. DNA ‘tagging’ is achieved
through enzymatic modification of specific target sites, which are imaged to give a unique overall
genomic structure. Typically, three classes of enzymes are utilised to modify DNA at specific sites.
These include restriction enzymes, nicking enzymes and DNA methyltransferases (MTases) [129].
Commonly, enzymes such as methyltransferases are used to sequence-specifically transfer a methyl
group to the cytosines and adenines in DNA. Most MTases use cofactor S-adenosyl-L-methionine
(AdoMet) as a methyl source. This natural methylation reaction can be expanded to a variety of
reactions using synthetic cofactor analogues. Used in conjunction with modified AdoMet substrates,
these MTases can be used to covalently bind other chemical moieties to specific genomic sequences.
Two labelling strategies that exploit this specific activity are the sequence-specific
methyltransferase-induced labelling of DNA (SMILing) and methyltransferase-directed transfer
of activated groups (mTAG). Neely et al. [130] used the mTAG approach to densely label DNA
with fluorophores and construct optical DNA maps via fluorescence microscopy from individual
DNA molecules deposited on a surface. However, this approach resulted in low labelling efficiency,
as a consequence of slow amino-to-NHS ester coupling kinetics. In efforts to increase fluorophore
coupling efficiencies and reduce the fold coverage required to build reliable maps, copper-catalysed
azide-alkyne cycloaddition was explored [131]. By changing the coupling chemistry Vranken and
co-workers achieved a labelling efficiency of ~70%, from 50% and a labelling density of one label every
500 base pairs. This improvement allowed for a true single-molecule map of the DNA sequence to
be produced, bridging the gap between typical sequencing experiments and long-range information
obtained from traditional optical mapping. In another approach, a one-step chemo-enzymatic reaction
was used to covalently bind fluorophores to DNA at the four-base recognition site of Mtase M.TaqI to
accurately genotype genomes of λ and T7 bacteriophages from a background phage library [132].
Ultimately, the use of methyltransferase-based labelling depends on the availability or ease of
synthesis of modified AdoMet analogues, which are not widely available. However, DNA labellingYou can also read