Question & Answer Summary - USDA ...
←
→
Page content transcription
If your browser does not render page correctly, please read the page content below
USDA Spring Data Users’ Meeting
                                                  April 19, 2022
                                          Question and Answer Summary

Table of Contents

Open Forum: Question and Answer Summary ................................................................................. 2
Written Question and Answer Summary........................................................................................ 27
Presentation Slides ......................................................................................................................... 29

Question & Answer Summary
The following is a summary of questions and answers from the Data Users’ Meeting. Material is
organized based on the order they were answered in the Open Forum. There was not time to
answer all questions, but any unanswered questions were reviewed, and the appropriate
agency has provided a written response. Answers typed in the webinar Q&A are also included.
Slides are appended at the end.

Note: Questions and answers were lightly edited for readability.

                                                                                                                                              1
Open Forum: Question and Answer Summary

Question: Jerry Gidel
 I know it's been a rough transition for everybody in Washington to move have people in Kansas
 City and things of that nature. I had some issues this last week when we didn't have everything
 lined up. I know you have been having new transitions or new technology and things like that
 out there, so I would just like to field a general response from our ERS person on what they feel
 and how things are working together for us on being able to get oil crops feed crop due to post
 report type situations. There were some transitional issues that didn't appear like they should
 have this last week. But that's growing. We all have these issues. I just have to get a response
 back from you how you feel about how things are going and how this coordination between 2
 locations is working out.
Answer: Kelly Maguire
 Just to give you a little bit of a lay of the land for ERS, we have about 285 staff right now which is
 a little bit higher than where we were pre-relocation. So that would have been the October
 2019 standpoint. Now, we were low in October 2019. So being at 285 is great. It brings us back
 up to where we were at that point. We anticipate hiring another 20 or 30 people in the next
 year or so. That would bring us up to what we would call a full capacity. We have hired all of
 our management positions down to the first line supervisor. The last first line supervisor starts
 next week. That is fantastic. And we have filled most of our critical foundational needs, like
 Outlook economists, for example. So now it's just figuring out what additional capacity we need
 based on where the needs lie. So that's kind of the logistics of the agency and staffing. We're
 thrilled that we brought in so many people who have new ideas, fresh perspectives, great
 energy. So it's an exciting time to be at ERS. The staff that we have hired are folks that are
 fresh out of graduate school all the way through mid to later in their careers level. Our
 administrator for example who has been with us now for about 2 years, he was an academic for
 37 years and has joined us. Regarding our location. We went to 2 locations in October 2019,
 Kansas City and Washington DC. Then the pandemic hit and we moved to “remote duty
 stations,” which was a phrase I had never heard of before that time. The Secretary of
 Agriculture moved the entire department to remote duty stations for positions where those
 jobs can be done in a remote environment. So going forward, the agency is going to be mostly
 remote. We will probably have 25 or 30 people who will physically report to offices in
 Washington DC probably about 40 people who will physically report to the office in Kansas City.
 The rest of the agency will work from remote duty stations, that being their home. That's the
 way the department is going and that is not just an ERS decision, it is a move across the
 department. It works, we've been really productive. We're putting everything out that we're
 supposed to. Technology makes that a little more seamless than it might have been a couple of
 years ago. There are hiccups. You noted there were some delays in getting the data that you
 were talking about from the wheat and oil crops reports uploaded to the Cornell library and
 ERS. I think those things have been worked out. We certainly take note of those situations

                                                                                                     2
when they occur so we can make adjustments going forward. The final thing I will say, with all
 of the new talent coming in, we are working on ways to make our data more available and
 accessible to folks. We have an Outlook modernization project where we are pilot testing new
 ways to make our outlook products available. That's something we are in the process of
 working on now.
Question: Paul McAuliffe
 Can you explain why WASDE did not change the April 8 U.S. and Ukraine corn planted/harvested
 acres or yield given the war in Ukraine that started February 25?
Answer: Mark Jekanowski
 Our new year starts in May. What you are seeing in April WASDE, the most recent crops, are
 the 21-22 crops - the current crop that is still being marketed was harvested back last fall. The
 war, which started in February, didn't affect the estimate of the crops that were produced last
 fall. Next month, May, you will see new estimates for production and yield for the U.S. and all
 of the global countries, for the Black Sea and the rest of the year. For April the crops were
 harvested. The production occurred. There is no basis on which to change the production
 estimates from crops that were harvested last fall.
Question: Thomas Rutter
 Are "food" and "feed" interchangeable in your world? Are reports available for mycotoxins, for
 example? My question above refers to safety - feed safety for our livestock.
Answer: Post-meeting follow-up from Joe Parsons
 Looks like FDA has jurisdiction on mycotoxins in animal feeds. This appears to be the most
 recent annual report. https://www.fda.gov/media/130526/download
Answer: Post-meeting follow-up from Agricultural Research Service (ARS)
 We have a couple of labs (Texas, Georgia, Illinois) where our scientists have programs dedicated
 to preventing and managing mycotoxins in food and feedstuffs – but not to my knowledge any
 kind of county, state, or national level reporting (eg, seasonal trends). That said, they may have
 industry or university contacts that can defer to, as well as address the question of the
 difference between food and feed. Please feel free to reach out to Jan Suszkiw, ARS Office of
 Communications jan.suszkiw@usda.gov.
Answer: Written response from Chris Eggerman
 Regarding the question that was asked about mycotoxins in corn, the US Grains Council's corn
 harvest quality report has some information. Here is the link: https://grains.org/wp-
 content/uploads/2021/12/2021-22-USGC-Corn-Harvest-Report.pdf

                                                                                                     3
Question: Unknown
 My question has to do with APHIS. I'm not sure if anybody here can cover it. Specifically about
 bird flu and the data that's provided regularly on occurrences and condemnations and so forth.
 Would it be possible to have an updated data set that can be easily downloaded and then used?
 At this point, you have to do a few steps. There's a drop down menu, copy and paste which is
 basic at this point. So if there could be something provided quickly it would simply make the job
 of analyzing the data easier and eliminate errors. The other part of it is, if we see any errors in
 the data, misspelling, is there a way to submit feedback? It seems at this point there's just a
 reoccurrence there that happens every time I download the data. I have to remember and
 correct the spelling otherwise it wouldn't work.
Answer: Post-meeting follow-up from APHIS
 Regarding downloading the data, there is a “Download Data” button at the top of the
 dashboard.

 If you click this button, a popup directing you to choose the dataset to download and the format
 of the download will appear.

                                                                                                  4
A description of the tables available for download are below. The most valuable downloads are
the tables titled “Table Details by Confirmation Date” and “Map Comparisons” as they give the
most one-to-one mapping to the map and table displayed in the dashboard. Some of the other
downloadable tables include information in various other summary formats which may or may
not be useful for your purposes.
Table Details by Confirmation Date: (the most useful table) Cell values are birds affected in
the given confirm date-county-release state (release date or active) combination
Map Comparisons: gives the last reported confirmed positive date, total numbers of total
flocks, backyard flocks, commercial flocks, and affected birds, across month, by State
Affected States Total: total number of States with confirmed positive flocks, across month
and flock type (including backyard and commercial flocks)
Backyard Flocks by Month: number of backyard flocks confirmed positive, across State, by
month
Backyard Flocks Total: total number of backyard flocks confirmed positive, across month and
State
Birds Affected by Month: number of birds affected (birds in confirmed positive flocks),
across States and flock type, by month
Birds and States Affected Summary: total number of birds affected (birds in confirmed
positive flocks), across month, flock type, and State
Commercial Flocks by Month: number of commercial flocks confirmed positive, across
States, by month
Commercial Flocks Total: total number of commercial flocks confirmed positive, across
month and States
Confirmed Flocks Total: total number of States with confirmed positive flocks and total
flocks confirmed positive, across month, flock type, and State
Header Information: (not useful, purely artifact information for displaying the data)
Regarding submitting feedback, including any errors in the dashboard or data, we encourage
you to submit feedback to APHIS Legislative and Public Affairs at the following email address:
CustomerServiceCallCenter@usda.gov. They will be able to direct the feedback to the
appropriate team. Note that the dashboard has been designed to minimize the impact on field
staff and automate the aggregation of these data from across the States and timeframes so a
specific window for correcting any errors can’t be guaranteed, but we’ll do our best to address
any feedback that comes through.
5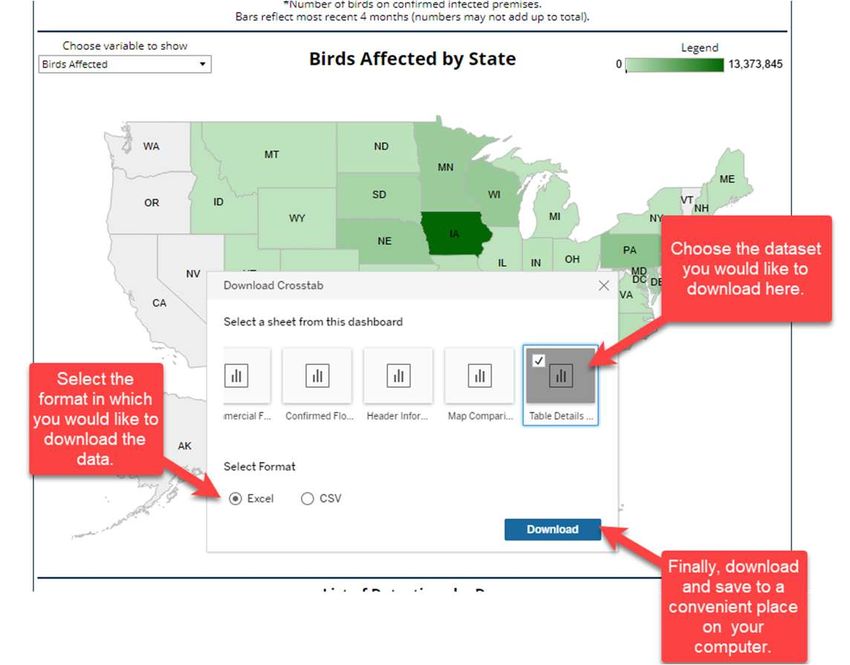
Question: Dale Durchholz
 You are putting more emphasis on world crop data at FAS. I am talking about your IPAD app et
 cetera. We can talk about – the one thing I would suggest is on the main FAS home page there
 needs to be a more obvious link where we can go from the FAS home right over to those
 particular venues. It would be a lot more useful to a lot of us out there. With Crop Explorer, I
 have learned to do a search and jump over. Why hasn't anyone ever addressed putting a direct
 link in to some of these. Now with what you are doing with world production estimates and the
 graphics it would be helpful to a lot of people. I think you would get a lot more visibility of them
 if there was an easy way to directly jump.
Answer: Patrick Packnett
 Thank you for that comment. I really appreciate it. I agree with you 100%. This is something
 we are talking about now working with our folks in public affairs within FAS. In the past, there
 have been a number of reasons why it had not been done, though I won't bore you with them.
 It is something we want to do and it’s in our short-term plans to better integrate those
 resources with the rest of the FAS website. I appreciate you raising it. It gives me energy and
 momentum to take back to Washington to get it done.
Question: Mark Fei
 For the trend line yield of corn and beans, do you feel it’s more difficult to reach or beat it even
 with ideal weather, because the marginal increase on seed/planting/machinery technologies is
 reaching a limitation? Looking forward to see what May WASDE will start with it’s yield
 estimates.
Answer: Mike Jewison
 I would reiterate the methodology that we use for corn and beans is published online, a paper I
 did with Paul Wescott about a decade ago now. Stay tuned for the May WASDE. We are
 evaluating the current information as best we can.
Answer: Written response from Erik Dohlman
 https://www.ers.usda.gov/publications/pub-details/?pubid=36652
Question: Jerry Cessna
 I have 2 top dairy items on my NASS wish list:
 (1) We need better information about processed cheese and dairy products that are very similar
 to processed cheese. By definition, processed cheese is made from natural cheese. However,
 there are some dairy products that most people think of as processed cheese, but they made
 milk protein or other dairy ingredients and may not contain any natural cheese. These include
 products such as Velveeta, cheese-like slices that put people put on sandwiches, etc. These
 products are called “cheese product” instead of “processed cheese.” It would be good to have

                                                                                                        6
separate reporting for each type of product. This would help us with accounting for how milk
 components are being used.
 (2) It would be good if we had data on stocks of skim milk powder. If there are not enough
 reporters to report that specific data, perhaps stocks of nonfat dry milk plus skim milk powder
 could be reported as one aggregate number each month.
Answer: Travis Averill
 (1) I'm not sure exactly what he wants detail-wise to ask the producers for the dairy plants to
 provide for that. We're open to the concept if he can reach out to us and we can talk more
 about that option where we can provide that data if possible. It goes back to our dairy plants
 being able to provide the data in a manner that would be able to be published on a monthly and
 annual basis. Another factor that comes into our reports, is the frequency and volume of the
 data that would be usable for the end product.
 (2) This is a question we have looked into. Unfortunately, we don't have the collaboration from
 our respondents to provide it in this manner at this time. At this time, the answer is a no
 although it is something that we will revisit as necessary for the reports.
Question: Kaitlyn McCullock
 When will the following reports will be available through the API? The ones we are looking at
 right now specifically are the national Bison report the Grass-fed Lamb and Goat report,
 national Grass-fed Beef report, and the daily ethanol report. The national weekly direct feed
 type distribution of fed cattle was released in pdf form was not added to the API it was a new
 pdf. Is that something we should expect going forward? Are pdfs without the data being put
 into APIs and how do we make distinction. I know I’m asking about MARS and the LMR
 database in one question. If you could help me out there.
Answer: Post-meeting follow-up from Jason Karwal
 The plans for moving the Bison, Grass-Fed Lamb and Goat and National Grass-Fed Beef reports
 into the API are not finalized. We have other work scheduled for the near future and once that
 is completed we will determine when these types of reports will be made available in the
 API. We do not have a timeline for these reports at this time.

 The Ethanol reports will be moving into the API within the next 2 months.

 The Weekly Direct Feed Type Distribution of Fed Cattle data is not currently available in the API,
 but there is a CSV file with the data from that report available that updates weekly at the
 following link. https://www.ams.usda.gov/mnreports/lm_ct200.txt

 Not all PDF reports are available in the API. You can pull full lists of reports that are available in
 the APIs by using the report list queries below on each of the APIs.

                                                                                                          7
LMR Query for Reports with Data Available in the
API: https://mpr.datamart.ams.usda.gov/services/v1.1/reports
MARS Query for Reports With Data Available in the
API: https://marsapi.ams.usda.gov/services/v1.2/reports
Question: Karl Skold
On the weekly beef and pork shipments and sales reporting. We've had especially on the beef
side some fairly large revisions. Those revisions get popped into one week. Maybe what is going
on with that both on improving that data and then also why aren't the revisions put in where
they should go.
Answer: Amy Harding
We have had some late reporting of pork and beef. We don't go back to prior weeks and correct
that information unfortunately. And it is a case sometimes if somebody happens to be out with
the exporter company that does their regular reporting, it doesn't get done by an alternate
person. It's nothing intentional that we have found. There really is no way to go back to the
original time frame in our system to update those figures that happen during a certain time
frame prior to when they were reported.
Answer: Patrick Packnett
That's maybe something we could take a look at in the future to see if there is any way within
our system or if we are able to upgrade in any way to be able to reflect the sales when they
actually occurred rather than when they get reported. Unfortunately, right now it seems that
we are not equipped to be able to do it.
Question: Karl Skold
AMS reports the weekly imports for beef and pork and those data are on a PDF unfortunately. I
don't know if they are available elsewhere. But maybe is there a way to get those included so
we can download the data and get more of an electronic copy rather than just a PDF? The
second part of the question is getting more detail on what is being imported across the board
on those weekly numbers as well?
Answer: Post-meeting follow-up from Jason Karwal
Can you please specify which report you are referring to? We have a few different reports that
have import data. Is it the report at the following link?
https://www.ams.usda.gov/mnreports/lswimpe.pdf
You can reach out to mymarketnews@usda.gov with a response to that question and we will
provide an answer.
Question: Ryan Nielsen
Regarding NASS quarterly Grains Stocks reports, does there exist a possibility to segregate
where off-farm stocks are by industry? ie: ethanol plants/export terminals/county
8
elevators/feed yards etc. Or is that level of segregation too confidential or too difficult to
 obtain?
Answer: Lance Honig
 No, we are not going to be able to do. You are right. If we try to break the data down that far
 we will run into all kinds of confidentiality problems and maybe even reporting problems. So at
 least at this time I don't see that as a possibility.
Question: Don Close
 My question is a follow up to Karl's with the weekly export data sales on beef and the
 cancellation and all of the noise, then we've got the export number that is a part of the
 comprehensive cut out report that comes out on Monday afternoon and then we have the
 monthly data that comes from Commerce. None of the 3 align with each other. Which one am
 I supposed to believe?
Answer: Patrick Packnett
 Good question. I don't monitor those other data sets so I'm not sure I can really give you an
 answer. We do the best we can with the data we get on the export sales reporting. That all
 comes to us from the industry from the exporters. Often times as you heard Amy noted earlier
 there are corrections or there are errors that reporters report to us or they report it late.
Answer: Amy Harding
 We don't have all of the codes in our data in export sales that Census does in their data. So our
 figures are not necessarily going to match theirs. That's part of the reason. For instance, there
 is a lot of different variety of meat and meat products that we do not include in our export sales
 reporting information.
Answer: Shayle Shagam
 Amy is quite correct. We are looking at the AMS data they don't treat Canada and Mexico as
 exports. So you eliminate some of that. Then as she points out if you are looking especially at
 the data presented monthly by ERS, it includes processed products. It is not just fresh, chilled
 and frozen. One is more universal than the others are. There are pros and cons. You get the
 information quickly. You get it much more rapidly from the weekly than waiting 6 weeks for the
 monthly Census data. There is also more time for some of the late reporters to get caught up
 plus there is the annual 13th month on the Census where they look at the past couple of years
 so see if there is anything they are missing as well. So you are comparing apples and pears.
 There is a banana thrown in as well by the time you get all 3 agencies in. In terms of which one
 should you use? It is difficult to say. I tend to look at all 3 of them. 2 of them as an early
 warning mechanism. The third one is the numbers obviously that you take for the purposes of
 putting together a forecast.

                                                                                                  9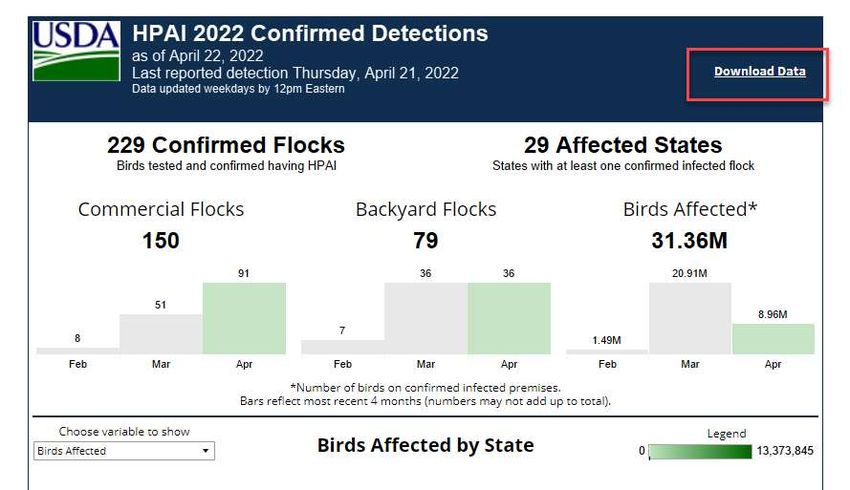
Question: Katelyn McCullock
 Could we consider spreading out the livestock reports on the week before Christmas preferably
 offer the 3:00 p.m. release on the 23? The last 2 years it's been heavy those days and I don't
 think you are getting the exposure you deserve on a lost those reports particularly that you are
 doing stat chat and live streaming. I think it would be better industry wide and for you as well if
 you moved it off such a time sensitive date and time relative to the holiday. Broiler hatchers
 look lonely on Wednesday, maybe you could just shift some of those reports over. I know it is
 tough depending on what day Christmas falls.
Answer: Travis Averill
 Happy holidays. Looking at the calendar, the first thing we are always looking at are the data
 collection days for respondents to provide their data, because if you look at our response rates
 we are trying to make sure response rates are adequate in coverage there. The shorter you
 make that the tougher it is for us to get quality data in for our estimates. So that's the key
 factor there is we are trying to put out the most reliable data possible. We push it to the end so
 that we can have as much time as possible for our part and try to give people time off for the
 holidays. It is just by coincidence it is that way. In short years it is even worse. In longer years
 it's not as bad in the process. But when you are getting December hog data in 10 days of data
 collection versus a 14 or 15 day window, that's substantial in the process.
 Like Katelyn emphasized, we are hosting a #statchat like Dan mentioned earlier. I always
 encourage people to participate in that. Since I've started no one participates or ask questions.
 We are trying to be transparent and answer questions that people have regarding those
 releases as we put them out.
Answer: Dan Kerestes
 Do you have a particular suggestion about when you would put those reports out?
Answer: Katelyn McCullock
 Tuesday or Wednesday are almost always better. The other thought is you could put it out after
 Christmas.
Answer: Dan Kerestes
 We hate to have people say we are sitting on data, so we try to release the data as soon as
 possible. That's always been the mission of NASS, collect the data as quickly as you can getting
 the highest response rate and putting it out to the public and putting it out to the data users
 whether it is livestock, crops or economics. We want the data users to have those reports as
 quickly as possible. Sometimes it doesn't fit with the holidays. We apologize for that. But our
 staff are also trying to spend time with their families. So, we will work with you as much as we
 can. If anyone does have suggestions, please let any of the Branch Chiefs know and we'll discuss
 it.

                                                                                                   10
Question: Mark Fei
I’ve been using some APIs. I’ve found that some Branches have really nice APIs, for example the
FAS U.S export sales. Some branches or agencies don’t. What is the API situation and plan in the
whole USDA?
Answer: Patrick Packnett
I am happy that FAS has been able to provide APIs for all of our databases as noted by the
person asking the question. They have been out there for a while. If people have any input or
questions about them, we are usually able to respond and provide some assistance to folks to
get them up and running to use the data. I can't speak to what the broader plan is for USDA.
We have 3 and they seem to be working pretty well.
Answer: Mark Jekanowski
WAOB is even more simple. We put out the WASDE in 4 formats – .txt, .pdf, Excel and .xml files.
We're always open to user feedback if there are other file formats we need to consider or ways
to think about giving the public better access to our data, we're open to that. As of now these
formats seem to be working well. We will take any feedback that people are willing to provide
on that.
Answer: Dan Kerestes
From the perspective of NASS, we need to update Quick Stats and make them better. We need
to put more APIs out there. We're in the process of doing that. It is not a quick and easy thing
to do. It takes a lot of resources. And that's why for the first landing page that's coming out we
chose livestock because it covered so many different bases for us. Regular surveys, ag business
surveys, the census of agriculture. There are lots of different ways that we collect the data, so it
was our broadest one and we want to take that one first. Once we get that one polished, we
will move into economics and into crops. Two of the people that are leading the drive Bryan
Combs and Tony Dorn. They are the gentlemen that are leading the big push for all of NASS. We
are hoping within the next few years will have it done but it is a big, big task.
Answer: Xuan Pham
ERS has a pilot project in the works now. One of the things that we are explore first is providing
information via an API. That will be coming. You currently can get access to -- we do have API
at ERS. If you go on Google and type ERS API. We have an API page. I will put the link in the
chat for you. You can get our data through API as well right now.
ERS API page: https://www.ers.usda.gov/developer/data-apis/
Answer: Mike Walter
I talked about modernization. It is one of the things we've discussed. I would love more
feedback. I think in some ways we trend the other way. Our agency is more after the fact data
rather than informative data. I would love your feedback if that's more beneficial to provide
11data through an API or more beneficial using dashboard tools providing summary data than can
be exported.
Answer: Janet Linder
At AMS we are working to add more of our price series into the API. It's a long-term project and
each commodity division is being handled separately. But we are making steady progress. A
good portion of the dairy price series are already in the API. But we are adding to it as best as
we can. Kim Mercer from specialty crops is also on the call to address the specialty crops
portion.
Answer: Kim Mercer
By the end of this year we hope to have legacy data for specialty crops as well as livestock will
be online with their API for their data. That includes everything that was already in the Oracle
system so searchable and then moving on further data will be joining in future years as further
enhancements as we move forward. By the end of this calendar year we should have most of
our current data available via API.
Answer: Joe Parsons
The heart of the question whether there is an USDA strategy for APIs. The data are so federated
I'm not sure you can simply have one universal API to get all of the data from AMS, FAS and
NASS et cetera. I think we are working on trying to make our data more accessible such that
those APIs are clear about how you get data and how you can pull things directly.
Question: Dale Durchholz
I have a suggestion for Mike. The acreage data you put out monthly starting in August why don't
you move it out of the electronic reading room and get it to a more visible spot so people can
get to it easier. I have people asking me where did you find that? Just make it more visible.
Answer: Mike Walter
Couldn't agree more. It is one of our top objectives. The person that has been doing that
retired. It is now our opportunity as we are transitioning that to somebody else and modernize
the process. Fully agree with you.
Question: Dale Durchholz
For the last couple of years as we go through the fall and into the early part of winter and
January and February, we always seem to be having huge revisions to weekly export sales of
soybeans and we don't see that big significant change in export sales for wheat and corn. My
question is why do we seem to be having them for soybeans and not the other two. I
understand why you have revisions. But these seem to be unusually large relative to the other
products.
12Answer: Amy Harding
Other than the fact that export sales are made with future delivery periods most of the time, it
may just be that there was not the need for those further out shipments to happen, so they get
canceled. Other than that, I don't really have any insight on why that happens.
Question: Dale Durchholz
But the revision that's I normally see in the prior week's numbers seem to be a huge upward
revisions they are not cancellations at all. I'm always puzzled why we are seeing a big revision in
soybeans yet I don't see it for corn or wheat on prior weekly sales totals. I'm just looking at the
aggregate -- the cumulative sales for the year on soybeans for example. When I look at
cumulative sales, we are in the spring they are not so big this point around, but when we are in
the fall and early winter like October all of the way out into about January sometime, those
revisions for the prior week are always huge for beans. I'm talking sometimes 5 to 6 million
bushel or maybe more at times. It is always the prior week number that seems to get revised.
Answer: Post-meeting follow-up from Amy Harding
The response to this question is being investigated by the FAS-ESR Team. We would like to have
particular examples of the data Mr. Durchholz is referring to if at all possible.
Question: Jim Long
Will crop yield reports going forward at least for 2022/2023 take into account shortage of
fertilizer supplies domestically and globally?
Answer: Mark Jekanowski
Our yield modeling processes aren't changing year to year, they are always based on the full set
of best information available.
Answer: Mike Jewison
Short answer on that one would be stay tuned for the May WASDE.
Answer: Lance Honig
If you look at the yields forecasted at NASS it will be survey work we do - what you expect your
yields to be. Obviously if they have issues with fertilizer availability they would be factoring that
into the reporting. The objective yield work we do, we go into those sample fields and take
counts, measurements, and send samples to the lab. That would account for any issues such as
this. It would be reflected in the results and then last but not least any satellite analysis we do
would have the opportunity to reflect that. It wouldn't single out that as a particular issue.
Once we get into the game in August for the corn and soybeans there would be an opportunity
for us to capture any impact that that may or may not have.
13Question: Annie Lorrie Anderson-Lazo
We are conducting a farmer study on land tenure/heirs property, is there a subject matter
expert who can speak to us about our survey instrument ? Clarification: We are also interested
in confirming our understanding of the history of relevant data collection.
Answer: Post-meeting follow-up from Kelly Maguire
We connected the ERS expert, Clayton Michaud, with Ms. Anderson-Lazo.
Question: Alan Brugler
Part of my question a minute ago with the fertilizer impact on yields. The farmer will tell us
what the yield is. But I am very interested because this is a known issue how is WAOB going to
handle from May, June and July when they are doing it. Part two of that is, what are we doing
to raise visibility of fertilizer supplies or measure them or the impact of fertilizer inputs. I know
USDA has some input on this. This is a big issue right now and controversy, is it going to hurt
the yields or not.
Answer: Mark Jekanowski
If I would go back again and say our guys they are looking at all of the information they have.
They are looking at fertilizer markets from every source public and private they can find.
Answer: Mike Jewison
Obviously it is a very delicate subject. There is a wide variance on opinions of the impact. We
are obviously evaluating all available sources. As I said with the last question, stay tuned for the
May WASDE. The main thing is know they are considering it. It is a big issue.
Answer: Patrick Packnett
We're not really fertilizer experts. Obviously, it is a big issue. We're also looking at the
situation. But our folks are participating in the same interagency commodity estimate process.
It's a committee effort. We are working with Mike and others. So I don't really have anything
more to add with respect to the WASDE estimates on the fertilizer impacts.
Answer: Mike McConnell
I will sound like a broken record. We're evaluating using all of the information we have including
the cost of production side. That's one of the additional data sources we are evaluating as we
take into account all of the data for the different commodity markets.
Question: Joe Kleinman
Can WAOB provide detailed descriptions of the data used to calculate final exports for each
commodity in the WASDE? ie specific HS codes from census or if FAS export sales shipments etc.
Can FAS provide the specific source for foreign countries’ trade numbers in the PSD dataset?
Clarification: I was not looking for specific HE codes, but rather to indicate if documentation
14could be made available to specific sources for the trade data included in the WASDE and PSD
reports.
Answer: Post-meeting follow-up from Mark Jekanowski
WAOB understands the need for transparency in the WASDE and reliable documentation of the
trade data sources. We will work with the analysts from across the ICEC agencies to compile
improved documentation and post it to our website.
Answer: Post-meeting follow-up from Patrick Packnett
Our commodity analysts can speak to individual countries and commodity sources. USDA
typically uses foreign countries’ official trade data to arrive at final PSD estimates. When data is
not available or of uncertain quality, USDA also uses reports from agricultural attachés at U.S.
embassies, data from international organizations, publications from individual countries,
information from traders both inside and outside a country, and other available information to
reach the best estimate. Early season estimates prior to trade data becoming available is
forecast based on a variety of information including, the general economic situation, supply and
demand conditions, sales information (where available), historical trade patterns, etc.
Question: Eric Moore
My question is about the AMS API. Is the plan to eventually move the legacy historical data
some of which is not found on the API to the API? It seems like there is a gradual process of
moving some of those reports to the market news API and I'm wondering if there is a schedule
or if it is not quite so sophisticated when everything will be eventually available on the API.
Answer: Janet Linder
That is a great question. And thanks for being interested in the API. We're pretty happy with it
as a new development. Well, for dairy specifically, I believe we do plan to move a good portion
of historical data to the API. But not necessarily things from 50 years ago. So maybe things in a
more recent history. I think the same is probably true for some of the other news organizations.
Kim can certainly speak to the crops part of it. I think the plan is to certainly get as much on to
the API as possible. It is not as formal a thing as a schedule. Some of it has to do with the
funding. It takes money to do these enhancements. As the funding is available, we're making
plans to move things over as best we can. And our first goal was to obviously get all of the
market news divisions present in the My Market News data site. So that's the first thing. Then
coming after that will be the enhancements of trying to update the things that are available via
the API. I don't know if Kim has something else very wants to add to that.
Answer: Kim Mercer
Specialty crops and livestock have coordinated a little bit on that. Where our current data is
complete, we have set a time. I believe it is 2 years for correctable data and I think up to 5 years
for complete data to transfer over to the API. It could be as much as ten years depending on
resources. We have decided to be consistent on that. It will be a good chunk of data there. We
15decided to be consistent there together where the data sets are complete. Again, that's just for
legacy data.
Question: Jerry Gidel
The question came up today how the USDA is really approaching this beyond beef, beyond meat
type situation. Is there standard data that gives us a feel how that's doing? Is there an area in
the meat area that's been dedicated to that situation and that type of thing? It's an area would
he have had ups and downs with different products coming into the meat world over the world.
This is the most current one. It really does impact what is going on in the industrial side of
proteins, things of that nature. Some update in that world that's visible would be I think helpful
for both the grain side people and maybe what's going on in beef and meat side of the industry.
What kind of idea and things are there. It's probably things I'm not aware of.
Answer: Kelly Maguire
We haven't done anything that I'm aware of but I'll double check when I am done talking with
the folks on the line with the beyond meat or alternative meat. But we have with the alternative
dairy sources nut milks and things like that. We have a report and chart. I will make sure it gets
into the Q&A where we looked at consumption of the alternative milk sources.
Answer: Written response from Jerry Cessna
Amber Waves article on plant-base milk alternatives with reference to more detailed of journal
article: https://www.ers.usda.gov/amber-waves/2020/december/plant-based-products-
replacing-cow-s-milk-but-the-impact-is-small/
Answer: Molly Burress
We have an agreement for plant-based meat. They genetically use the DNA of the meat to
make it fabricated in the laboratory. We have 5 agreements, one looking at consumer
preferences. The reports are not out yet. I would expect a year or two before publications are
released. It is a cooperative agreement that we just started.
Question: Kaitlyn McCullock
USDA wide, I'm always impressed by how many different products you are putting out across
agencies. One of the key things Jim Robb use to bring up how we used to credit USDA for USDA
data. How should we as a group be thinking of your data separately, should we try to highlight
specific products and your agency when talking about them? How should we as a group be
trying to promote your applications and resources?
Answer: Mark Jekanowski
I think a couple of things I would note. It is always good to be cited. Cite the data when you use
it. Unlike a lot of the other agencies here on the panel, we're also a data user. We recognize the
importance of NASS data, FAS data, and data from across the government. It's all part of what
we use to produce the WASDE. I think it's just important to us. It is gratifying to us to see when
16our reports are cited, our data is cited. Cite it as the source coming from the WASDE, coming
from ERS or NASS. I think it helps us. It helps us with our stakeholders to be recognized in that
respect. I'm not sure what else I would add.
Answer: Dan Kerestes
As a minimum if it says USDA that's great. Agency specific after that. We see a lot of our charts
and graphics that are used and the USDA is scrubbed off.
Answer: Joe Parsons
It is important to close the loop for the farmers and ranchers. We are asking for their personal
information and asking for their time and energy. If they can see the connection between the
survey request and insights from the statistics we publish in their favorite farm publication or
data from from many of you it makes the case for gaining cooperation easier. I think it helps
drive the message that there's value in what they are seeing even if they are not necessarily
going to the NASS website or NASS API. Folks will get their data from many, many sources.
Often after some analysis and such has been applied from you and your counterparts.
Answer: Kelly Maguire
I was going say something along those lines. We are asked how are the data used. You are
asking us to provide all of this data. How is the data used? The more we know how the data are
used by different stakeholders it helps us when we are asking folks to provide this information.
I would also say we have done this little side project trying to get a better sense of folks that are
using the ARMS data. It is so challenging when it is not cited or it's cited in some obscure way to
find out if you are going through literature or doing web scrapes to figure out who is actually
using the data. That helps us better understand what other questions need to be asked on the
survey? Where are there gaps between what the understanding is an what they need? Having
that USDA citation is great. We provide a suggested citation. People are not sure how to cite
the information. We provide a suggested citation for folks to use.
Answer: Lance Honig
I would suggest citing the agency can be helpful too. Sometimes that speaks to where the data
came from and things of that nature. Of course crops is very specific. But I talk to folks a lot
making sure they understand the difference between the World Board and NASS because you
need to understand that yield you see in May comes from a completely different place than the
yield in, NASS forecast in August. There can be value in cited it more specific than USDA.
Question: Andrew Chorniy
Can you please make the morning pork and morning beef reports available via datamart or
Mars or API? Right now they're only available on pdf as of 2 years ago. Thx!
17Answer: Post-meeting follow-up from Jason Karwal
The morning reports are preliminary numbers and the afternoon are the final numbers released
for that day. Currently we only make final numbers available in the API so we are not currently
planning to make the morning pork and beef reports available in the API.
Question: Bennett Meier
Does WAOB have plans to extend the history of their WASDE historical database back before
2010?
Answer: Mark Jekanowski
We have the data back prior to 2010. We continue to try to clean up the older data. It gets
more complicated the further back you go because the WASDE has changed over time, the
tables have changed. The variables that are in the tables have changed. We've been cleaning
that up and we do plan to post the entire data set going all of the way back to 1973. At some
point we're just not quite there yet. It's a massive undertaking of cleaning that data. And for
now we're glad to have it back to 2010. Yeah, we are working ongoing back further.
https://www.ers.usda.gov/webdocs/outlooks/36651/39297_fds-13g-01.pdf?v=8919
Question: Austin Schroeder
It seems like NASS is revising Hogs and Pigs data more times than not, and sometimes by a huge
margin. Are you doing anything to improve data collection as to not have so many large
revisions?
Answer: Travis Averill
The last 2 years has been a struggle during the pandemic. Trying to get the data reflecting what
is actually going on out there has required some revisions. But on sheer magnitude, years ago
back during the 2014 time frame I think it was '14, '15 there were large revisions, one of the
outbreaks and the impact it had. Every quarter except December goes back to the previous 4
quarters for revisions. So when you are trying to get some of those relationship factors because
everything is biological. Some of those biological impacts have to be worked out. That means
going back a quarter, 2 or 3 quarters and then when with you get to December where you allow
more quarters to be open. Throughout this pandemic with some of the challenges that have
been experienced because of slaughter implications, labor, different factors that have been
impacting the industry, as you can see the litter rate pre-COVID that was a linear impact that the
sows were progressing more live pigs per litter. When the pandemic hit some of the quarters
and year comparisons have been minimal changes or down. So the struggle is there too. Labor
has been a challenge for the hog producers in the U.S. which causes some of these impacts that
we're seeing quarter to quarter. That's why we are trying to make sure the data is most
reflective out there for the industry so the decisions and impacts there are what's reality on the
farms. I know USDA and some people will say whatever they say about the data, but it relies on
18our producers providing us the data so we can get the reliable data out there that can be usable
for the industry itself.
Answer: Joe Parsons
Overall we get good cooperation from large hog operations. We document what our
procedures are in a quality report on the NASS website including the coefficient variation to
describe that uncertainty in the data. So that's a good place to go if you want to learn a little bit
more and some details as well.
Answer: Dan Kerestes
The quality measure reports - we are putting out more and more of those. Joe’s division is
working on those with SD and we're putting out more and more quality measure reports so you
can see how good the data is and you can see a measure of that data not just us verbally telling
you. We published the sample size and variation.
Answer: Joe Parsons
As we described some qualitative aspects or qualitative aspects of the data. No data are
perfect. I would point out if you look at our track records, for example, there's some interesting
data to look at to what extent we have had to change between first and final. We have had
some recent revisions in hogs for example. If you look over a longer span of time, it gives you a
good sense of the revisions we've had to make. That is one aspect of looking at quality. And
then I think Dan is talking about our methodology and quality measures. In that we actually
have a couple of pieces useful information. One, we describe our survey programs and the
survey instruments of which there are many. We describe in the Methodology and Quality
Measures some fairly detailed information about what the data collection looked like, what
procedures were, how we adjusted for non-response and weighting issues. How we went about
editing the data so on and so forth. Finally, we include for a few statistics. We include details
on sample size. Both at the national or regional level and also state level. And then some
coefficients of variation that describe the statistical uncertainty we have from having a sample
and having non-response. And then we also do some weighted measures of coverage and what
I mean by that is for example what proportion of the number of hogs in the United States did
we actually have to estimate versus collect data directly for our weighted measure of response?
So, we have a number of items out there that I think if you wanted to dig a little bit further you
can know a little bit more. We're always happy to talk with folks about our procedures. We've
expanded that by quite a bit. We still have some to go. We have one out there for grain stocks.
I think we talked about that in a breakout session a time or so ago. We've got one out there for
hemp, for example.
Answer: Dan Kerestes
You mentioned track reports. We’re tracking 20 years' worth of data. It is all out there. If you
are one that bases your whole assumption on magnitude of revisions, they are all there for all of
19the crops and livestock, major items. We're not hiding anything. Take a look at it and we're
always open to suggestions.
Question: Ryan Nielsen
For the FAS GAIN and Attaché reports, I noticed in a recent Brazilian corn Outlook (mainly
forecasting preliminary 22/23 S&Ds) the report was released (made public) on the 12th. Within
the report the attaché had USDA's official old crop figure as 114 MMT, despite the WASDE
showing 116 in the April release on the 8th. Therefore, the question is why was the attaché
report not using the most current forecast information? Furthermore, on April 13 for Brazilian
soybeans, the attaché report was showing Feb estimates which was a worse 2 months dated.
Answer: Patrick Packnett
Long question but a short answer. It's mostly a timing issue. We do ask our posts to correct to
the current WASDE estimates in the USDA official column. But a report may be written prior to
the WASDE as in this case but made public after the WASDE and hence would not reflect the
latest official estimates.
Answer: Mark Jekanowski
The WASDE reports are the official USDA supply and use estimates for all of these commodities.
Sometimes attaché reports can differ based on timing or other factors. The WASDE is the
official USDA record.
Answer: Mike Jewison
I just want to reiterate for the record the attaché reports are one of many inputs we look at any
given time for the WASDE. It is not the only report we look at it.
Question: Bruno Arthur
Perhaps, a dedicated webpage for detailed ARMS data 1) description / data dictionary, and 2)
access / direction would be a good starting point?
Answer: Kelly Maguire
We have a link on how to access the data API and other information on it.
Answer: Post-meeting follow-up from Kelly Maguire
The API can be accessed here: USDA ERS - ARMS Data API
Question: Dale Durcholtz
You talked about doing some climate change research. What kind of research are you doing
and where is it published? How long term of a research are you looking at? Are you looking at
something that is the next ten years? Are you talking 20, 30 years out? What kind of things are
occurring in that field?
20Answer: Kelly Maguire
I have a couple of highlights. We have a couple of models that we have in-house that we run
that are great for looking at climate impacts. Usually going out no more than 50 years. So those
are things call them economical terms equilibrium models. You tweak one part, and you see
how quantities and prices change throughout the world. We have a model that we use that is
domestic it is the REAP (Regional Environment and Agricultural Programing) model. It is a
mouthful. It is how resources change within the U.S., within the continental U.S., and what it
means for agriculture. Those are 2 models. The CGE allows us to look more long term. The
domestic model we are looking for short term a few years. So, we've kind of really started
thinking about those models. And how we can use those to address climate questions and
issues. The parallel is you also need the data to do that as well. It's a dual exercise. It's not just
a modeling exercise. It's having the data too. There is a whole host of different questions that
one can look at in that space. It takes a little while. So, I would say in the next year or so start
looking and we'll have reports out that will show what we are doing in there. The other thing I'll
just mention that is useful in this space is a survey that we did a couple of years ago with NASS,
the Survey of Irrigation Organizations. This was the first time that a survey like this had been
done in 50 years. There used to be a Census of Irrigation Organizations that was last done in
1978 and there was a drought of information. With NASS, we really started looking at this part
of the industry, who is supplying water, where are they getting it and where is it going. So,
there are a lot of data that are now available on what is going on. We had a sample of about
5000 organizations that we talked to. ERS has been putting out data in that space. We've got
about 6 reports, 3 of them are out drilling down in terms of what are the technologies they are
using to deliver water? Where is that water going? Where is it coming from? That's really
helping to think about the drought aspect of climate change and what that means for drought
resiliency and resiliency of the agricultural sector knowing what is going on in the water space.
Answer: Joe Parsons
Around climate and adaptation, the Office of the Chief Economist’s Office of Energy and
Environmental Policy’s William Hohenstein and his team manages a lot of the things and there's
a lot of information on the OCE website. Dr. Bill Goldner and Dr. Gretchen Kroh in the Office of
the Chief Scientist also coordinate much of USDA climate and adaptation work. So, you can find
a lot of resources there. There is also a discussion about the data needs in order to be able to
measure some of these things and understand where we're at and other things in order to
measure.
Question: Unknown
Attaché reports are they generated by State Department employees or USDA employees?
Answer: Patrick Packnett
USDA FAS employees. Our American agricultural attachés serve in the embassies. We have a
lot of locally employed staff who also work for our agency. They work together with our
attachés at the embassies to compile the information contained in our GAIN reports.
21Question: Karen Braun
First of all, we're talking about the GAIN reports. I love those. Those are so informative and so
useful to learn about just international markets and for anybody that wants to learn about any
country and their trade and their production in anything, that is just so helpful, and I've always
found that. So, keep up that good work. But with Ukraine I'm just curious do you still have
people there on the ground? Are your people in Ukraine? How has the information that you
are getting changed? You're going to be estimating the corn crop here in a couple of weeks. Is
the information that is going into that this year similar to past years? Then the second part of
that question would be about Russia, I know how our presence was reduced there last year. I
am wondering how that information has changed and if that has impacted your Russian
forecasts at all.
Answer: Patrick Packnett
It is a very fluid situation in Ukraine. There is a lot of sensitivity around what is available and
what is not available. I mentioned in my opening remarks that we're using all of the information
that we have at our disposal. We have some in country contacts, I can't really say more about
that. We're not flying blind. We have our geospatial tools. We have satellite imagery and some
high-resolution imagery, along with the geospatial analysis we do. We have not had an official
published attaché report from Ukraine since February I believe was the last one. We're using all
of the other information we have to produce the best estimates possible. The results will be in
the May WASDE. Russia is on an ongoing situation. We talked about it last time we had this
meeting. We don't have a presence there anymore. We understand it is an important player in
the global grain market. And we're looking at options to be able to collect -- continue to have
information available for Russia. If we get some information, we will look at how we can provide
that to the external community. It probably won't be traditional public GAIN reports, but if
we're able to collect information that we find is useful we can publish it in our commodity
circulars or agriculture trade reports that I mentioned earlier.
Answer: Mark Jekanowski
We are relying on the information that FAS is bringing to the table. There is a lot of information
out there. To echo Mike Jewison (WAOB Feedgrains Chair), stay tuned for the May WASDE.
Question: Chris Eggerman
For winter wheat acreage estimates released in January, March, and June, is RMA insured
acreage used at all as an indicator? Is FSA certified acreage data used before the Small Grains
Summary in September?
Answer: Lance Honig
From the RMA side, no, there wouldn't be anything readily available to us for that data that
early in the process. We will have it available in time for the small grains summary in
September. The FSA certified acreage is certainly available by June for winter wheat and there's
22data available there in March as well although it's not as useful at that point because it is still
being cleaned and processed as my friend at FSA can tell you. In some places it can be more
complete. So, we get some value out of it in March. Nothing in December typically. It is far too
incomplete. By the June Acreage report it is pretty good for winter wheat.
A few years ago, FSA changed the way they report cover crop in the certification process. So,
cover crops have their own categories. There are 3 different categories. As an example, in years
past winter wheat that was planted as a cover crop would have been reported as winter wheat
with a cover crop intended use code. That was great for NASS. Now it is reported as a cover
crop. There is no indication if it is winter wheat or rye or take your pick. So, any of that acreage
that is planted as a cover crop, it is impossible for us to determine what that crop is. So, there's
going to be a little bit more gray around area some of those crops like winter wheat that can be
used as a cover crop when it comes to interpreting the certified acreage data from FSA.
Question: Jerry Gidel
EIA issues have come up in my analysis of things along the way. I guess it's just surprising that it
takes so long to get a final number. The April, early late, March 31 data we finally got the
overall data for January. We still didn't get the final, final we didn't get -- guessing in there to
get a final look at how much ethanol production we really have in this country on a monthly
basis. Right now, we haven't got January's yet because it doesn't come out until the 29th. Last
month it didn't come out until the final report. The 1003 number. That's where you get that.
So, it is interesting in the fact that the weeklies give us some sense of that. There's been huge
adjustments on stocks on a monthly basis. I know that is an issue with all stocks. You have
issues back and forth. It seems like to me that the ethanol producers have a better handle on
their stocks and to some extent the number of bushels that they -- the bushels come from the
USDA. It's actually a month ahead of EIA. So, it is a complicated world out there. I would love
to get EIA a little closer to the goal line similar to what we see in the stuff from USDA so we
could have a complete set of data. Right now, we still don't have things completed. Here it is
the middle of April. We haven't got January's data completed I'm sorry to say. That's my
analysis of it. I hope there is enthusiasm in EIA to get faster information.
Answer: Darrin Foltz
Yes, I know speeding up a lot of our data products is of interest to a lot of people. Currently the
functionality that would be required to put out things more quickly isn't currently in our
systems. And like a few of the other organizations we are also going through modernization
efforts and de-siloing some of these products. With that we haven't been able to speed up any
of the publication timelines. It is lower on the priority list as we are in a backlog of development.
It is a wish for a lot of us at the organization to get things out as timely as possible. We're
looking into any of those potential avenues to do that. It is just on the backlog right now.
Question: Ryan Nielson
Just to clarify for the Brazilian oilseeds outlook Attaché report, which was published in April but
showing WASDE Official data from Jan and Feb, that was due to a review-delayed timing issue?
23You can also read