R 706 - Questioni di Economia e Finanza (Occasional Papers) - Banca d'Italia
←
→
Page content transcription
If your browser does not render page correctly, please read the page content below

Questioni di Economia e Finanza
            (Occasional Papers)

            Bank exposure to climate-related physical risk in Italy:
            an assessment based on AnaCredit data on loans to non-financial
            corporations

            by Giorgio Meucci and Francesca Rinaldi
July 2022

                                                                    706
                                                           Number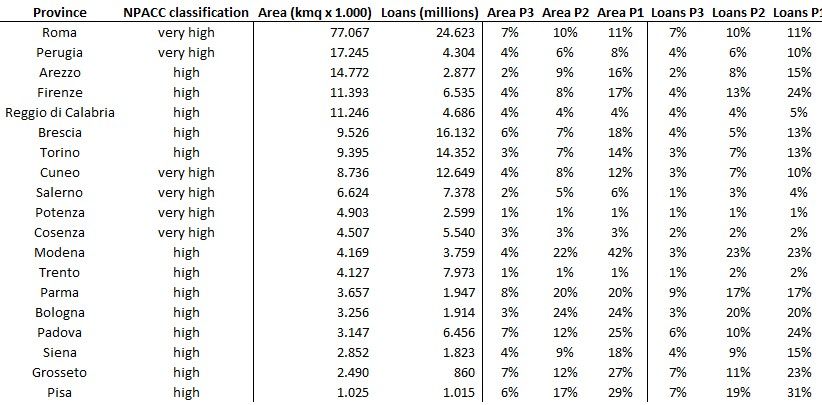
Questioni di Economia e Finanza
(Occasional Papers)

Bank exposure to climate-related physical risk in Italy:
an assessment based on AnaCredit data on loans to non-financial
corporations

by Giorgio Meucci and Francesca Rinaldi

Number 706 – July 2022
The series Occasional Papers presents studies and documents on issues pertaining to
the institutional tasks of the Bank of Italy and the Eurosystem. The Occasional Papers appear
alongside the Working Papers series which are specifically aimed at providing original contributions
to economic research.

                 The Occasional Papers include studies conducted within the Bank of Italy, sometimes
in cooperation with the Eurosystem or other institutions. The views expressed in the studies are those of
the authors and do not involve the responsibility of the institutions to which they belong.

                 The series is available online at www.bancaditalia.it .

ISSN 1972-6627 (print)
ISSN 1972-6643 (online)

Printed by the Printing and Publishing Division of the Bank of Italy
BANK EXPOSURE TO CLIMATE-RELATED PHYSICAL RISK IN ITALY:
  AN ASSESSMENT BASED ON ANACREDIT DATA ON LOANS TO NON-FINANCIAL
                           CORPORATIONS

                                          by Giorgio Meucci* and Francesca Rinaldi*

                                                                     Abstract
       This study provides a first assessment of Italian banks’ exposure to physical risk arising from
climate change in relation to lending to non-financial corporates. Based on granular data on loans and
on the likelihood of climate-related events, we quantify to what extent physical risk could impair the
loan portfolios both by lowering borrowers’ capacity to pay and by decreasing the value of collateral.
The analysis shows that Italian banks' exposure to physical risk is limited overall. In general, only a
few small intermediaries seem to face severe potential exposure to physical risk. More than half of
the risky loans are secured by collateral. However, there is a large overlap between the location of
the debtor companies and the real estate collateral offered as a guarantee. Hence, the exposure through
loans is highly correlated with the exposure through collateral, leading to a potential positive
correlation between the probability of default (PD) and the loss given default (LGD) of exposures in
the event that climate risk materializes.

JEL Classification: Q54.
Keywords: climate change, climate risk, physical risk, credit risk.
DOI: 10.32057/0.QEF.2022.0706

                                                                     Contents

1. Executive summary ........................................................................................................................ 5
2. Introduction .................................................................................................................................... 6
3. Data ................................................................................................................................................ 9
   3.1 Measurement of physical risk exposure of firms .................................................................... 9
   3.2 Credit and collateral data ...................................................................................................... 10
4. Evidence on overall climate risk at the province level.................................................................. 11
5. A focus on small banks ................................................................................................................ 13
6. Evidence on landslide and flood risk at the municipality level .................................................... 14
7. Conclusions ................................................................................................................................... 18
Appendix ........................................................................................................................................... 20
References .......................................................................................................................................... 24

_______________________________________
* Bank of Italy.
1. Executive summary1
This study provides a first assessment of the exposure to physical risk arising from climate change
of Italian banks’ loans to non-financial corporates. Based on granular data on loans and on the
likelihood of climate-related events, we quantify to what extent physical risk could impair the loan
portfolios both by lowering borrowers’ capacity to pay and by decreasing the value of collateral. We
improve with respect to the previous analyses conducted at Banca di Italia by increasing the precision
of the borrowers’ localization, combining data from AnaCredit, Cerved and InfoCamere to locate
each firm’s operating facilities, more relevant than the headquarter to assess climate risk. Further, we
evaluate the role of collateral as a risk mitigation factor.
More specifically, we conduct two exercises based on two different sources of information on
physical risk. The first source is the ranking of Italian provinces by the National Plan for Adaptation
to Climate Change (NPACC); the second source is the exposure of Italian municipalities to
hydrogeological risk from the Istituto Superiore per la Protezione e la Ricerca Ambientale’s (Italian
Institute for Environmental Protection and Research, ISPRA). The first exercise considers all of the
main sources of physical risk but employs a provincial approximation for the assessment of exposure,
whereas the second exercise benefits from a more granular measure of physical risk, but focuses only
on a subset of potential shocks, namely landslide and flood risk. However, the analysis is still
informative, as hydrogeological risk constitutes one of the most critical drivers for physical risk in
Italy and the European Union. A unified framework could be developed if data at the municipality
level for all physical risks become available.
The analysis conducted at the provincial level shows that loans to firms located in provinces
characterized by ‘high’ or ‘very high’ physical risks (on a 5-level scale including also ‘very low’,
‘low’ and ‘medium’) constitute 28 per cent of outstanding loans to firms, in line with previous
analyses for Italy. There are some intermediaries with more than half of their loans to firms located
in high-risk or very high-risk areas, but they account for 4 per cent of total outstanding credit to firms.
Within the category of Less Significant Intermediaries, those with more than half of the business
portfolio at high or very high risk account for 8 per cent of LSI loans, while this same share becomes
27 per cent when we consider only mutual banks (‘banche di credito cooperativo’ and ‘banche
popolari’).
1
We thank Alessio de Vincenzo, Emilia Bonaccorsi di Patti, Giuseppe Cappelletti and Ivan Faiella for the useful
comments. The opinions expressed are our own and do not necessarily reflect those of the Bank of Italy.
5When we consider the more granular classification proposed by ISPRA, wherein we estimate
more precisely the portion of the territory at risk, we find that, the share of loans granted to the
borrowers located in the most vulnerable areas is 8 per cent for landslide risk and 3 per cent for flood
risk. Considering the relevance of hydrogeological risk for Italy, these findings suggest that the use
of the provincial classification may lead to an overestimate of the risk. This happens precisely because
in the provincial classification the entire territory of the province falls in a given risk category k,
whereas the more granular classification proposed by ISPRA provides the precise portion of the
territory at risk for each municipality.
In both exercises, we find that the location of physical collateral and the borrower overlap for the
majority of secured loans, inducing a strong correlation between the direct loan exposure and the one
through collateral. Therefore, the potential for mitigation offered by collateral is reduced.
2. Introduction
In Italy, the average annual temperature during 1981-2010 increased by more than 1.1°C
compared to 1971-2000. The dynamics of the atmospheric circulation systems and the orographic
complexity of the national territory determine a substantial variability across regions of the average
annual rainfall. However, the precipitation indices show an overall statistically significant increase
in the intensity of precipitation events both in the North and in the South (ISPRA, 2013). At the same
time, scenario analyses conducted by the Euro-Mediterranean Center on Climate Change show an
increase in the expected days with a minimum temperature above 20°C in the summer and an increase
in the expected duration of droughts. Moreover, the same analyses foresee decreasing summer
rainfalls in South and Central Italy and increasing winter rainfalls in the North, coupled with an
overall increase in the maximum daily precipitation during summer and autumn, especially in
scenarios characterized by higher greenhouse gas emissions.
Globally, the World Meteorological Organization projects an acceleration in climatic changes
over the coming decades, with extreme weather events becoming more and more severe in terms of
frequency, intensity, spatial extension and duration. Such heightened climatic risk translates into
increasing physical risks, i.e. greater potential economic and financial losses caused by climate-
related hazards. These events may affect households and corporates’ activity through the destruction
of physical capital, the disruption of production and supply chains, as well as through adaptation
costs.
6Physical risk caused by climate-change related events may affect the credit quality of bank loans
through the impairment of corporates and households’ ability to repay financial liabilities, as well as
through the erosion of the value of real assets posted as collateral. In turn, a decrease in the value of
physical collateral increases the expected loss in the event of insolvency. The correlation induced by
climate-related risks between the default of the borrower and the decrease in the value of the collateral
is worth noting. As borrowers and their assets are often located in the same place, extreme climatic
events may impair at the same time repayment capacity and the value of assets backing the debt.
Therefore, climate-related risks might induce a positive correlation between the probability of default
and the loss given default, increasing banks’ risk exposure.
Assessing the financial system’s exposure to physical risk is quite complex and requires a variety
of granular data. Given the nature of events such as flooding, landslides, and droughts, we need to
track both the relevance of these sources of risk and the geographical distribution of the financial
exposures of banks in detail. Then, our exposure assessment will depend on the probability and the
intensity of climate-related physical hazards and the borrowers’ exposure to such dangers.
Current data availability falls short of the ideal granularity regarding the extent to which we can
observe physical risk drivers and corporate exposure. Still, we can perform a preliminary analysis
with which we aim to contribute to the growing number of international and national initiatives related
to climate change and to the assessment of its economic effects.
We present a refinement of the previous assessments of physical risk for the loan portfolio of
Italian banks. We start following the steps in Abdullahi Hassan et al. (2020), where bank loans to
non-financial companies are broken down at the provincial level and classified according to physical
risk, using the approach proposed by Mysiak et al. (2018) and adopted in the National Plan for
Adaptation to Climate Change (NPACC henceforth). NPACC classifies Italian provinces based on
two dimensions: (i) the potential impact of climate change; (ii) the ability to adapt to such a change
and to recover in case of climate-related incidents. While we also report results based on point (ii),
we mainly focus on (i). We do so because the potential impact indicator captures hazard, i.e. the
likelihood of climate change-related damage in a certain province; exposure, i.e. the size of the
population and natural capital exposed to risk; vulnerability, i.e. the Loss Given Default per unit of
exposure. Such indicator is thus better suited for short to medium-term risk assessment.
7We split bank loans to non-financial companies by province based on the location of the
borrowers’ production sites. The location matched with the information on the intensity of climate
risks allows us to assess the firm’s physical risk exposure. We then map each borrower’s exposure to
physical risk to loans to obtain the exposure of banks. We remark that our estimate does not
necessarily coincide with the actual loss, as the materialization of physical risk does not always
translate into default.
We improve with respect to the analysis by Abdullahi Hassan et al. (2020) in two ways. First, we
increase the precision of borrowers’ localization by combining AnaCredit data with information from
Cerved and the Italian Business Register Office to locate each firm’s operating facilities. The use of
Cerved and InfoCamere is an improvement on the standard employed by other studies focusing on
the site of the firms’ headquarters as reported in credit registers. Indeed, the importance of climate
risk is not necessarily related to the firm headquarter site but instead to the location of plants, stores
and other facilities.
Second, we use the granular data derived from AnaCredit as of December 2020 to evaluate the
role of collateral as a risk mitigation or amplification factor. The use of AnaCredit, which is the only
source of this type of information, is crucial for this last task, even if this comes at the cost of
disregarding loans to households. This is an important limitation since households are also affected
by physical risk, and we leave this for future research.
Moreover, acknowledging that physical risk can vary within each province, we complement our
results with a second analysis focused on data on landslides and flood risk in Italy at the municipality
level, available from ISPRA. Indeed, as in the NPACC classification the entire territory is classified
in a given class of risk, the estimates of the exposure at risk could be upwardly biased. For this reason,
we replicate the exercise with the more granular classification proposed by ISPRA, wherein the
precise portion of the territory at risk is estimated for each municipality.
As a caveat, we underscore that our analysis does not consider further relevant aspects that may
mitigate or amplify the impact of physical risk on bank loan portfolios. In particular, we mention: i)
insurance coverage; ii) the possible second-round effects on borrowers not directly exposed to climate
risk; iii) the impact of the conceivable tightening in credit supply by banks experiencing losses related
to climate change. Finally, we mention that a natural disaster could affect firms not only by reducing
8their production but also by decreasing the demand for their output but this second channel is beyond
the scope of the present analysis.
3. Data
3.1 Measurement of physical risk exposure of firms
Following Mysiak et al. (2018), the NPACC2 classifies Italy’s provinces according to their
exposure to physical risk using two indicators (Fig.A1 in the Appendix). These indicators cover two
aspects: (i) the expected impact of climate change, measured by the portion of the territory subject to
the future effects of climate change; (ii) the prospective ability of the local economy to adapt to
climate change, an indicator of the province's potential to mitigate the effects of the expected impacts.
Combining these two measures allows us to evaluate climate change’s effect on the Italian provinces
both in the short and longer term. Indeed, “high” or “very high” values of the potential impact
indicator for a province suggest that the effects of a climatic event might be severe for households
and firms residing there. At the same time, keeping damage’s magnitude fixed, a “poor” or “very
poor” level of adaptability implies an expectation that the province will have difficulties overcoming
the economic shock.
The indicator of potential impact divides Italian provinces into five categories: very low, low,
medium, high and very high. We define as “High Impact” those areas for which this indicator is high
or very high. The indicator of adaptability splits Italy’s provinces into four classes reflecting the
quality and quantity of their economic resources: very good, good, poor, very poor.
To assess corporates’ exposure to physical risk, we need granular information on the geographical
locations of all relevant subsidiaries or facilities. Therefore, in the analysis that follows, we consider
the Nomenclature of Territorial Units for Statistics at level 33 (NUTS3) data from three different
sources to better localize where the firm’s operations take place.
We start from AnaCredit data on the location of each firm’s headquarters at the province level.
We complement these data with information on the number of employees working in each province
for each firm4 from the Italian Business Register Office in the InfoCamere database. Finally, we use
2
This Plan has been prepared by the Italian Ministry of the Environment of the Territory and of the Protection of the Sea
3 Level 3 identifies “small regions”.
4 As a proxy of production site.
9this information to allocate to each Italian province the loans of each company based on the share of
the company’s employees working in that specific province.
In terms of coverage, the firms for which we find information on employees by province in the
Italian Business Register Office represent 76 per cent of outstanding bank loans in AnaCredit. For
the remaining loans, we use Cerved information on the province of the main operating facility of the
firm. In this way, we cover 85 per cent of the outstanding debt in AnaCredit. For the remaining 15
per cent we consider the headquarters’ location reported in AnaCredit.
We end this subsection by stressing two caveats. First, we assume that if a firm has some
employees working in a specific province this implies that that firm has an operating facility there.
Such assumption excludes the possibility that the employer has outsourced its employees to another
firm located elsewhere. Second, the InfoCamere data refer to employees only and consider neither
self-employed workers nor entrepreneurs. For these, if reported, we use the information in AnaCredit.
3.2 Credit and collateral data
Loans are the primary source of exposure to credit risk for Italian banks; indeed, loans represent
43 per cent of total assets at the end of 2020; about 55 per cent are loans to nonfinancial firms. In our
analysis, we track both banks’ direct exposure to nonfinancial firms with loan-level data, as well as
exposure through at-risk collateral, employing collateral data as reported in AnaCredit.5,6 Indeed,
even if the presence of collateral could mitigate the impact of climate-related risks on losses,7
damages to collateral itself are an additional impact channel of climate change-related physical risk.
Here, we exploit the information on the location of real estate collateral for each collateralized
loan provided in AnaCredit to assess whether collateralization mitigates or not physical risk.
Specifically, we define as real estate collateral the guarantees reported in AnaCredit under the
categories “Residential real estate collateral”, “Offices and commercial premises”, “Commercial real
estate collateral”, “Other physical collaterals”, 20 percent of loans are backed by these types of
collateral.
5 Here, we consider exclusively loans granted to companies resident in Italy, while we exclude exposures to counterparties located
abroad.
6
The database includes only loans whose outstanding amount is larger than €30.000. However, it includes, among others, detailed
information on the collateral posted for each loan.
7 If a loan is secured by more than one collateral, we assume that each guarantee covers a percentage of the loan that is proportional
to the relative ratio between that guarantee’s protection allocated value and the sum of the protection allocated values of all the
guarantees associated to that contract.
10In the High Impact area guarantees situated in the same province back 83 per cent of collateralized
loans. Therefore, climate risk may cause an increased correlation between the PD and the LGD for
loans.
4. Evidence on overall climate risk at the province level
Based on the NPACC’s classification, we can identify the provinces wherein firms could
experience a severe reduction in their ability to repay debts due to a climate-related natural disaster,
consequently affecting also the banks that have granted credit to these firms.
Total bank loans to firms reported in AnaCredit amounted to almost 600 billion euros;8 28 per cent
(corresponding to 168 billion) of this total is allocated to provinces with high or very high potential
impact of physical risk (Table 1).9 Considering adaptability, 15 per cent of loans (90 billion euros) is
instead attributable to provinces with “poor” or “very poor” adaptability.
Table 1 – Shares of loans by risk classification
Adaptability
Potential Impact very good good poor very poor Total
very low 1% 2% 0% 1% 4%
low 19% 16% 4% 4% 43%
medium 6% 13% 3% 3% 25%
high 7% 8% 0% 0% 15%
very high 10% 2% 1% 0% 13%
Total 43% 42% 8% 7%
Source: AnaCredit, InfoCamere and Cerved.
Combining both indicators, the percentage of loans jointly considered at risk in terms of very high
impact of a possible climate-related hazard and very poor adaptability of the province consistently
diminishes, because some of the provinces that fall in the high or very high impact category benefit
from valuable economic resources, good education system, infrastructures, institutions and
technology (e.g. Rome, Turin and Bologna), which implies a good adaptability index.
8 At the end of 2020, exposures to counterparties located abroad accounted for 176 billion, 23% of the total reported in AnaCredit.
9 The AnaCredit dataset contains individual reports by around 250 resident credit institutions and surveys all the credit relationships
in which a bank’s exposure to an individual debtor is equal to or greater than €25,000. Therefore, credit relationships not reported are
assumed to be not relevant in terms of amount.
11When considering the role of collateral in mitigating climate risk, we are interested in knowing
which percentage of loans are secured by collateral if climate risk materializes and to what extent
such collateral can plausibly mitigate physical risk, his depends on the impact of physical risk on
collateral itself. Specifically, two alternative extreme hyptheses –are: 1) the collateral is not affected
at all by physical risk and 2) the value of the real estate collateral located in provinces with a (very)
high indicator for potential impact10 is compromised, and only other (non-physical) types of collateral
count as effective backing, respectively.11 The real scenario falls in between this two.
Under the first hypothesis, at the end of 2020, 58 per cent of the total amount of loans (equal to
346 billion of loans; Table 2, Panel A) is secured either by real collateral or by other guarantees and
all collateral retains its value even if climate risk materializes. The share drops to 38 per cent of the
total amount of loans under the second one (Table 2, Panel B). In such case, loans are still secured
only by personal guarantees. Coverage percentages do not vary much over the two scenarios across
different potential impact provinces, with the coverage just slightly lower for both types of protection
in “High Impact” provinces.
Table 2 – Share of loans covered by collaterals
Panel A –All types of collaterals
Source: AnaCredit, InfoCamere and Cerved.
10 In the context of AnaCredit, the protection value relative to a debt contract amounts to the full value of the asset posted as collateral.
In particular, the protection value allocated may exceed the outstanding nominal amount of the debt secured by the protection.
Intuitively, an indicator for loan coverage should be lower than 1. Hence, we need to construct an alternative measure for the collateral
value, equating this to the value of the loan whenever the corresponding protection value allocated is higher than the value of the
outstanding loan itself.
11
Here we define as “non-physical types of collateral” or “personal guarantees” those guarantess reported in AnaCredit not under the
categories “Residential real estate collateral”, “Offices and commercial premises”, “Commercial real estate collateral”, “Other physical
collaterals”. In the absence of more precise information, we assume that these guarantees are non affected by physical risk.
12Panel B – Personal guarantees only
Source: AnaCredit, InfoCamere and Cerved
Note: Panel A of Table 3 reports the share of outstanding loans covered by any type of collateral, Panel B reports the
share of outstanding loans covered by personal guarantees only.
5. A focus on small banks
Given the nature of climate risk and the fact that smaller intermediaries might not be able to
differentiate theirs loan portfolio across provinces with different risk levels, we focus on less
significant intermediaries (LSI) and mutual banks to investigate the exposure of these banks and their
resilience to physical risk.
We focus on the subset of LSIs and mutual banks reporting in AnaCredit12. Among these banks,
those with more than half of their loans to firms located in high-risk or very high-risk areas account
for 4 per cent of the total outstanding credit in AnaCredit.13 Considering only LSIs, the portfolios of
highly exposed banks14 is 8 per cent of total LSI credit to firms, 27 per cent when we consider mutual
banks (Figure 1). Moreover, the 18 per cent of the mutual banks in our sample have at least 75 per
cent of their loans granted to firms located in high or very high-risk areas (10 per cent of the
outstanding credit of mutual banks), while this share is equal to 13 per cent for LSIs (5 per cent of
the outstanding credit of LSIs).
12 Small agents with a derogation can represent at most the 2 per cent of the total outstanding amount of loans reported (see
Regulation EU No.1071/2013 of the ECB).
13 In the Appendix, we report the distribution of the top 10 intermediaries by exposure in the risky and very risky areas (Figure A2).
14 We define “Highly exposed banks” those banks with more than half of their credit to firms located in high or very high risk
provinces.
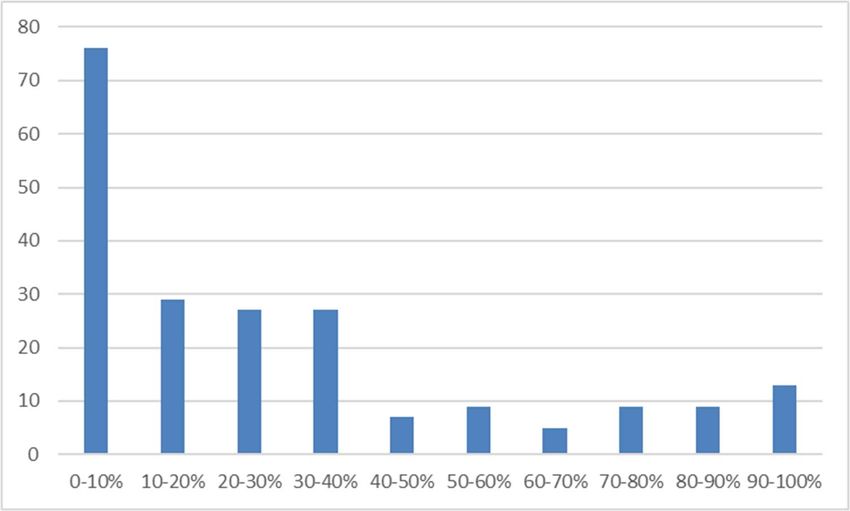
13Figure 1 – Distribution of LSI and mutual banks by loan exposure to physical risk
Note: Figure 2 reports, for each bank category, the distribution of the share of loans attributed to the high or very high
risk area with respect to the total outstanding credit to firms of the same bank category.
6. Evidence on landslide and flood risk at the municipality level
Exposure to physical risk may vary significantly within each province. In this section, we use an
alternative source of information for physical risk based on municipal level data provided by ISPRA.
Municipal level data are only available for two specific sources of physical risk: landslides and floods
risk.
Table A2 show how the ISPRA classification at the municipality level overlaps with the NPACC
classification at province level, both for landslides and flood risk. Provinces categorized as high and
medium risk according to the NPACC have a greater portion of their territory exposed to high
landslide and flood hazard than areas at very high risk (actually, provinces at very high risk have the
lowest portion of the territory exposed at flood risk). The two classifications differ for many reasons.
First, ISPRA draws on historical data on natural catastrophes for its classification, while the
NPACC’s on the expected effects of a specific emissions scenario.15 Second, the former focuses only
15The "intermediate scenario" referred to is the Representative Concentration Pathway 4.5 (RCP4.5) for the period 2021-2050 in
Thomson, A.M. et al. (2011), “RCP4.5: a pathway for stabilization of radiative forcing by 2100”, Climatic Change, 109, 77. In this
scenario, it is assumed a growth profile of emissions compatible with an increase in temperatures between 1.1 ° C and 2.6 ° C
compared to the pre-industrial period.
14on hydrogeological risks, while the latter considers all risks somehow related to climate change,
nevertheless the analysis is still informative as flood risk constitutes one of the most critical drivers
for physical risk in Italy and the European Union.16 Finally, while the NPACC classifies the entire
territory in specific risk brackets, the ISPRA estimates the precise portion of each municipality’s
territory that is at risk.
We must consider the two exercises separately for these reasons, and we compare results with
such caveats well in mind. Indeed, we expect a lower share of loans at risk for the last two mentioned
reasons in the municipality-level analysis.
We first examine landslide risk. Italy is one of the European countries most affected by landslides,
with a struck area equal to 7.9 per cent of the national territory. Along with earthquakes, the most
important triggering factors of landslides are short periods of intense rainfall and persistent
precipitation, phenomena directly related to climate change.
The ISPRA dataset identifies as landslide hazard zones the areas of possible evolution of existing
landslides and those areas where new landslides may potentially occur. In particular, zones within the
area at risk are ranked into five classes of risk (Very high hazard H4, High H3, Medium H2, Moderate
H1 and Attention zones AA), while the remaining territory is considered virtually risk-free. The total
area at risk identified in the ISPRA dataset (H4+H3+H2+H1+AA) represents almost 20 per cent of
the national territory. Therefore, for each municipality, the ISPRA dataset determines the proportion
of land belonging to each of the six (five risky and one risk-free) classes according to the relative
landslide risk. Overall, 8.4 per cent of the Italian territory falls into the most hazardous (H4 and H3)
classes.17
To evaluate firms ‘exposure to landslide risk, we combine AnaCredit and InfoCamere data, as
detailed before, to derive the localization of the borrowers at the municipality level. Next, we partition
bank loans to corporates localized in a specific municipality in proportion to the six levels of risk
identified for that municipality in the ISPRA dataset.
Our combined dataset (AnaCredit, InfoCamere and ISPRA data) covers 90 per cent of the
outstanding bank’s loans to corporate borrowers at the end of 2020. The remaining 10 per cent is
16ESRB (2021). Climate-related risk and financial stability.
17 81.9% of Valle d’Aosta territory belongs to classes H4 and H3. Veneto has the lowest landslide risk, with only 0.6% of its territory
in classes H4 and H3.
15excluded from the analysis as the data concerning landslide risk are either not available or they are
not reliable
Only 8 per cent (corresponding to 4.3 billion) of this total falls into the two most hazardous classes
(H4 and H3), while 81 per cent is considered not at risk (Table 3).
Table 3 – Amount of loans by risk classification
Landslide Risk
H4 H3 H2 H1 AA not at risk
4% 4% 4% 4% 3% 81%
Source: AnaCredit, InfoCamere.
There are 10 per cent of the reporting intermediaries has more than one-third of their loans granted
to firms located in landslide risk areas but they account only for 2 per cent of the total granted credit.
This share increases to 7 per cent when we consider LSIs only and to 8 per cent when we consider
mutual banks only, thus remaining limited.
Unfortunately, data on real estate collateral are available in AnaCredit only at the province level.
Therefore, we can only determine for any loan if it is secured, by which amount and by which type
of collateral. As in the provincial analysis, the two extreme hypothesis are that landslide risk does not
affect collateral at all, and that, on the opposite, the physical collateral is fully exposed to landslide
risk, and the loan can be considered backed only by other (non-physical) types of collateral. However,
as the ISPRA dataset estimates the exact portion of each municipality’s territory at risk, we could
alternatively assume that the same landslide risk affects the physical collateral and the secured loan.18
In the absence of the necessary information, we assume that the collateral and the related borrower
share their location. Since Italian firms are mainly of small size, this seems not a too restrictive
assumption (in the sections above, we have already shown that, at least at the province level, this is
true for 83 per cent of the protected loans).
If climate risk does not affect the collateral, 62 per cent of H4 class loans and 63 per cent of the
H3 class loans are unaffected by physical risk thanks to the presence of collateral. These percentages
are similar in the intermediate case, when the same landslide risk affects the physical collateral and
the secured loan, amounting to 60 and 58 per cent, respectively. Such similarity is due to only a
relatively small portion of the territory belonging to the at-risk class. When only the non-physical
18
With respect to the previous analysis, we can consider also this additional scenario since the ISPRA dataset reports the precise
portion of each municipality’s territory at risk.
16collateral is not affected instead, the climate risk significantly decreases the value of the collateral,
only 43 per cent of the loans attributable to the H4 or the H3 classes would be guaranteed (Table 4).
Granular information on the source of risk allows us to make a more precise assessment of the
potential impact of banks. Yet, as we do not access the same degree of granularity for banks’
exposures, we leave some uncertainty to be quantified using a scenario approach.
Table 4 – Percentage of protected loans by landslide risk scenario
Landslide Risk
H4 H3 H2 H1 AA
Physical collateral not affected 62% 63% 63% 61% 94%
Physical collateral partially affected 60% 58% 58% 53% 93%
Physical collateral completely destoroyed 43% 43% 42% 39% 64%
Source: AnaCredit, InfoCamere.
Note: The table reports the percentage of loans covered by collateral when physical collateral is not affected by
landslide risk (first row), when the same landslide risk affects physical collateral and the secured loans (second row) ,
when physical collateral is fully destroyed and only personal guarantees secure the loan (third row).
We conduct a similar analysis on floods risk. Flood risk includes the risk of floods from rivers,
mountain torrents, lakes, and floods from the sea in coastal areas. The ISPRA dataset considers the
three hazard scenarios of the Legislative Decree 49/2010: The high probability scenario with a return
period of 20-50 years (frequent floods); the Medium probability scenario with a return period of 100-
200 years; the Low probability or extreme event scenario.19 The high probability hazard zones in Italy
amount to 4 per cent of the national territory, the medium probability ones to 8 per cent and 11 per
cent in the scenario with the lowest probability.
Our combined dataset (AnaCredit, InfoCamere and ISPRA data) covers 73 per cent of the
outstanding bank loans to corporate at the end of 2020.20 The remaining 27 per cent is excluded from
the analysis due to inconsistencies in the data concerning flood risk. The percentage of loans at risk
varies between 3 and 9 per cent, depending on the considered scenario (Table 5). A single
intermediary has more than 20 per cent of its loans granted to firms exposed to the P2 area.
19P3 areas are characterized by a return period of 20-50 years, P2 areas of 100-200 years.
20At the date of processing (December 2017), data were not available (especially for P3 and P1 areas) for a number of municipalities
covering approximately 10 per cent of the national territory.
17Table 5 – Amount of loans by flood risk scenario
Flood risk
P3 P2 P1
3% 6% 9%
Source: AnaCredit, InfoCamere.
We perform the analysis of collateral along the lines defined above. If climate risk does not affect
the collateral, 70 per cent of P3 class loans are guaranteed by physical collateral and personal
guarantees, 68 per cent when the same flood risk affects the physical collateral and the secured loan.
When only the non-physical collateral is not affected instead, collateral value is significantly reduced;
only 45 per cent of P3 class loans are guaranteed, by personal guarantees only (Table 6).
Table 6 – Percentage of protected loans by flood risk scenario
Flood Risk
P3 P2 P1
Physical collateral not affected 70% 68% 68%
Physical collateral partially affected 68% 63% 61%
Physical collateral completely destoroyed 45% 43% 42%
Source: AnaCredit, InfoCamere.
Note: The table reports the percentage of loans covered by collateral when physical collateral is not affected by flood
risk (first row), when the same flood risk affects physical collateral and the secured loans (second row) , when physical
collateral is fully destroyed and only personal guarantees secure the loan (third row).
There is one intermediary with more than one-third of its loans granted to firms at flood risk under
P2 and P1, nevertheless this intermediary accounts for less than 0.01 per cent of total granted credit.
The use of the ISPRA dataset allows us to conclude that the exposure to hydrogeological risk through
loans to nonfinancial firms is moderate, implying also a limited number of exposed intermediaries,
mainly less significant intermediaries or mutual banks. However, as already noted for the analysis at
provincial level, the correlation between the direct loan exposure and the one through collateral could
severely impair the potential for mitigation offered by the collateral.
7. Conclusions
This note proposes a first assessment of exposure to climate-related physical risk of the Italian
banking system, focusing on loans granted to firms, and using primarily data from AnaCredit to study
the role of collateral as a factor mitigating climate risk. We try to overcome limitations of previous
relevant investigations by using data from AnaCredit, Cerved and InfoCamere to get a detailed picture
18of each firm geographic exposure to climate change risk. While other studies focus on the location of
firms’ headquarters as the primary driver of exposure, we consider a granular measure of the location
of firm activities across different provinces.
We find that the exposure of loans to physical risk based on the provincial data is between a quarter
and a third of the overall amount of loans to nonfinancial firms. Furthermore, the exposure through
loans is highly correlated with the exposure through collateral, leading to a potential positive
correlation between the PD and the LGD of exposures in case climate risk materializes. In general, a
limited number of intermediaries (mainly less significant intermediaries or mutual banks), accounting
for only the 4 per cent of the total outstanding credit, seems to face severe potential exposure to
physical risk.
To complement the study, we conduct a more detailed analysis on flood and landslide risk
exploiting information at the municipal level. Albeit incomplete, as we consider only hydrogeological
risk, the analysis is still informative. Indeed, flood risk constitutes one of the most critical drivers for
physical risk in Italy and in the European Union. Even so, our analysis of hydrogeological risk points
to the fact that the exposure is moderate when loans are disaggregated and mapped to physical risk at
the municipal level. Unfortunately, a more thorough assessment cannot be performed due to the lack
of data on the location of collateral at the municipal level. Granular data on local industry units and
collateral localization would certainly enhance the assessment of physical risk.
19Appendix
The National Plan for Adaptation to Climate Change classifies Italy’s provinces according to their
exposure to physical risk using a two indicators.
These two measures are constructed as it follows:
- Potential Impact: The expected medium-term effects of an intermediate emissions scenario
are considered.21 The three key elements in the calculation of the indicator are hazard,
exposure and vulnerability. In estimating the hazard, it is considered for each province the
probability of a series of phenomena exacerbated by climate change (e.g. floods, landslides,
heat waves and droughts). The exposure is calculated considering human, physical or natural
capital that could be affected as a consequence of the aforementioned phenomena. Finally,
vulnerability considers the propensity or predisposition of the province to be negatively
affected by the occurrence of the phenomena considered.
- Adaptability - The indicator reflects available economic resources, the level of education,
infrastructures and institutional and technological capabilities.
21
The "intermediate scenario" referred to is the Representative Concentration Pathway 4.5 (RCP4.5) for the period 2021-2050 in
Thomson, A.M. et al. (2011), “RCP4.5: a pathway for stabilization of radiative forcing by 2100”, Climatic Change, 109, 77. In this
scenario, it is assumed a growth profile of emissions compatible with an increase in temperatures between 1.1 ° C and 2.6 ° C
compared to the pre-industrial period.
20Fig. A1 - Italian provinces classification according to the two-dimensional index that measures at the
province level the potential impact of climate change and the province’s ability to adapt to such
changes (Source: National Plan for Adaptation to Climate Change)
Panel A
Adaptability
Potential Impact very good good poor very poor
Monza e della Brianza, Trieste Lecco, Lodi, Prato, Biella, Fermo, Gorizia Brindisi, Lecce,Barletta-
Andria-Trani, ViboValentia,
very low
Medio Campidano
Pordenone, Vicenza, Rimini, Pescara, Teramo, Ascoli Piceno, Isernia, Carbonia-Iglesias, Crotone, Trapani,
Bolzano/Bozen, Milano, Varese Ancona, Pesaro e Urbino, Valle Rovigo, Massa-Carrara, Caltanissetta, Matera,
d'Aosta/Vallée d'Aoste, Sondrio, Como, Vercelli, Benevento, Taranto, Enna, Ragusa, Siracusa,
low Livorno, Mantova, Treviso, Ravenna, La Bari, Asti, Latina, Olbia- Oristano, Agrigento, Napoli
Spezia, Chieti, Belluno, Udine, Venezia, Tempio, Ogliastra,
Cremona, Verbano-Cusio-Ossola, Campobasso
Macerata, Novara
Trento, Pisa, Padova, Modena Forlì-Cesena, Bergamo, L'Aquila, Pavia, Rieti, Frosinone, Cagliari, Catania, Palermo,
Pistoia, Verona, Savona, Ferrara, Sassari, Viterbo, Avellino, Catanzaro, Messina, Foggia,
medium
Genova, Lucca, Reggio nell'Emilia, Imperia, Nuoro Caserta
Alessandria, Piacenza, Terni
high Parma, Bologna, Firenze, Siena Brescia, Torino, Arezzo, Grosseto Reggio di Calabria
very high Roma Cuneo, Perugia Salerno, Potenza Cosenza
Panel B
21Figure A2 - Number of intermediaries by exposure in risky and very risky areas
Table A1 – Overlap between NPACC and ISPRA classifications - overall
Panel A – Landslide risk
Note: The table shows the NPACC categories on the rows, the ISPRA landslide risk categories on the column. The values
represent, for each row, the portion of the territory classified in each ISPRA hazard group. H4 represents the highest
hazard, H1 the lowest hazard.
Panel B – Flood risk
Note: The table shows the NPACC categories on the rows, the ISPRA flood risk categories on the column. The values
represent, for each row, the portion of the territory classified in each ISPRA hazard group. In flood risk panel, areas with
highest return period (P1) include areas with lowest return period (P3).
22Table A2 – Overlap between NPACC and ISPRA classifications – by province
Panel A – Landslide risk
Panel B – Flood risk
Note: The table shows on the rows the provinces classified as high/very high risk by NPACC. On the columns are reported,
for each province, the portion of the territory classified in each ISPRA hazard group and the portion of loans associated.
In flood risk panel, areas with highest return period (P1) include areas with lowest return period (P3).
23References
Abdullahi Hassan A., Bonaccorsi di Patti E., Faiella I. and F. Rinaldi, ‘L’esposizione del credito ai
rischi climatici in Italia. Una valutazione del rischio fisico’, Banca d’Italia, mimeo, 2020.
ESRB ‘Climate-related risk and financial stability’, 2021.
IPCC ‘Climate Change 2014: Impacts, Adaptation, and Vulnerability. Part A: Global and Sectoral
Aspects’, 2014
Mysiak J, Torresan S, Bosello F, Mistry M, Amadio M, Marzi S, Furlan and A. Sperotto, ‘Climate
risk index for Italy’, Philosophical Transactions of the Royal Society A 376: 20170305, 2018
Thomson, A.M. et al., ‘RCP4.5: a pathway for stabilization of radiative forcing by 2100”, Climatic
Change, 109, 77, 2011
24You can also read