Measuring Open Access Uptake: Data Sources, Expectations, and Misconceptions - Scholarly Assessment ...
←
→
Page content transcription
If your browser does not render page correctly, please read the page content below
Robinson-Garcia, N., et al. (2020). Measuring Open Access Uptake: Data
                                                                        Sources, Expectations, and Misconceptions. Scholarly Assessment Reports,
                                                                        2(1): 15. DOI: https://doi.org/10.29024/sar.23

COMMISSIONED REPORT

Measuring Open Access Uptake: Data Sources,
Expectations, and Misconceptions
Nicolas Robinson-Garcia1, Thed N. van Leeuwen2 and Daniel Torres-Salinas3
1
    Delft Institute of Applied Mathematics (DIAM), TU Delft, Delft, NL
2
    Centre for Science and Technology Studies (CWTS), Leiden University, Leiden, NL
3
    Departamento de Información y Comunicación, Universidad de Granada, Granada, ES
Corresponding autor: Nicolas Robinson-Garcia (elrobinster@gmail.com)

In this paper we briefly introduce the concept of Open Access and review the many variants that have
been presented in the literature. We then critically examine how OA variants are presented by data source
and how they are operationalized in practice. The goal of the paper is to provide a set of guidelines on
how to effectively interpret OA information. To this end, we compare OA figures reported in different
data sources at the institutional and journal level and dig into the potential explanations behind the
differences observed on the figures each source provides.
Policy highlights
 • Open Access reporting in bibliometric reports is now possible due to the proliferation of data sources
    which provide information on the OA status of publications.
 • Unpaywall has become the main primary source of OA metadata on publications for the main bibliometric
    databases, however there are divergences as to how these databases use and present data from this
    source.
 • Understanding how OA variants are defined by each source and subsequently operationalized is key to
    correctly report and interpret Open Access uptake.

Keywords: open access; unpaywall; open science; research evaluation; scientometrics

Introduction
Open Access (OA) is now completely integrated into the research policies of funding agencies, governments, and
institutions. According to the Budapest Open Access Initiative (Chan et al., 2002), we understand OA as:

        “free availability on the public internet, permitting any users to read, download, copy, distribute, print, search, or
        link to the full texts of these articles, crawl them for indexing, pass them as data to software, or use them for any
        other lawful purpose, without financial, legal, or technical barriers other than those inseparable from gaining
        access to the internet itself.”

OA is a central player within the European Commission’s effort to make Open Science a reality. Still, the controversy
surrounding its implementation has never stopped. The constant presence of predatory journals which led many to
relate OA publishing with low research quality (Bohannon, 2013) is still there, and heated debates on how OA must be
implemented continue with Plan S1 still pending over our heads (Haug, 2019). But some things have changed. Publish-
ers are no longer fighting against its expansion but are pressing to be included in future OA publishing models. Also,
since a couple of years, we can now actually provide metrics on OA uptake. These two changes introduce more complex-
ity into OA discussions. They do so for two reasons. First, publishers are introducing different variants of OA which do
not strictly fit into the definition of OA as exposed in the Budapest Open Access Initiative (BOAI) (Chan et al., 2002).
Second, the fact that OA can now be quantified serves as evidence of its success or failure, including analyses of the dif-
ferent types of OA. But the way in which these metrics are computed also partially diverges from what it is theoretically
considered as OA.

    1
        Plan S is an initiative led by Science Europe (n.d.) with the goal of transitioning to a full OA science by requiring all funded research to be OA.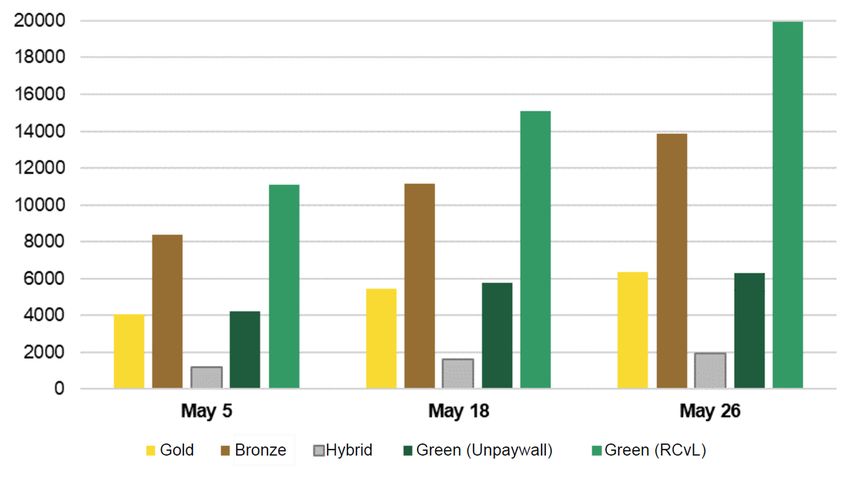
Art. 15, page 2 of 9                                                                 Robinson-Garcia et al: Measuring Open Access Uptake

   The purpose of this paper is to clarify and discuss these issues and show how information on OA data can be extracted
and critically examined so that we can provide a fair and accurate overview of OA uptake in our analyses. For this we will
discuss the following points. First, we will briefly review the different types of OA discussed in the literature, including
those more controversial variants which do not necessarily conform with the requirements presented in the BOAI to be
considered as OA.
   Second, we will discuss the various efforts made in the last years to quantify and identify the extent to which scientific
literature is available in OA, from the first studies which inferred the total number of OA scientific literature based on
various methods of data sampling to the latest ones which use large datasets of publications in an attempt to make
comprehensive estimates based on as much scientific literature as possible. Next, we will focus on Unpaywall (Piwowar
et al., 2018), the most widespread tool currently available for identifying OA literature. This tool is not only used by
many scholars, librarians and students as a means to access publicly available research papers, but it has been imple-
mented in the major multidisciplinary scientific literature databases (e.g., Web of Science, Scopus, Dimensions) as well
as in the Leiden Ranking (van Leeuwen et al., 2019). However, until recently, this tool provided only data on the location
of OA versions of documents but did not define the type of OA. Hence the ways in which these OA types have been
defined in these different sources (and even now by Unpaywall) differ slightly from one another. Furthermore, there are
some technicalities in the way Unpaywall operates which can lead to misconceptions in many cases.
   In the last section we will provide some examples using data from different sources on how OA indicators can be built
ad hoc and analysed at the institutional level. For this we will compare the results reported by different data sources
and discuss their differences.

Open Access: The canonical definition and its many variants
A scientific publication is considered as OA when it complies with the following requirements: 1) free availability;
2) allows users to read, download, copy, distribute, print, search or link to the full text; 3) allows crawling the full text
for indexing; and 4) imposes no legal, financial or technical barriers (Chan et al., 2002). To ensure that a scientific pub-
lication becomes OA two strategies were originally proposed: self-archiving in repositories or publishing in OA journals
(Harnad et al., 2008). These two strategies are known as green OA and gold OA and refer to the venue by which OA is
enabled. Over time many other variants have been defined, not only based on the venue but also on the level of open-
ness. For instance, (Suber, 2012) proposes distinguishing between gratis OA (access free of costs while retaining some
restrictions) and libre OA (access free of costs and restrictions)-always from a reader perspective.
   However, most of the discussions on OA variants are related with the business model that enables the access. Along
this line, hybrid OA refers to papers published as OA in subscription-based toll journals but for which the authors have
paid an extra fee to make their paper freely available. Diamond OA is proposed for non-profit OA journals which do
not follow an author pays model (Fuchs & Sandoval, 2013). Black OA refers to illegal services which offer free access to
scientific publications such as LibGen or Sci-Hub (Björk, 2017). But the complexity of the variants is even greater, with
some subsidized gold OA journals being partly diamond, as the publisher itself partly funds the APC costs.
   Laakso et al. (2011) propose alternative criteria to establish OA variants in which the business model and the time
of access are intertwined. In their approach all variants refer to OA publishing and do not include self-archiving. They
distinguish between direct OA, which refers to publishing in OA journals; delayed OA, which refers to journals liberating
their contents after an embargo period (Laakso & Björk, 2013); and, the aforementioned hybrid OA.
   An additional type is the so-called bronze OA. Unlike the other types, this variant does not respond to a theoretical
definition but is the result of empirically attempting to categorize OA publications by type. Bronze OA was first defined
by Piwowar et al. (2018) as “free to read on the publisher page, but without a clearly identifiable license” (p. 5). In their
paper, they offer a general overview of OA uptake. They distinguish between green, gold, hybrid, and bronze OA. The
bronze OA definition reflects the difficulty of empirically assigning OA types to papers when a very specific criterion
is followed, as is basically a basket concept in which OA papers are placed which do not fall under the other catego-
ries. Bronze OA could relate to delayed OA as defined before, but also to specific publications that journals decide to
make openly accessible for various reasons, such as a worldwide health urgency (e.g., the COVID-19 pandemic), for
promotional campaigns (e.g., Springer Nature makes a selection of articles published by Nobel Prize laureates freely
accessible2), or emerging from a sense of responsibility (e.g., PNAS and The New England Journal of Medicine make their
contents freely accessible after six months of publication).
   But this is not the only case where it is empirically difficult to assign OA types to papers. Another problematic OA
type to empirically assess is gold or APC OA. This refers to OA journals for which the author must pay a fee (generally
referred to as Author Processing Charges or APCs). The best data source from which to extract APC information on OA
journals is the Directory of Open Access Journals or DOAJ.3 This journal directory however, presents some shortcoming
discussed in the literature. First, it may not result in a complete picture of Gold OA publishing(Björk, 2019; Pölönen et
al., 2019). Second, the year a journal provided online Open Access content may differ from the real one(Bautista-Puig et
al., 2020). As we noted in a previous study:

  2
      https://group.springernature.com/fr/group/media/press-releases/springer-nature-celebrates-publications-by-2019-nobel-prize/17278028.
  3
      https://doaj.org/.
Robinson-Garcia et al: Measuring Open Access Uptake Art. 15, page 3 of 9
After some inspection, we found some inconsistencies in the way APC is defined according to DOAJ. That is, not
in all cases, APC refers to an author pays model, but in some cases, journals offer an optional subscription fee for
those interested on accessing to printed versions of the journal. This is the case for many journals stored in the
SciELO platform which are free of costs for both readers and authors, but which offer the option to pay a subscrip-
tion fee for printed versions of the journal. (Robinson-Garcia et al., 2020, p. 5)
Some attempts have been made to improve the coverage of OA journals (Rimmert et al., 2017). But the extent to which
it does so has not been explored. Additional examples can probably be found when attempting to empirically catego-
rize OA publications. For instance, the appearance of multiple versions of the same document can mislead readers who
may not be certain if they are reading the final version of the manuscript or previous versions (van Leeuwen et al., 2018).
These examples illustrate the difficulties one is confronted with when operationalizing some of the definitions of OA
and its variants.
How much scientific literature is openly accessible and how do we measure it?
A long-standing debate for many years relates to the amount of scientific literature which is available in OA. In a first
instance, studies estimating OA uptake sample a set of scientific papers and infer from it the share of papers OA for the
whole population (Archambault et al., 2014; Björk et al., 2010; Gargouri et al., 2012). As the methodology and the way
OA was operationalized varied, estimates also differ. OA literature in its broadest sense (that is, understood as free to
read access) was estimated to represent half of the scientific literature in 2013 (Kaiser, 2013; Van Noorden, 2013), while
more restricted estimates ranged between 20% and 25%. For a more thorough discussion on how methodological
decisions affect results we refer to the study by van Leeuwen et al. (2018).
A more comprehensive approach was made possible more recently when large-scale analyses became easier to con-
duct as computational advances on data retrieval and processing evolved. Two studies are worth mentioning. First, a
large-scale analysis in which publications indexed in Web of Science were matched against Google Scholar to identify
free to read versions of the documents (Martín-Martín et al., 2018). The authors used a similar approach to that adopted
by Archambault et al. (2014), in the sense that they did not restrict themselves to strictly identifying OA literature, but
rather free to read literature. They searched for evidence of free access in Google Scholar for papers published either
in 2009 or in 2014 (over 2.5 Million documents). Overall, they found that slightly more than half of the publications
were free to read, always considering that the embargo period for delayed OA had probably expired by the time of the
analysis. But the costs in terms of time and manpower needed to pursue this type of analysis have prevented it from
being updated or implemented as a viable methodology for identifying OA.
The second study presents a large-scale analysis of OA uptake at universities (Robinson-Garcia et al., 2020). Here, the
authors used the Unpaywall API and crossed it with Web of Science and the Leiden Ranking to obtain OA indicators for
963 universities worldwide during the time period 2014–2017. Over 4.5 million publications were analysed of which
40% were OA. In this case the share is lower than in the first large scale study mentioned above, probably due to a more
restricted definition of OA (as defined by Unpaywall). The results of this study were implemented in the 2019th and
2020th editions of the Leiden Ranking (Centre for Science and Technology Studies (CWTS), n.d.).
OA metadata from Unpaywall
The real game changer on the identification of OA literature was Unpaywall (Piwowar et al., 2018). A tool developed
by the non-profit Our Research,4 founded by Jason Priem and Heather Piwowar. Unpaywall can be queried through
different means:
1. An API, which can be queried by any user with some basic programming skills. In the Appendix we include a
how-to guide to query it, using the R programming language.
2. A personalized service for research purposes by which a user can introduce the DOIs of the set of papers she/he
is interested, and later receive from the tool an email with the results.
3. Using an add-on5 to the web browser in which the user can see in a side tab whenever they land on an article from
the publishers’s website whether or not the article is available in Open Access.
The key advantage of Unpaywall is twofold. First it is viable in terms of cost. Second, its capacity to accurately identify
OA has been unchallenged so far. Unpaywall relies heavily on DOI identifiers gathering its data on scientific literature
from CrossRef,6 the official Digital Object Identifier (DOI) Registration Agency of the International DOI Foundation. This
already imposes a major limitation on any OA analysis and may undermine OA presence in fields or for document types
where DOIs are not as frequently used, e.g., in humanities fields, and for monographs or reports.
Unpaywall has now been implemented in all the major bibliometric databases, including Scopus, Web of Science and
Dimensions. However, each data source defines OA variants differently. Table 1 shows the different OA types defined
4
http://ourresearch.org/.
5
http://unpaywall.org/welcome.
6
https://www.crossref.org/.Art. 15, page 4 of 9 Robinson-Garcia et al: Measuring Open Access Uptake
in each source including Unpaywall, reflecting a high degree of inconsistency between them. Furthermore, and prob-
ably more worrisome, they define OA types as exclusive categories. This affects especially green OA, as it is the only
category which is not journal-dependent and hence can be combined with any of the other types. In this sense, all data
sources label a publication as green OA only if none of the other types of OA applies to this publication. If another type
of OA does apply as well, it is labelled as that other type, not as green OA, thus undermining the uptake of green OA
Intentionally or not, this practice hides institutions’ and researchers’ efforts in actively ensuring OA through the devel-
opment and support of repositories and provides a biased view of OA to the reader of such figures, suggesting that this
type of OA is not as common when it is actually the most common OA type.
In Figure 1 we provide an example on differences of green OA depending on how categories are defined (as exclusive
or inclusive). The COVID-19 publications dataset compiled by Dimensions (Dimensions COVID-19 Publications, Datasets
and Clinical Trials, 2020) was downloaded at three different points in time during May 2020. Only journal articles and
Table 1: Types of Open Access provided by four different data sources.
OA type Unpaywall Web of Science Scopus* Dimensions
All OA X X X
Closed X
Open Access X
Other X
Bronze X X
Hybrid X
Gold X X
DOAJ Gold X
Other Gold X
Green X
Green, Published X X
Green, Accepted & Submitted X
Green, Accepted X
* Crosses (X) indicates differences in the extent to which a particular OA type is covered.
Note: Scopus defines in its web interface Open Access as “Articles published in Gold OA, including full journals, Hybrid, Open Archive
and Promotional Access” and Other as “any other type of access including Subscription of Green OA (not yet supported in
Scopus)”.
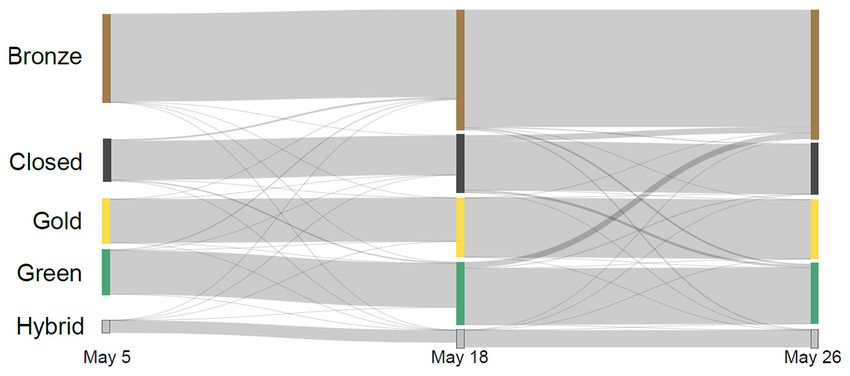
Figure 1: Differences on OA uptake for COVID-19 literature at three points in time. Data on COVID-19 publications
from Dimensions (Dimensions COVID-19 Publications, Datasets and Clinical Trials, 2020). Open Access data retrieved
from the Unpaywall API. Gold, Bronze, Hybrid and Green (Unpaywall) retrieved from the ‘status’ field from Unpaywall
API. Green (RCvL) OA computed as defined by (Robinson-Garcia et al., 2020).Robinson-Garcia et al: Measuring Open Access Uptake Art. 15, page 5 of 9 preprints were used in this example. After downloading them, the Unpaywall API was queried to establish the OA type of each of the documents downloaded. Four OA types are showcased: gold, bronze, hybrid, and green OA. In the case of the latter, this is shown twice, the first green OA bar indicates the number of documents which are green OA according to Unpaywall’s categorization and we refer to it as green (Unpaywall). The second one reports all instances of green OA, regardless of double assignments, we refer to it as green (RCvL). As observed, an analysis based on the Unpaywall cat- egories would suggest that most of the OA COVID-19 publications are made available through the publishers as bronze OA. However, the largest bunk of OA COVID-19 literature is available via green OA. The volatility problem We must note the volatility of these data sources and the limitations of being overly accurate on OA numbers. Again, using the COVID-19 publications data, we looked at changes of OA status and growth at the three points in time in which the data was extracted. Of course, the case of COVID-19 literature is a special case study, where there has been an overwhelming increase of publications in a very short time (Brainard, 2020; Torres-Salinas, 2020). Still, we believe it reflects very well issues of stability with OA data. Figure 2 shows fluctuations of papers present as well as the addi- tion of new publications at the three points in time. In principle, except for bronze OA, OA status should not change over time. A paper published in a gold OA journal should remain as gold OA. The same goes for hybrid OA. In the case of green OA, and when using an exclusive criterion, it can only shift to other OA types or remain as green. However, we observe that this is not the case, and papers reported at one point as OA, are reported as “closed” in later stages. Although the number of papers which change their status are marginal (below 50), still these inconsistencies illustrate the volatile nature of scientific literature and the magnitude of the task that Unpaywall fulfils. These limitations do not in any way discard Unpaywall as an OA discovery tool or as a tool to monitor OA uptake, but must be considered when reporting Unpaywall-based data. The cause for these changes remains to be explored. Using secondary sources to monitor OA uptake Multidisciplinary Citation Indexes still represent the easiest and most common way to report and monitor OA literature. Nevertheless, issues should be considered not only relating to the processing of OA metadata but also to the coverage of the data sources and other decisions that may affect the results. Figure 3 looks at the number of OA publications of three universities in the 2015–2018 period according to three data sources: Web of Science, Scopus, and the Leiden Ranking. While it was expected to see differences on raw numbers by source, the magnitude of such differences differs by source. While Web of Science covers the largest number of OA publications for all three institutions, the Leiden Rank- ing obtains the second position in the results for the two Dutch universities, but the third with respect to the University of Granada. Differences between the Leiden Ranking and Web of Science (which in principle depart from the same corpus of literature) relate to the document type (in the Leiden ranking only citable documents are included) as well as differences in the institution name disambiguation process. In the case of the University of Granada, the lower share of OA according to the Leiden Ranking may also originate from the fact that this source excludes the Arts & Humanities Citation Index and publications written in non-English languages which may affect this university stronger than the other two. These differences are key to the interpretation made in any analysis and illustrate the need to combine different sources to give an accurate picture of institutional uptake. In the case of the Leiden Ranking, the fact that the complete dataset is made freely available (Van Eck, 2020) makes the data processing and retrieval easier, and offers an interest- ing benchmark for comparison with other institutions. On the other hand, its use may lead to unexpected divergences, Figure 2: Changes of OA status for COVID-19 literature at three points in time. Data on COVID-19 publications from Dimensions (Dimensions COVID-19 Publications, Datasets and Clinical Trials, 2020). Open Access data retrieved from the Unpaywall API. OA types as defined by Unpaywall API. Curves indicate displacements of particular journals from one OA category to another.
Art. 15, page 6 of 9                                                        Robinson-Garcia et al: Measuring Open Access Uptake

as differences in publication counts among data sources are not merely due to OA capturing, but also due to source
journal coverage, document type selection and affiliation handling.
  In Table 2 we compare datasets which in principle should show similar figures. That is, we present a comparison of
publications and OA uptake for a list of journals in Scopus and Web of Science. In this case, we only include articles
and reviews. This already yields some problems, as there are several discrepancies between databases. As observed, Web
of Science always reports a higher share of OA publications with notable differences in the cases of JAMA, Annals of

                           Leiden University

                                    TU Delft

                       University of Granada

                                               0   2000   4000   6000   8000 10000 12000 14000 16000

                                          Leiden Ranking      Scopus     Web of Science

Figure 3: Number of OA publications for three universities in the 2015–2018 period according to data from
  the Leiden Ranking, Scopus and Web of Science. Institutions were searched using the organization-enhanced
  option both in Scopus and Web of Science. No filters by document type were applied.

Table 2: Number and percentage of OA publications for 20 medical journals in Scopus and Web of Science.
  Only articles and reviews are included. Time period 2015–2018.

                                                           Scopus   %          WoS           %      Type of Open Access
                                                            PUBS Total OA      PUBS       Total OA Green Gold Bronze
                                                                                                    OA      OA      OA
   BMJ OPEN                                                 8543         98%    8493        100%    98%     100%        0%
   JOURNAL OF CLINICAL AND DIAGNOSTIC RESEARCH              6578         99%    6292        100%    73%     100%        0%
   NEW ENGLAND JOURNAL OF MEDICINE                          2324         31%    1318         66%    52%       0%       47%
   LANCET                                                   1352         19%    1212         43%    41%      15%        4%
   JAMA JOURNAL AMERICAN MEDICAL ASSOCIATION                1269         47%     830         86%    60%       0%       68%
   EBIOMEDICINE                                              1129       100%    1133        100%   100%     100%        0%
   ANNALS OF INTERNAL MEDICINE                              1026          0%     567         33%    33%       0%        0%
   BMC MEDICINE                                               816       100%      817       100%   100%     100%        0%
   PLOS MEDICINE                                             800        100%     672        100%   100%     100%        0%
   INTERNAL MEDICINE JOURNAL                                 790          9%      761        12%      4%      1%        8%
   FRONTIERS IN MEDICINE                                     663         94%      716       100%    99%     100%        0%
   ARCHIVES OF MEDICAL SCIENCE                               649         96%     652        100%    96%     100%        0%
   SWISS MEDICAL WEEKLY                                      609         92%     488        100%    43%     100%        0%
   MAYO CLINIC PROCEEDINGS                                   575         44%     575         61%    28%       6%       37%
   EUROPEAN JOURNAL OF CLINICAL INVESTIGATION                498         22%     493         28%    13%       6%       16%
   ANNALS OF MEDICINE                                        299          7%     296         17%    15%       3%        3%
   OXFORD MEDICAL CASE REPORTS                               261         99%     343        100%    99%     100%        0%
   YALE JOURNAL OF BIOLOGY AND MEDICINE                      200          0%     102          0%      0%      0%        0%
   EUROPEAN JOURNAL OF GENERAL MEDICINE                      177         51%      171        73%      0%     73%        0%
   EUROPEAN JOURNAL OF GENERAL PRACTICE                       151        83%     152         88%    62%      68%       12%
Robinson-Garcia et al: Measuring Open Access Uptake Art. 15, page 7 of 9
Internal Medicine and New England Journal of Medicine. In these three cases, Web of Science reports an increase of
39%, 33% and 35% of OA publications respectively. This is due to the inclusion of Unpaywall in which a broader array
of OA types is included, especially Green OA, which is not included in Scopus. When comparing only gold OA (which
includes hybrid periodicals), journals report similar figures regardless of the database.
Concluding remarks
In this paper we briefly introduce the concept of OA and confront theoretical definitions and conceptions with its opera-
tionalization to provide the reader with a critical mindset when analysing and interpreting figures reporting OA uptake.
Furthermore, we inform on how to retrieve and use OA metadata for any given set of publications either through the
Unpaywall API or via other available data sources. We refer specifically to Web of Science, Scopus, Dimensions, and the
Leiden Ranking. We compare them and critically comment on the information each source reports and on potential
reasons for disparities. The analyses shown are illustrative and not in-depth analyses, and should be interpreted as such.
OA is currently a heated and debated topic, both in the field of scientometrics and in university management. The dif-
ferent stakeholders involved feel passionately about it, claiming in favour or against the many initiatives that are taking
place. The launch of Unpaywall has provided for the first-time numbers which go beyond rough estimates. But still the
way in which they are calculated and interpreted can greatly mislead decisions and opinions. With this paper we hope
to bring some insight which can nurture informed and reasoned discussions on the future direction of OA. While we do
not respond to all questions related to the operationalization of OA and its interpretation, we hope we provide a brief
introduction so that more insightful analyses can take place in the future.
Issues such as licensing of OA publications and their adherence to national or supranational policies, or the inclu-
sion of additional publication types such as monographs or grey literature are not discussed in this paper but still pose
important challenges in terms of effectively measuring OA uptake and reporting compliance with policies. The reliance
of document identifiers (e.g., DOI, HANDLE) for any OA tracking tool, including Unpaywall will impose an important
barrier when trying to go beyond the domain of journal articles.
Appendix: How to extract and process OA metadata from Unpaywall API
Here we provide a brief guide on how to retrieve OA metadata for any given set of publications by querying the
Unpaywall API.
The Unpaywall API allows us to retrieve metadata, not only on the OA status and OA type of publications, but also
a thorough description of OA evidence. This includes among others the URL location of the OA version of the docu-
ment, the type of license of the document, and whether an OA version has been identified in a repository or not. It also
includes some bibliographic information such as journal, document type, publisher, authors, or date of publication.
The richness of the data provides a wide array of opportunities for analysis, some of them explored in the study by
Robinson-Garcia et al. (2020), such as alternative definitions of OA variants, identification of green OA by repository
(this can be explored within allocations), licensing of OA publications, etc.
For the extraction of data we will use the roadoi package (Jahn, 2020). This package queries the Unpaywall API by
providing DOIs of the publications for which we want to know their OA status. While it includes a function by which
DOIs can be queried one at a time, it does allow querying up to 100,000 publications at a time. For this, we suggest
computing the function showcased in Figure S1.
unpaywallArt. 15, page 8 of 9 Robinson-Garcia et al: Measuring Open Access Uptake
Next, we will retrieve our list of DOIs and copy paste them into a list using the following command:
list_of_doisRobinson-Garcia et al: Measuring Open Access Uptake Art. 15, page 9 of 9
Laakso, M., Welling, P., Bukvova, H., Nyman, L., Björk, B.-C., & Hedlund, T. (2011). The Development of Open
Access Journal Publishing from 1993 to 2009. PLOS ONE, 6(6), e20961. DOI: https://doi.org/10.1371/journal.
pone.0020961
Martín-Martín, A., Costas, R., van Leeuwen, T., & Delgado López-Cózar, E. (2018). Evidence of open access of
scientific publications in Google Scholar: A large-scale analysis. Journal of Informetrics, 12(3), 819–841. DOI: https://
doi.org/10.1016/j.joi.2018.06.012
Piwowar, H., Priem, J., Larivière, V., Alperin, J. P., Matthias, L., Norlander, B., Farley, A., West, J., & Haustein, S.
(2018). The state of OA: A large-scale analysis of the prevalence and impact of Open Access articles. PeerJ, 6, e4375.
DOI: https://doi.org/10.7717/peerj.4375
Pölönen, J., Guns, R., Kulczycki, E., Laakso, M., & Sivertsen, G. (2019). Open access challenge at national level:
Comprehensive analysis of publication channels used by Finnish researchers in 2016–2017. 17th International
Conference on Scientometrics and Informetrics, ISSI 2019-Proceedings Volume 2, 2019.
Rimmert, C., Bruns, A., Lenke, C., & Taubert, N. C. (2017). ISSN-Matching of Gold OA Journals (ISSN-GOLD-OA) 2.0.
https://pub.uni-bielefeld.de/record/2913654
Robinson-Garcia, N., Costas, R., & van Leeuwen, T. N. (2020). Open Access uptake by universities worldwide. PeerJ,
8, e9410. DOI: https://doi.org/10.7717/peerj.9410
Science Europe. (n.d.). ‘Plan S’ and ‘cOAlition S’ – Accelerating the transition to full and immediate Open Access to
scientific publications. Retrieved 11 September 2020, from https://www.coalition-s.org/
Suber, P. (2012). Open Access. MIT Press. https://openaccesseks.mitpress.mit.edu/pub/9i5oj5l9/release/2. DOI:
https://doi.org/10.7551/mitpress/9286.001.0001
Torres-Salinas, D. (2020). Ritmo de crecimiento diario de la producción científica sobre Covid-19. Análisis en bases de
datos y repositorios en acceso abierto. El profesional de la información (EPI), 29(2). https://doi.org/10/ggr57c. DOI:
https://doi.org/10.3145/epi.2020.mar.15
Van Eck, N. J. (2020). CWTS Leiden Ranking 2020 [Data set]. Zenodo. DOI: https://doi.org/10.5281/zenodo.3937397
Van Leeuwen, T. N., Costas, R., & Robinson-Garcia, N. (2019, May 15). Indicators of open access publishing in the
CWTS Leiden Ranking 2019. CWTS Blog. https://www.cwts.nl/blog?article=n-r2w2a4&title=indicators-of-open-
access-publishing-in-the-cwts-leiden-ranking-2019
Van Leeuwen, T. N., Tatum, C., & Wouters, P. F. (2018). Exploring possibilities to use bibliometric data to monitor gold
open access publishing at the national level. Journal of the Association for Information Science and Technology, 69(9),
1161–1173. DOI: https://doi.org/10.1002/asi.24029
Van Noorden, R. (2013). Half of 2011 papers now free to read. Nature News, 500(7463), 386. DOI: https://doi.
org/10.1038/500386a
How to cite this article: Robinson-Garcia, N., van Leeuwen, T. N., & Torres-Salinas, D. (2020). Measuring Open Access Uptake: Data
Sources, Expectations, and Misconceptions. Scholarly Assessment Reports, 2(1): 15. DOI: https://doi.org/10.29024/sar.23
Submitted: 22 July 2020 Accepted: 06 October 2020 Published: 10 November 2020
Copyright: © 2020 The Author(s). This is an open-access article distributed under the terms of the Creative Commons Attribution
4.0 International License (CC-BY 4.0), which permits unrestricted use, distribution, and reproduction in any medium, provided the
original author and source are credited. See http://creativecommons.org/licenses/by/4.0/.
Scholarly Assessment Reports is a peer-reviewed open access journal published by Levy Library Press. OPEN ACCESSYou can also read