Re-purposing Google Maps Visualisation for Teaching Logistics Systems
←
→
Page content transcription
If your browser does not render page correctly, please read the page content below
Journal of Information Technology Education:                                                  Volume 11, 2012
Innovations in Practice

      Re-purposing Google Maps Visualisation for
             Teaching Logistics Systems
      France Cheong, Christopher Cheong, and Ferry Jie
 School of Business IT and Logistics, RMIT University, Australia
     france.cheong@rmit.edu.au, christopher.cheong@rmit.edu.au,
                        ferry.jie@rmit.edu.au

                                                    Abstract
Routing is the process of selecting appropriate paths and ordering waypoints in a network. It
plays an important part in logistics and supply chain management as choosing the optimal route
can minimise distribution costs. Routing optimisation, however, is a difficult problem to solve
and computer software is often used to determine the best route. In an Australian postgraduate
course on logistics systems, Logware, a dated software packaged with a textbook was used for
teaching routing. A need was felt to replace the software with a more modern tool with an ad-
vanced graphical user interface and a high level of visualisation capabilities for a more engaging
student experience and better learning outcomes.
Our objective in this paper is to re-purpose Google Maps, a general mapping utility, and capital-
ise on its highly visual nature to create a specialised utility for understanding routing and other
GIS concepts such as geocoding and geolocation as used in logistics. The re-purposed utility tool
was embedded in a teaching method that focused on visualization as a cognitive strategy and took
advantage of the human cognitive architecture. Students were trained using a scaffolding ap-
proach in which the complexities of the tool developed were increasingly revealed to the students.
The teaching method was used and evaluated in a single 2-hour workshop using mixed-methods
research techniques, and positive student experience and learning outcomes resulted. Learning
outcomes were measured by assessing students’ workshop submission and all students received
marks in the 7-10 (out of 10) range. Positive student experience also resulted since 93% of stu-
dents rated the “usefulness” of the tool between 7-10 on a 10-point scale and 87% rated “use at
work” between 7-10 on a 10-point scale. Positive experience was further evidenced by the quali-
tative comments students made.
Although the study has demonstrated the usefulness of the tool for improving student experience
and learning outcomes, one limitation of the study is that the impact of the tools on students’ long
term retention of learned information was not evaluated. More work needs to be done to evaluate
the usefulness of the tool and teaching method over a longer period of time.
                                                                       Keywords: visualisation, cognitive
 Material published as part of this publication, either on-line or     learning strategies, Google Maps, logis-
 in print, is copyrighted by the Informing Science Institute.          tics
 Permission to make digital or paper copy of part or all of these
 works for personal or classroom use is granted without fee
 provided that the copies are not made or distributed for profit                 Introduction
 or commercial advantage AND that copies 1) bear this notice           A supply chain consists of activities re-
 in full and 2) give the full citation on the first page. It is per-
 missible to abstract these works so long as credit is given. To
                                                                       quired for transforming natural re-
 copy in all other cases or to republish or to post on a server or     sources, raw materials, and components
 to redistribute to lists requires specific permission and payment     into a finished product for delivery to a
 of a fee. Contact Publisher@InformingScience.org to request           customer. Managing a supply chain re-
 redistribution permission.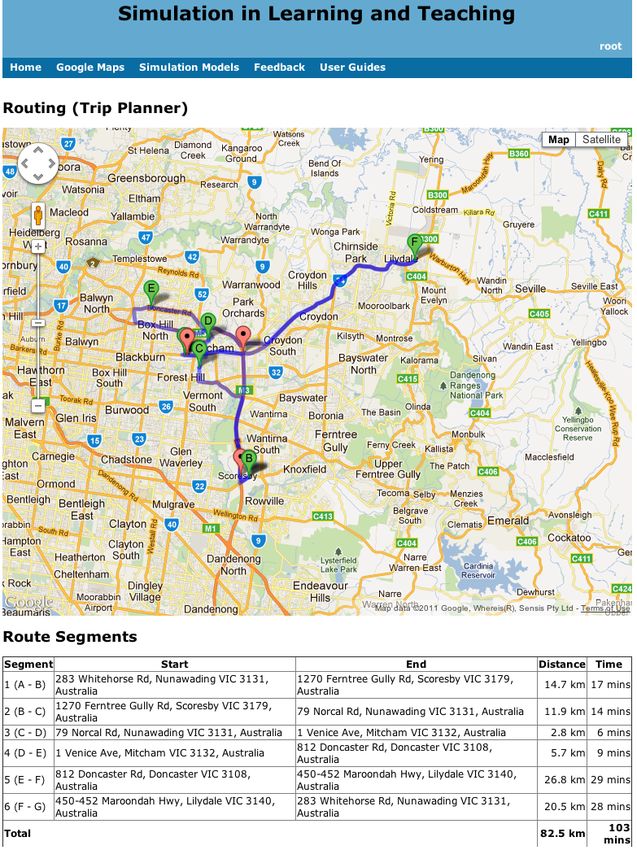
Re-purposing Google Maps Visualisation for Teaching Logistics Systems
quires managing the network of businesses involved in providing goods and services to customers
and encompasses the management of all movement and storage of raw materials, work-in-
progress inventory, and finished goods from the point of origin to the point of consumption
(Harland, 1996). On the other hand, logistics is the management of the flow of goods between the
point of origin and the point of destination. Logistics can be considered as a channel of the sup-
ply chain that adds time-value and place-utility. It consists of planning, implementing, and con-
trolling the effective level of flows and the storage of goods and services (Ballou, 2007; Bower-
sox, Closs, & Cooper, 2010; Coyle, Langley, Gibson, Novack, & Bardi, 2008; Mentzer, Flint, &
Hult, 2001). One important concept used in logistics and supply chain management is routing,
which is the process of selecting paths in a transportation network for distributing goods and ser-
vices. Routing has implications for the cost effectiveness and efficiency of distribution systems
since it is important to select the best route (in terms of distance travelled and/or time taken) in
order to minimise transportation costs and provide on-time deliveries.
Finding the best route, also known as the travelling salesman problem, is a complex problem to
solve since the number of potential solutions to investigate increases exponentially with the num-
ber of intermediate destinations (or waypoints). Since it is impractical or even infeasible to
manually determine the best route for many waypoints, a number of computer-based solutions
have been developed.
In a postgraduate course in Logistics System offered by an Australian university, with an intake
of 70 to 80 students per semester, students are taught routing concepts using Logware, a software
packaged with the textbook in use (Ballou, 2004). The latest version of the textbook is the 2004
edition while the software dates back to 1998. Logware is a collection of software programs use-
ful for analysing logistics and supply chain problems and case studies. Its ROUTE module is
used to determine the shortest path through a network of routes.
Perceived problems when using Logware in the course include:
Case studies and data provided with the software are from the United States and cannot
be customised to provide an Australian context as desired by students. Since some stu-
dents may not have a good grasp of US geography, particularly locations, distances, and
measurement units (miles vs. kms), an Australian context would provide familiarity and
reduce cognitive load.
Students find the steps to use the software to be quite complicated.
Level of visualisation is not as sophisticated compared to popular and freely-available
modern mapping software.
Logware operates in a stand-alone mode on a personal computer and is not available
online as are many contemporary tools.
Visualisation techniques are most frequently used in the presentation of information and, al-
though they are also powerful problem-solving tools, they are rarely promoted as such in learning
and instruction (Rieber, 1995). The emphasis of educational institutions has always been more on
verbal, abstract thinking rather than visual and concrete reasoning despite the fact that people
have the natural tendency to use visualisation as cognitive strategies. The dominant role of alpha-
numeric encoding skills in classrooms and textbooks and the subordinate role of visual-spatial
learning is a criticism of the current practice in education (Mathewson, 1999). Although a basic
goal of education is the successful integration of skills and attitudes into a cohesive mental
schema, the current educational system is criticised as this aspect may be absent. Furthermore,
with the increasing computational and graphical capabilities of computers (and the availability of
a wide range of multimedia software), which are well equipped to implement a range of visualisa-
tion strategies, more should be done to devise visual instructional techniques. Exposing students
160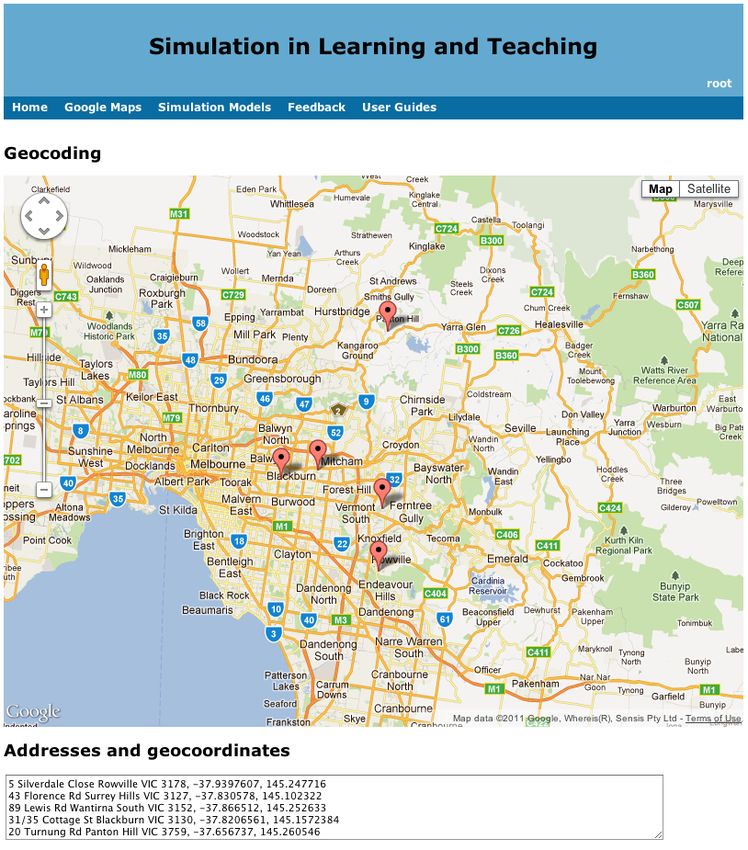
Cheong, Cheong, & Jie

to such techniques will inevitably enhance their learning as people are inherently good at inter-
preting visual patterns.
Google Maps (maps.google.com) is a modern, popular, and freely-available map-based online
service provided by Google. Services offered include street maps, which are highly visual dia-
grams, images of streets and landmarks, and route planning, which provides directions when trav-
elling to multiple destinations. Google also makes available a wide range of Javascript-based
application programming interfaces (APIs) (code.google.com/apis/maps) to allow embedding of
Google Maps in external websites and overlaying data on top of maps.
Google Maps is commonly used to display given addresses on a map and provide visual direc-
tions for travelling to one or more destination addresses. Given the inherent highly visual nature
of Google maps, our objective in this study is to re-purpose Google Maps from a general mapping
utility for looking up addresses and providing directions to a specialized utility for understanding
routing and other GIS concepts such as geocoding and geolocation as used in logistics. The re-
purposed utility tool was embedded in a teaching method that focused on visualization as a cogni-
tive strategy and took advantage of the human cognitive architecture.

                                  Literature Review
Visualisation can be broadly considered synonymous to imagery and can be defined as “represen-
tations of information consisting of spatial, non-arbitrary, and continuous characteristics” (Rie-
ber, 1995). The picture-like qualities of a visualisation are non-arbitrary because the visualisation
resembles the actual object or event, while the continuous characteristics allow the ability of ran-
domly scanning the visualisation in contrast to reading a sequential description of the object.
Visualisation is a cognitive strategy used by human beings for creativity, discovery and problem
solving. It has been used by famous people (e.g., Albert Einstein, August Kekulé) to solve com-
plex problems and make scientific discoveries in areas including physics and aviation, and it is
also used by ordinary people to solve everyday problems (Rieber, 1995). Cognitive strategies are
ways in which people manage their own learning, especially during the problem-solving phase
(Weinstein & Mayer, 1986), and people have a natural tendency to use visualisation as a cogni-
tive strategy. Given this natural tendency, educators are encouraged to consider innovative visu-
alisation strategies to nurture the creative problem-solving process (Rieber, 1995). Like any cog-
nitive process, visualisation is greatly influenced by prior knowledge held in the long-term mem-
ory of the individual.
When designing instruction, knowledge of the human cognitive architecture and the structure of
the information to be learned can provide useful insights for a successful design (Sweller, 2002).
Human cognitive architecture consists of a working memory of limited capacity and duration and
a long-term memory of infinite capacity. Working memory is believed to consist of multiple
channels or processors, and the visual and auditory channels of working memory are partially
separate. The partial separation of the visual and auditory channels can be exploited for learning
purposes to increase the capacity of working memory by presenting learning materials in both the
auditory and visual modes rather than in a single modality.
In order to learn new material, all the elements of the material must be placed in working mem-
ory. If the information structure consists of elements with little or no interactivity between them,
then each element can be loaded and learned serially in working memory. However, if element
interactivity is high, all the elements must be processed simultaneously in working memory, im-
posing a heavy cognitive workload. If the new material is sufficiently complex, it cannot be proc-
essed adequately in working memory and the learner might fail to understand such material.
Other cognitive structures and other learning mechanism are necessary, namely long-term mem-
ory and schemas.

                                                                                                 161
Re-purposing Google Maps Visualisation for Teaching Logistics Systems

Long-term memory holds well-learned material and is not just used to recognise or recall infor-
mation but rather as an integral component of all cognitive activities. It is of critical importance to
higher cognitive functioning such as problem solving and the problem solving skills depend on
the schemas held in long-term memory (De Groot, 1965).
Schemas are categorised information stored in long-term memory to facilitate the processing of
materials with high element interactivity in working memory. They allow working memory to
treat the many interacting elements as a single stream and without strain. Solving complex prob-
lems require the acquisition of thousands of domain-specific schemas (Chi, Glaser, & Rees,
1982).
Another aspect of the human cognitive architecture is the automation of schemas. After extensive
learning practice, well-learned, high element interactivity materials are incorporated into auto-
mated schema that can be used to process certain categories of information without much effort
on working memory (Kotovsky, Hayes, & Simon, 1985). As an alternative to practice, another
way to achieve automation of schemas is for the learner to mentally visualise the procedures in
working memory and, hence, reinforce them in long term memory (Cooper, Tindall-Ford, Chan-
dler, & Sweller, 2001).
Given the usefulness of visualisation as a cognitive strategy for problem-solving and learning, it
has been incorporated in the teaching of courses in various areas. Some examples include: formal
reasoning (Oliver & Aczel, 2002), theoretical computer science (Chudá, 2007), and earth science
(Harrower, MacEachren, & Griffin, 2000). However, regarding using Google Maps and its API as
a visualisation technique for enhancing learning, little is reported in the literature as far as we are
aware.

                                          Approach
Our approach for obtaining a more engaging experience and better learning outcomes for students
of the Logistics Systems course is by re-purposing Google Maps into a specialised mapping util-
ity (or tool) and embedding the tool in a teaching method with a focus on visualization as a cogni-
tive strategy and taking advantage of the human cognitive architecture. Thus, the mapping utility
and the teaching method were centered on three main theories from the relevant literature: visu-
alization, human cognitive architecture, and information structure. Given the visual nature of
maps and routing, visualisation was an obvious theory to use as a foundation in our work. Visu-
alisation is a cognitive strategy used for creativity, discovery, and problem solving. We also took
advantage of knowledge of the human cognitive architecture and the structure of the information
to be learned to guide the design of appropriate learning instructions.
The re-purposed mapping utility was implemented as a web-based software tool for the Logistics
Systems course. The tool was integrated with a larger project website named, “Simulation in
Learning and Teaching” (SiLT), for easy access. In addition to the software tool, the website also
contained general information about the research study and a feedback page. Students were
trained to use the site and software tool as part of an interactive 2-hour workshop in which they
were also required to carry out assessment tasks. Students’ assessment submissions and opinions
on the software tool were collected for analysis.
In the following sections, we discuss how we re-purposed Google Maps and how we embedded
the re-purposed utility tool in a teaching method. We also discuss how we collected data for
evaluating the usefulness of the tool and teaching method.

162
Cheong, Cheong, & Jie

Mapping Software Tool
As many of the students in the logistics systems course do not have high competency with IT, we
developed a web-based software tool, which was presented to students in three parts, with each
part increasing in functionality and complexity. We believed that this scaffolding and web-based
approach would accelerate learning by presenting students with new information that could easily
fit into their working memory. Additionally, the tool developed was a mapping tool based on
Google Maps, which we believed many students would have some familiarity with and would
further assist in accelerating learning as it provides a link to students’ long-term memory (for stu-
dents who have familiarity with Google Maps). Thus, the design of the tool takes into considera-
tion the human cognitive architecture.
A particular benefit inherited from Google Maps is that the tool naturally focuses on visualization
and is interactive, which increases user-friendliness and can aid comprehension, especially spatial
understanding.
The mapping software tool customised functionality from Google Maps for the purpose of the
logistics systems course. The tool is well integrated into the SiLT website and appears as a series
of interactive web pages. The tool contains three incrementally complex features: geocoding,
geolocation, and routing.
Geocoding is a functionality that translates a given address to a set of latitude and longitude coor-
dinates (a geocode). In our particular implementation, the user is able to enter a series of ad-
dresses (refer to Figure 1) and not only does the mapping tool display the geocodes, it also uses
Google Maps to convert the addresses to geocodes and displays them on an interactive map (refer
to Figure 2). The interactivity of the map is another feature inherited from Google Maps. It al-
lows users to zoom in and out of the map to view different levels of details, and to also navigate
to various places on the map, thus adding an element of exploration and discovery.

                                  Figure 1. Geocoding Input Page

                                                                                                 163
Re-purposing Google Maps Visualisation for Teaching Logistics Systems
Figure 2. Geocoding Output Page
As an added user-friendly feature, our implementation loads a number of default addresses, so the
first-time user does not need to enter any input and can simply press the “Display” button to see
the geocoding functionality in action. Thus, there is little commitment from the first-time user in
order to see the functionality of the system. The user focuses on the main functionality at hand
with little distractors. This reduces the cognitive load on the user’s working memory.
For more experienced users (who have understood the functionality of the system and have trans-
ferred it to their long-term memory), our implementation allows a text file of street addresses to
be loaded. This is a convenience feature that regular users may find useful.
To be precise, geocoding is only the translation of addresses to geocodes. The location of ad-
dresses on a map is actually called geolocation. Thus, the first feature of the tool begins with
geocoding and transitions users to geolocation seamlessly. Once students have committed the
understanding of geocoding to their long-term memory, this also provides a link from that to the
new information being held in their working memory, i.e., geolocation.
Geolocation is in fact the next feature of the tool and is slightly more complex. The input screen
requires users to enter two sets of addresses: one for all the stores of a company, the other for a
number of customer addresses (refer to Figure 3). As with the geocoding feature, default values
164Cheong, Cheong, & Jie
are loaded for the convenience of first-time users and there is also the option to load the addresses
from two files (one for store addresses, the other for customer addresses) for experienced users.
Once users submit both sets of addresses, the geolocation feature will display the addresses on a
Google Map (refer to Figure 4). Customer addresses are marked in green while store addresses
are marked in red. Similarly to the geocoding feature, the map contains interactive features from
Google Maps such as zoom in and out, and navigating to various places on the map. Addition-
ally, for convenience and added interactivity, our implementation provides users with the ability
to toggle (show/hide) the display of the customers and stores on the map.
Figure 3. Geolocation Input Page
165Re-purposing Google Maps Visualisation for Teaching Logistics Systems
Figure 4. Geolocation Output Page
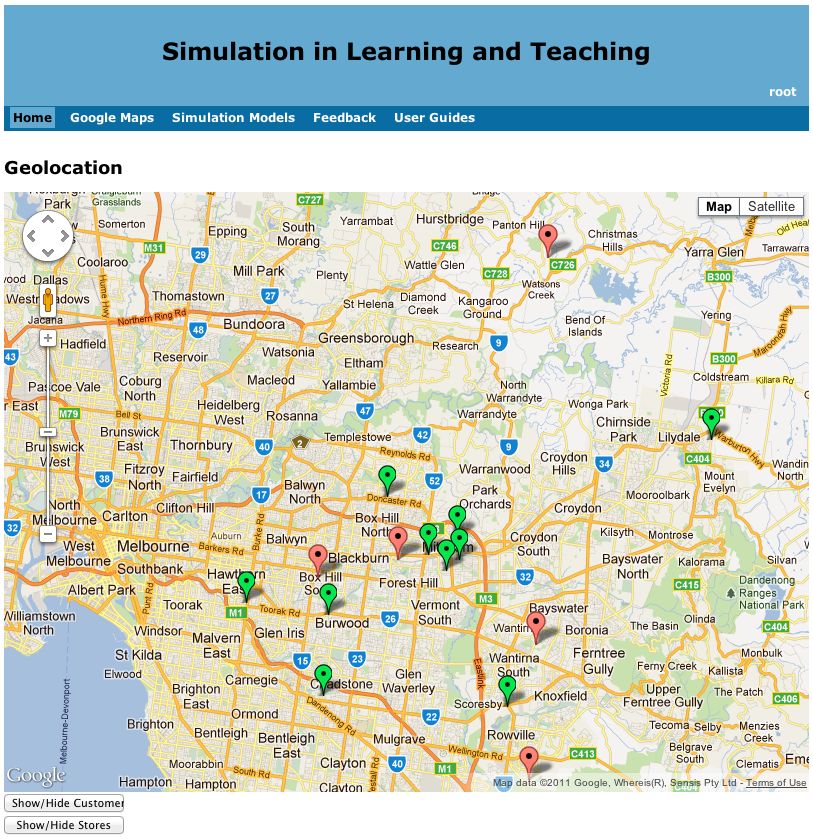
The last feature of the mapping tool is the most complex. It plans a route and requires the user to
enter three distinct sets of data: (1) a starting address, (2) a set of destination addresses to visit
(called “waypoints”), and (3) a final destination address (refer to Figure 5). As with the previous
two features of the mapping tool, default addresses are loaded, as a convenience for first-time
users. An additional input is for users to select is the “optimise waypoints” option. When se-
lected, the mapping tool will use Google Map’s routing optimisation feature to optimise the way-
points by both distance and time.
When users submit their inputs, the addresses are marked on a Google Map in visitation order
(optimised if the “optimise waypoints” option is selected or in order entered by user if not se-
lected) with the suggested routes between the addresses marked (refer to Figure 6). Our imple-
mentation also provides a table to display information such as distance and time travelled be-
tween each segment of the trip, and the overall distance and time travelled for the entire trip.
A natural response from first-time users is to try the routing feature without optimisation first and
then try it again with it (or vice versa) to see the difference. Of course, the default data loaded in
the system takes advantage of this natural curiosity to show a clear difference between optimised
and non-optimised routing.
166Cheong, Cheong, & Jie
Figure 5. Routing Input Page
167Re-purposing Google Maps Visualisation for Teaching Logistics Systems
Figure 6. Routing Output Page
Teaching Method
Students were trained to use all three of the mapping software tool features in a workshop. The
workshop was conducted in interactive mode by two of the researchers and scaffolding tech-
niques were used to help students successfully complete assigned tasks so that they can quickly
progress to the next ones. The workshop was carefully planned in advance, and it was divided
into a number of tasks with progressive levels of difficulty. For each task, tutors interacted with
students by means of demonstrations, questioning techniques, identifying hints, and cues, and
they circulated among students to question their approach to the task and provide students with
constructive feedback. As part of the workshop, the students were required to complete exercises,
which were collected, assessed (for academic purposes), and analysed (for research purposes).
The mapping software tool was designed to reveal features in increasing complexity, and thus, the
training workshop was also designed using this scaffolding approach. The aim of the workshop is
168Cheong, Cheong, & Jie
for students to gain an appreciation of the difficulty of manually determining the best route and to
also gain technical skills in using the mapping software tool developed to easily determine the
best route.
The workshop began by introducing the students to a definition of routing and its application and
usefulness in logistics and supply chain management (minimising distance and time travelled, and
thus increasing cost effectiveness and efficiency of distribution systems). This also provided the
students a preview of what their ultimate task in the workshop would be and motivated their in-
terest.
The next part of the workshop briefly described the difficulties of routing (the number of poten-
tial solutions increases exponentially with each additional waypoint) and highlighted that it is im-
practical and, in some cases, infeasible to determine the best route manually.
Students were informed of the aim of the workshop and presented with their first task. To appre-
ciate the difficulty of determining the best route, the instructor demonstrated how to manually
map a given set of addresses using Google Maps (the publicly available version and not the map-
ping software tool developed) and how to change the sequences of the waypoints to alter distance
and time travelled.
Demonstration of the operation of the highly visual software and tasks to be performed using ver-
bal explanations and instructions is an important part of the process of using the learning tool as
this takes advantage of the fact that working memory has partially separate visual and auditory
processing capabilities. In effect, we are trying to increase the capacity of working memory and
hence speeding up the learning of complex concepts.
For their first task, students were challenged to find and record the best route they could find.
After 20 minutes, the instructor asked students to volunteer their answers until the best route
found in the class was determined.
For the assessment of this task, students were asked to individually answer the following ques-
tions:
1. What do you mean by best sequence (i.e., route)?
2. Are there any alternative best sequences? If so, what are they?
3. Can you think of another scenario where you would use the best route? Explain your
scenario and its usefulness.
Once students appreciated the difficulty of finding the best route using the basic functionalities of
Google Maps available to the general public, they were given their second task. The instructor
introduced the SiLT website and demonstrated the three features (geocoding, geolocation, and
routing) of the mapping software tool. In order to facilitate the tasks of students, the mapping
software tool automated a large part of the mapping tasks involved such that students could focus
on the task at hand rather than using trial-and-error techniques to arrive at a solution. Students
were then asked to determine the best route using the routing feature of the mapping software tool
and to answer the following questions as part of their assessment:
1. Briefly explain the results generated by the SiLT routing tool.
2. Evaluate the usefulness of the SiLT tool by comparing and contrasting the solution gen-
erated with your previous manual routing response using Google Maps. Hint: consider
the differences on the following dimensions, sequence of destinations, travelling distance,
travelling time, effort required to determine solution.
3. Do you find the [mapping] tool useful for facilitating your learning in this workshop?
(1= Not useful, 10 = Very useful). Justify your rating.
169Re-purposing Google Maps Visualisation for Teaching Logistics Systems
4. Would you use the tool at work? (1 = Unlikely, 10 = Very likely). Justify your rating.
The instructor concluded the workshop by discussing some of the issues that emerged from the
tasks and any further questions students may have had.
Data Collection
At the end of the workshop, workbooks were collected and marked for assessment purposes. To
ensure consistency, only one assessor marked all the submissions. Marks were allocated based on
the students’ understanding of the material. The maximum marks for the entire workshop was
10, and the workshop was worth 5% of the total marks for the entire course.
From the collected workbooks, we analysed the responses and the marks attained by the students.
In particular, we focused on responses to question 2 as an indicator of understanding the value of
the mapping software tool, and questions 3 and 4, as indicators for usefulness and uptake of the
mapping software tool, respectively. We also analysed the comments made by students in their
workbooks. Since only 22 students out of a cohort of 71 agreed to participate in the research, only
the comments made by these students will be discussed in the analysis section. Although the
sample size was small, it was fairly representative of the population in terms of gender, age group
and mode of study (refer to Table 1).
Table 1: Demographics of surveyed students
Characteristics Population Sample
Count % Count %
Gender
Male 36 50.7% 13 59.0%
Female 35 49.3% 9 41.0%
Age group
< 20 0 0
21 – 28 55 77.46% 18 81.82%
29 – 48 14 19.72% 4 18.18%
49 – 65 2 2.82% 0
> 65 0 0
Mode of study
Full time 62 87.3% 19 86.4%
Part time 9 12.7% 3 13.6%
Results and Discussion
From the data analysis, descriptive statistics about the three questions asked were calculated, as
presented in Table 2.
170Cheong, Cheong, & Jie
Table 2. Descriptive Statistics of Marks Attained, Usefulness, and Use at Work
Statistic Marks Usefulness Use at Work
Minimum 7.0 3.0 1.00
Average 8.393 8.257 8.214
Median 8.0 8.0 9.0
Mode 8.0 8.0 10.0
Max 10.0 10.0 10.0
Standard Deviation 0.737 1.612 2.180
The overall results were very positive. The statistics show that, in general, most students had a
good understanding of the material covered and use of the software mapping tools (marks ranged
from a minimum of 70% to 100%, with an average of 84%, and a low standard deviation of
0.737). The median and mode showed that most students attained a result of 80%.
Learning Outcomes
A histogram of the marks achieved by the students (refer to Figure 7), reveals that 55% percent of
students received 8/10, 24% received 9/10, and 17% received 10/10.
When comparing their manually generated results against the results generated by the mapping
software tool (question 2), many students stated that the use of the mapping software tools re-
sulted in a better route and was more effective and efficient. Comments such as, “Easier to get
solution, less effort, less time …”, “Easier to use, provided shortest and quicker route”, and
“Very useful, no trial and error” were common.
There was some confusion as to the accuracy of the address of locations. As part of its usual op-
eration, Google Maps will approximate the location of an address if it cannot determine it exactly.
In some cases, this approximation can be very far from the intended address, and there were some
such cases with addresses that students had to use. Some students claimed that the publicly avail-
able Google Maps was more accurate while others claimed the opposite; that the mapping soft-
ware tool was more accurate.
This was an unintended technicality that had both positive and negative aspects. Some students
identified it and realised that one should not blindly accept the results generated and that one
should double-check to ensure correctness. However, the inaccuracy made some students dis-
trustful of the technology, and they undervalued the usefulness of the tool and simply believed it
to be inaccurate as a whole.
Another aspect that reduced the usefulness of the tool for students was that it did not consider
“traffic condition, timing, weight of cargo, …”. Those students who made these comments real-
ised that not all factors were considered, but also failed to realise that the tool was a generic rout-
ing tool and not fully customized for logistics distributions and, thus, would not naturally con-
sider factors such as cargo weight. This is a common issue with students with low IT literacy;
they have high expectations of technology, which can be unrealistic (e.g., that a system will con-
sider each and every real-life factor involved).
171Re-purposing Google Maps Visualisation for Teaching Logistics Systems
Figure 7. Histogram of Marks Attained
As hinted upon in their results to question 3, most students found the mapping software tool to be
useful. This is supported by the descriptive statistics about their responses to question 3 (refer to
Table 2). In general, students found the tool to be useful as the ratings ranged from a minimum
of 3 to a maximum of 10, with a median and mode of 8. Compared to the marks attained, there is
more variability in the usefulness ratings with a standard deviation of 1.612.
Student Experience
Inspection of the histogram of usefulness ratings (refer to Figure 8) shows that although there is
more variability, the majority of ratings are toward the upper end (93% are in the 7-10 range) of
the usefulness scale.
Figure 8. Histogram of Usefulness of Mapping Software Tool
Analysis of the justification for the ratings reveal that the low ratings were attributed to either
misconception, “Same as Google Maps!”, or distrust of the tool due to lack of details, “Very
simple, don't know what’s going on behind interface”, and “Better to understand the
algo[rithm]!”.
Some of the justifications provided by students re-iterated the ease-of-use, effectiveness, and effi-
ciency of the tool, e.g., “Useful, automatic, saves time and little effort”, and “User friendly, fast,
practical”. There are also comments which hint at the visual nature of the tool, “Visual and easy
to justify decisions, simple UI”, and others that state the tool was easy to learn, “Easy to use, no
need for much learning to use tool”. Such characteristics of the tool were not always seen as
positive, as one student who provided a low rating stated, “Will make us become lazy!”
172Cheong, Cheong, & Jie
There were also re-iterations of the tool not being specific enough for logistics distribution, “Very
useful and convenient, but still not perfect”, and “Fast and efficient, but does not consider traffic,
road blocks, certain days”.
Some students found the technology and approach to be useful, “Yes, shows how theory can be
applied and very visual with maps”, “Shows how IT is essential instead of manual calculations
and errors”, and “New logistics technology for me”. Other students revealed they were made
more aware of issues related to routing and logistics, “Create awareness of choosing optimal
route”, and “Transportation costs are huge! Helps to understand importance of routing”.
Students also realised the links between theory, the workshop, and practice, “Reinforces what
[was] learned in [the] workshop”, and “Really useful to connect practice and knowledge learned
in textbook”.
As the course was at postgraduate level and many of the students work, question 4 enquired if
they would use such a tool at work as an indicator of future use (they would not use it again in the
course). The responses included students who did not work, “Unlikely to use, full time student”,
and others who would have no use for this type of tool in their positions (but still found it valu-
able), “Seldom use this kind of tool”, and “Not in current position, but can see benefits on deliv-
ery and business”.
As with the previous answers, there were accuracy concerns, “Saves time, no manual operation,
but accuracy is a bit of concern”, and concerns about a lack of realism, “Useful for learning, but
in real life more factors e.g. cost, traffic condition, etc. [need to be considered]”, “Useful but
need to consider other factors: toll, rush hour, etc.”, “Use approximations, not useful in prac-
tice”, and “Just a fixed calculation, not flexible enough”.
There were also other practical issues raised, such as a lack of deeper integration with other sys-
tems, “No ERP integration. No traffic condition! No on the fly adjustment in case of accident”,
and “Does not arrange transport but will use it and prefer more advanced program, e.g. timing,
traffic”.
Other justifications pointed out the ease of use, and usefulness of the tool, “Online system, does-
n't need setup”, “Definitely will, easy to use and does not require much knowledge”, and “Yes,
have many truckloads with multiple drops”. One student even stated that the tool was advanced,
“An advanced tool, many advantages when compared with others”.
Figure 9. Histogram of Use at Work
Although there was the most variability in this set of responses (a standard deviation of 2.180),
most of the responses were higher ratings (a median and mode of 9 and 10, respectively) com-
pared to the other questions. 87% of the answers were in the 7-10 range.
173Re-purposing Google Maps Visualisation for Teaching Logistics Systems The use of scaffolding in the delivery of the workshop and the design of the mapping software tool facilitated accelerated learning. Students were able quickly understand the theory involved and put to practice recently acquired skills in using the tool. Some students were able to attain a higher level of learning by abstracting concepts and applications of the tool while others focused on the limitations of the tool (did not consider all factors, lack of realism), and others had misgiv- ings about the tool due to a lack of details. On the whole, the results related to learning (as indicated by question 2) are very positive. All students achieved marks between 7-10, with the majority achieving 8/10. The comparison of the tool against the publicly available Google Maps is also positive as many of the students realised the advantages offered by the mapping software tool. Furthermore, many students stated that they would use the tool at work. A running issue throughout the three questions is the lack of realism or lack of consideration of other factors in the routing algorithm. This is a difficult issue to address as the lack of realism is actually useful in allowing the students to more easily and quickly understand the tool. Inclusion of all relevant factors would probably not have been conducive to the success of the delivery ap- proach as it would have added increased complexity in the students’ initial comprehension of the tool. Although it is possible to include more factors in the tools to simulate more realistic operat- ing conditions, this might not be a desirable feature especially in a tool for learning basic routing. Students may have difficulties comprehending the outcome of the complex interactions of a mul- titude of factors when making routing decisions. Relating Findings to Theories Relating our findings to the theories upon which our work is founded, we can make the following remarks. Students found the mapping tools developed to be easy to use. Even students from non- IT background were not stressed in learning to use the new technology-based tool and some even found it enjoyable. Although the “ease of use” can be largely attributed to the highly visual nature of Google Maps and the technological facilities offered by modern web browsers, the scaffolding techniques used also contributed to “ease of use” to ensure learning occurred. Such scaffolding techniques included tutor interactions with students by means of demonstrations, questioning techniques, circulating among students to question their approach to the task, and providing hints, cues, and constructive feedback. Students also found that the tools and the workshop made it easy to learn routing concepts. Stu- dents understood not only the complex concepts but also mentioned that using technology is a good way to connect theory and practice in this case. Although the “ease of use” aspect probably contributed to “ease of learning” to some extent, the major contributing factor is most likely to be the “specific” scaffolding techniques used in the study. These scaffolding techniques were based on knowledge of the human cognitive architecture and structure of the information to be learned in the workshop. In particular, we broke down the learning of complex routing concepts into re- lated bite-size chunks (such as geolocation, geocoding, manual trial-and-error solutions, and automated solutions) to ensure that new information presented to students fit into their working memory. Furthermore, the Google-Maps-based tools and the instruction methods used in the workshop helped create a learning environment that provided links to students’ long term mem- ory in order to facilitate the processing of information held in their working memory. The results of using an “easy to use” and “easy to learn” teaching tool in the classroom made it easier for students to learn and, hence, they became more open towards learning and they achieved high learning outcomes as found in the study. This is in line with the general belief that the easier we make learning for students, the more willing they will be to learn. Although the ul- timate goal of education should be retention of learned materials for future use, we did not test 174
Cheong, Cheong, & Jie

this aspect in our study since what was learned during the 2-hour workshop was tested in the
same workshop. In order for retention of learning to occur, the learned contents in working mem-
ory should be transferred to long-term memory. We have no evidence this was the case as we did
test what was learned at a later stage. This is a limitation of the study which will be addressed in
future work.
Another possible limitation of our work is that evaluation of learning outcomes was mainly by
assessing students’ work by one of the investigators involved in the research. Although this might
be considered as having introduced some element of bias in the findings of the study, it was en-
sured that this was done as objectively as possible by using a marking guide. Furthermore, the
consistency of the findings of the various elements of the study also support our argument that
using an “easy to use” and “easy to learn” tool was an effective way of teaching routing concepts
since high learning outcomes were achieved by students.

Implications for Pedagogy
Essentially, our contribution is the framework we used for successfully integrating technology
with instruction methods to teach complex concepts to students of especially non-IT background.
During the requirements gathering and analysis stage for building the tool, we considered the fact
that users (students as well as their instructor) have low IT background/competency. Since the
tool to be developed deals with complex concepts, it will by nature possess some inherent com-
plexities. When dealing with students of non-IT background, another important aspect to con-
sider is the method used to provide them with access to the software. Instead of getting them to
download, install, and configure the software, it is better to make the tool available online and for
them to log to the web site to gain access. During the design stage, apart from ensuring that the
characteristics of the tool to be built matched user requirements, we also designed a matching
underlying teaching approach, mainly related to “generic” scaffolding approaches as well as “spe-
cific” ones based on human cognitive architecture and information structure in order for bite-size
learning to occur. When implementing the tool, we re-purposed highly visual tools such as
Google Maps and used web-based technologies as they would provide an element of familiarity
even to students of non-IT background.

                                        Conclusion
Our objective in this paper was to re-purpose Google Maps from a general mapping utility to a
specialised mapping tool for teaching complex GIS concepts in a logistics systems course to en-
hance student experience and learning outcomes. The re-purposed utility tool was used in a 2-
hour workshop that focused on visualization as a cognitive strategy and took advantage of the
human cognitive architecture and information structure. Students were trained in the use of the
tools using “generic” scaffolding approaches (demonstrations, questioning techniques, providing
hints, cues, and feedback) and “specific” scaffolding approaches based on knowledge of the hu-
man cognitive architecture and structure of the information to be learned in the workshop. Spe-
cific scaffolding techniques involved breaking the task of learning complex routing concepts into
related bite-size tasks such that new information presented to students easily fits into working
memory and providing links to long term memory in order to facilitate the assimilation of new
information.
Based on usage in a single workshop, the teaching method was evaluated using mixed-methods
research techniques. Learning outcomes were measured by assessing students’ workshop submis-
sion and results showed positive learning outcomes. All students received marks in the 7-10 (out
of 10) range. Positive student experience also resulted since 93% of students rated the “useful-
ness” of the tool between 7-10 on a 10-point scale and 87% rated “use at work” between 7-10
(again on a 10-point scale).

                                                                                                 175
Re-purposing Google Maps Visualisation for Teaching Logistics Systems
Comments submitted by students were also largely positive. Overall, they found the tool to be
easy to use as it was easy to obtain a solution with little effort or time. They also believed the
tool to be useful to show how theory can be applied and raised awareness about choosing the op-
timal route in logistics and distribution/transportation networks.
The contribution of this study is the framework used for successfully integrating technology with
instruction methods to teach complex concepts to students, especially those of non-IT back-
ground.
Although the results were generally positive, the research was limited to being trialled and evalu-
ated in single workshop. Since there is no evidence that what was learned in the single workshop
was committed to long term memory for future use, more work needs to be done to evaluate the
usefulness of the tool and teaching method over a longer period of time.
Acknowledgements
We would like to acknowledge the contributions of Nicholas Potesta, who worked in the School
of Business IT and Logistics, RMIT University and assisted in the design and development of
SiLT website.
We gratefully acknowledge the funding provided by the Learning and Teaching Investment Fund
of RMIT University to execute this project.
The research was conducted with ethics approval from the RMIT Business College Human Ethics
Advisory Network under register number 1000121.
References
Ballou, R. H. (2004). Business logistics/supply chain management: Planning, organising, and controlling
the supply chain. Pearson/Prentice Hall.
Ballou, R. H. (2007). The evolution and future of logistic and supply chain management. European Busi-
ness Review, 19(4), 332-348.
Bowersox, D., Closs, D., & Cooper, B. (2010). Supply chain logistics management (3rd ed.). NY:
McGraw- Hill/ Irwin.
Chi, M., Glaser, R., & Rees, E. (1982). Expertise in problem solving. In R. Sternberg (Ed.), Advances in the
psychology of human intelligence (pp. 7-75). Hillsdale, NJ: Erlbaum.
Chudá, D. (2007). Visualization in education of theoretical computer science. Paper presented at the Inter-
national Conference on Computer Systems and Technologies - CompSysTech’07.
Cooper, G., Tindall-Ford, S., Chandler, P., & Sweller, J. (2001). Learning by imagining. Journal of Ex-
perimental Psychology: Applied, 7, 68-82.
Coyle, J. J., Langley, C. J., Gibson, B., Novack, R. A., & Bardi, E. J. (2008). Supply chain management: A
logistics perspective. Mason, USA: South-Western.
De Groot, A. (1965). Thought and choice in chess. The Hague, Netherlands: Mouton.
Harland, C. M. (1996). Supply chain management, purchasing and supply management, logistics, vertical
integration, materials management and supply chain dynamics. In N. Slack (Ed.), Blackwell Encyclo-
pedic dictionary of operations management. UK: Blackwell.
Harrower, M., MacEachren, A., & Griffin, A. L. (2000). Developing a geographic visualization tool to sup-
port earth science learning. Cartography and Geographic Information Science, 27(4), 279-293.
Kotovsky, K., Hayes, J. R., & Simon, H. A. (1985). Why are some problems hard? Evidence from Tower
of Hanoi. Cognitive Psychology, 17, 248 - 294.
176Cheong, Cheong, & Jie
Mathewson, J. H. (1999). Visual-spatial thinking: An aspect of science overlooked by educators. Science
Education, 83(1), 33-54.
Mentzer, J. T., Flint, D. J., & Hult, G. T. M. (2001). Logistics service quality as a segment-customized
process. The Journal of Marketing, 65, 82-104.
Oliver, M., & Aczel, J. C. (2002). Theoretical models of the role of visualisation in learning formal reason-
ing. Journal of Interactive Media in Education, 3.
Rieber, L. P. (1995). A historical review of visualization in human cognition. Educational Technology Re-
search and Development, 43(1), 45-56.
Sweller, J. (2002). Visualisation and instructional design. Paper presented at the International workshop on
dynamic visualizations and learning, Knowledge Media Research Center, Tubingen, Germany.
Weinstein, C. F., & Mayer, R. F. (1986). The teaching of learning strategies. In M. C. Wittrock (Ed.),
Handbook of research on teaching. New York: Macmillan.
Biographies
Dr France Cheong is a senior lecturer in the School of Business IT
and Logistics, RMIT University. He holds a Bachelor in Business
(Computing), a Master of Computer Science, a Master of Education,
and a Ph.D. (Computer Systems Engineering).
His research interests include the modelling and simulation of complex
systems using a wide range of techniques such as: fuzzy systems, evo-
lutionary computation, artificial immune systems, agent-based model-
ing and system dynamics. He has applied these techniques to engineer-
ing, business applications, and education.
Dr Christopher Cheong is a lecturer in the School of Business IT and
Logistics, RMIT University. He holds a Bachelor of Applied Science
(Computer Science)(Honours), a Graduate Certificate in Tertiary
Teaching and Learning, and a Ph.D. (Computer Science).
His general research interests lies in the areas of artificial intelligence,
intelligent agents, evolutionary computing, software engineering, and
modeling and simulation. He is interested in applying these to various
domains, including education.
Dr Ferry Jie is a lecturer at School of Business IT and Logistics,
RMIT University. He received his doctoral degree from the University
of Sydney.
His research interests are supply chain management, operations re-
search, total quality management, lean six sigma, production planning
and inventory control, logistics system (including reverse logistics) and
strategic management.
177You can also read