REAL Centre Health and social care funding to 2024/25 - September 2021
←
→
Page content transcription
If your browser does not render page correctly, please read the page content below
REAL Centre
Health and social care
funding to 2024/25
September 2021
Background – Health and social care funding to 2024/25
•   An upcoming report from the Health Foundation’s REAL Centre: Health and social care funding projections 2021 will set out long-
    term funding requirements for health and social care in England to 2030/31. The report is due for publication in September 2021
    and will be the first in a series.
•   The analysis seeks to answer the question of how much funding the health and social care system may need over different
    periods of time. This includes DHSC budgets, day-to-day NHS funding and the funding made available to local authorities for adult
    social care.
•   These slides provide a summary of key results, covering funding requirements to 2024/25.
•   The work builds on the approach set out in previous Health Foundation publications: Securing the Future (2018, work done jointly
    with the IFS) and Managing uncertainty (2020).
•   The REAL Centre’s first report The bigger picture (2020) provides important contextual information on trends in NHS funding and
    activity.
•   The report and these slides do not seek to recommend a course of action. Instead they set out the funding implications of choices
    about, for example, the speed of service recovery and pay. As such, scenarios and sensitivity analysis are presented to reflect
    uncertainty. This includes that in the external environment, particularly in relation to the path of COVID-19, and in trade-offs and
    decisions government will need to make in its level of ambition for recovery from the pandemic.

                                                                                                                                           2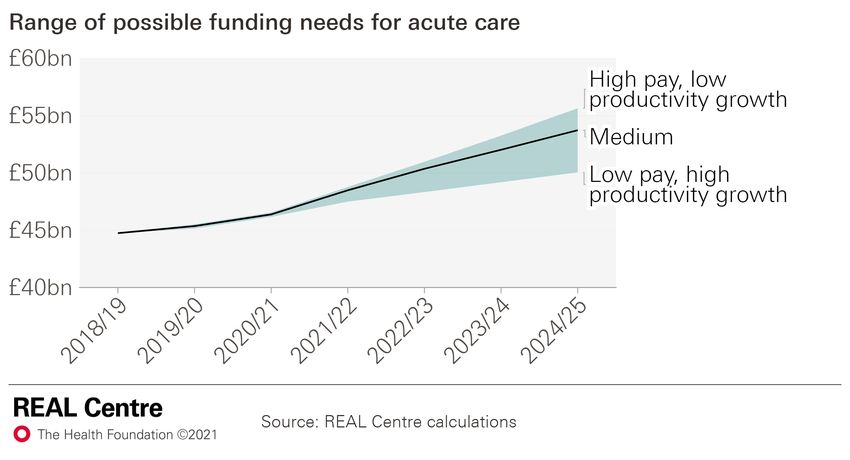
1. Our approach

           2) Underlying   3) Additional
 1) Our
              funding         funding      4) Results   5) Implications
approach
             pressures      pressures

                                                                      3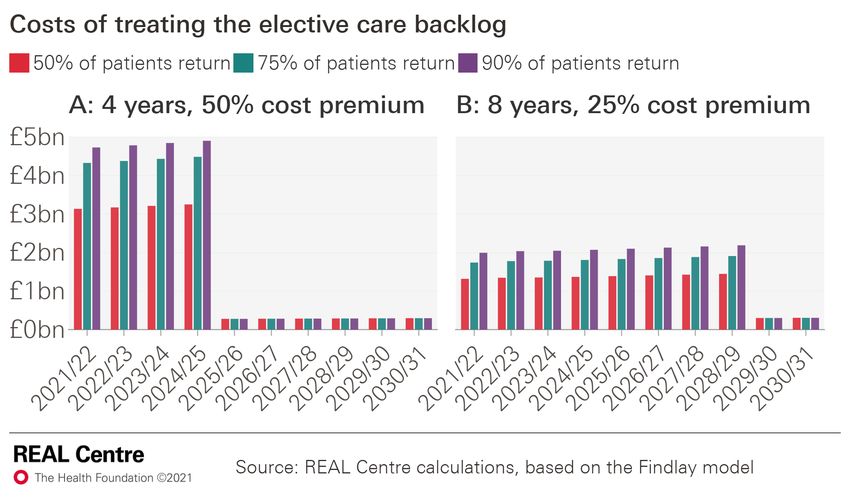
For our health care projections we combine ‘underlying funding pressures’
with ‘additional funding pressures’ to estimate total funding needs

•   We calculate ‘underlying funding          REAL Centre modelling approach
    pressures’ based on a set of
    assumptions about demand-side (eg
    population growth and ageing) and
    supply-side (eg pay) factors.
•   We then calculate ‘additional funding
    pressures’. These are issues that are
    largely within control of policymakers,
    such as performance against waiting
    times targets, but also covers the
    impact of COVID-19.
•   We combine the two in a set of
    scenarios in order to estimate total
    funding needs through to 2024/25.

                                                                               4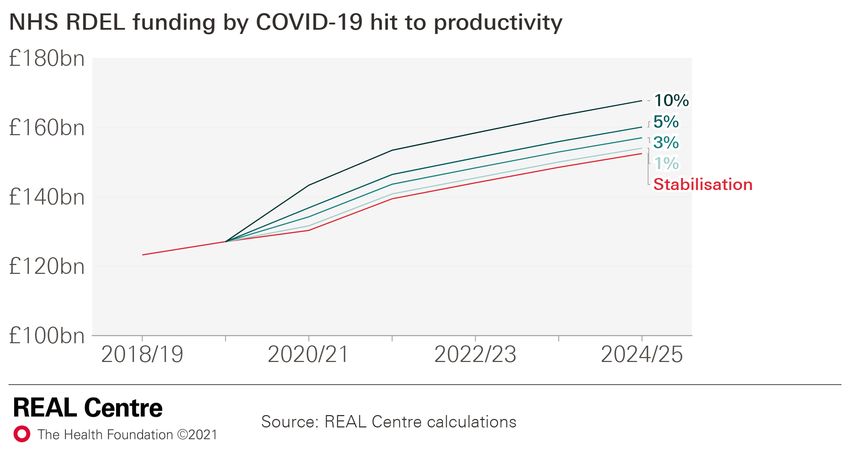
2. Underlying funding pressures

           2) Underlying   3) Additional
 1) Our
              funding         funding      4) Results   5) Implications
approach
             pressures      pressures

                                                                      5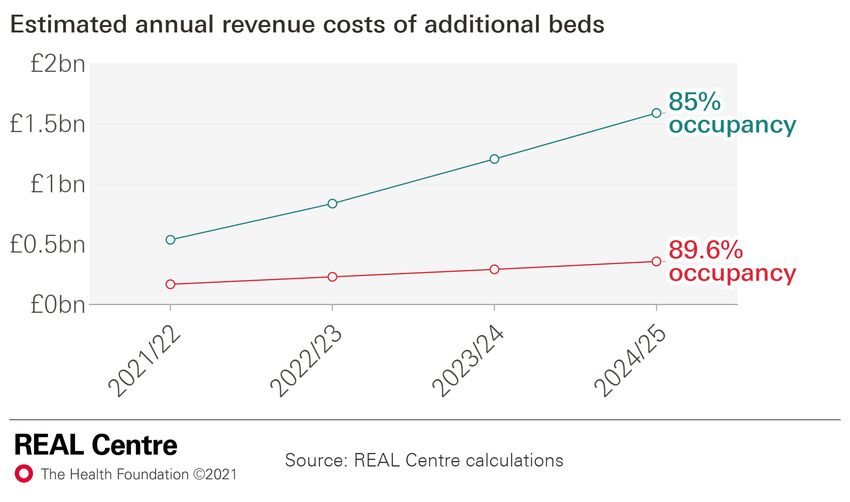
For our health care projections we use a component-based modelling
approach to project ‘underlying funding pressures’.

•   Based on a set of assumptions about demand-                 Our approach to underlying funding pressures
    side drivers (eg population and morbidity), we
    project how much activity is needed to deliver
    2018/19 levels of care (ie prior to the
    pandemic).
•   Then, based on a set of assumptions about
    supply-side drivers (eg pay and productivity)
    we project the cost of care over time.
•   We combine projections of activity and cost to
    estimate the funding required to meet
    ‘underlying funding pressures’, ie funding
    required if existing trends in key drivers
    continued.

                    Note: Our social care modelling approach is set out in detail in the Health Foundation’s REAL Centre publication “Social Care Funding gap”.
                    Estimates of social care demand are based on work by the Care Policy and Evaluation Centre (CPEC) at LSE. Demand projections cover publicly
                    funded social care for all adults, for both community-based and residential care.                                                           6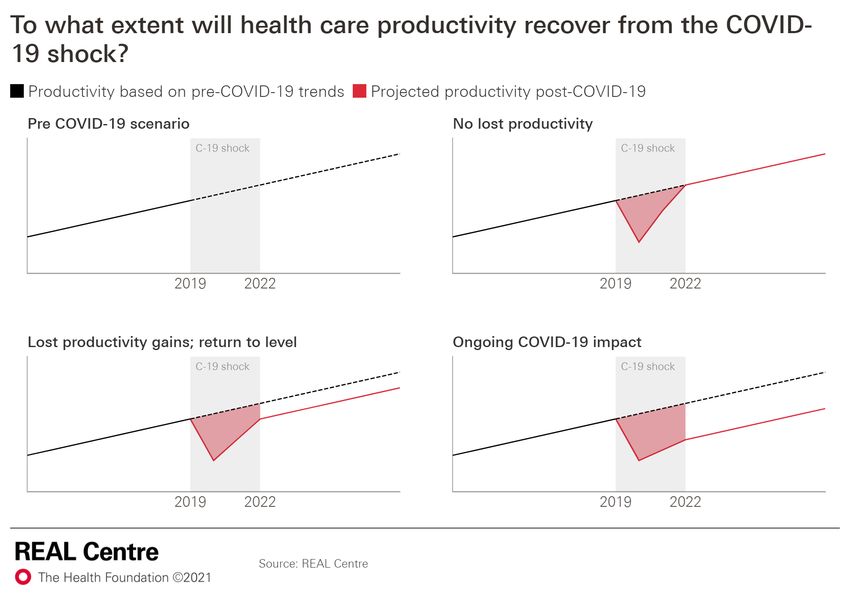
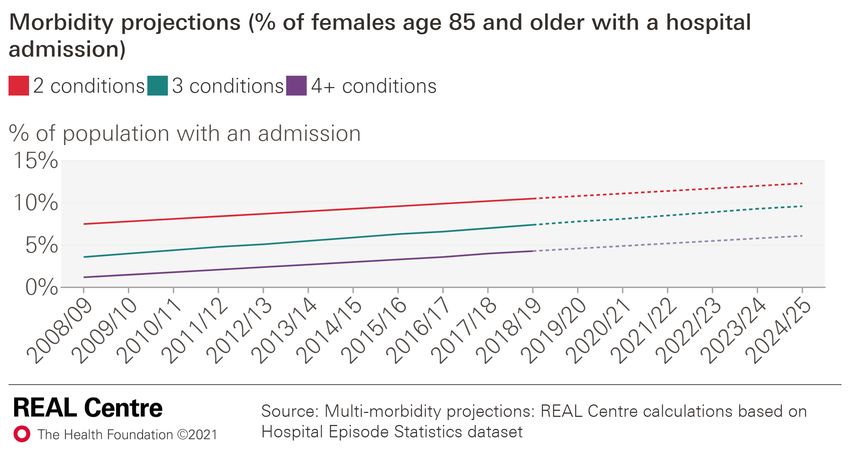
A growing and ageing population, with a higher prevalence of chronic conditions,
will drive increased demand for health and social care.

A growing and ageing population                            Rising morbidity
•   The population is growing (at 0.5% per year in the     •   The number of people living with long term conditions has been
    principal projection).                                     growing and is expected to grow further.
•   But it is also ageing: the proportion of people aged   •   The chart below shows the projected proportion of the female
    65+ will rise from 18.2% to 19.4% between 2018             population aged 85+ with a hospital admission by number of
    and 2024.                                                  multiple conditions.

                                                                                                                                7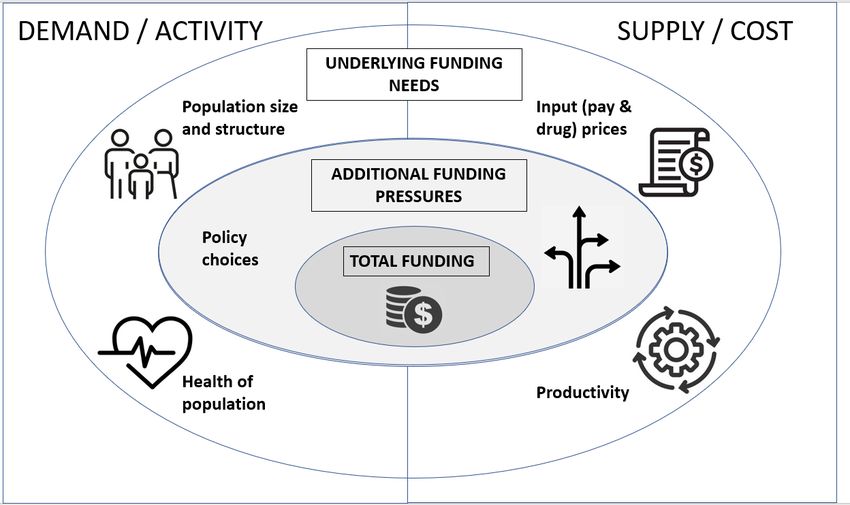
The projected growth in activity varies by service, with the highest growth for
hospital admissions.
•   Health and social care activity would need to increase to meet the      Activity projections by service area (annual growth, %)
    demand side pressures.
                                                                                                    Annual average growth rate            Difference
•   Projected activity growth varies between areas:                                                  Actual                              (percentage
    o Growth is highest for hospital care, particularly elective (2.5%)                             historic      Projected growth          points)
                                                                            Area               (2009/10–2018/19) (2018/19–2024/25)
      and non-elective (2.6%) care;
                                                                            Outpatient                4.1%               1.5%                -2.5
    o Growth is lowest for maternity care (-0.7%) (due to a fall in
      projected number of births) and services such as mental health        A&E                       1.6%               0.9%                -0.6
      that are less driven by ageing.                                       Non-elective              1.8%               2.6%                0.7
•   Our projections are broadly in line with trends over the last decade,   Elective                  2.4%               2.5%                0.0
    with some exceptions eg Improving Access to Psychological
                                                                            Maternity                -0.4%              -0.7%                -0.2
    Therapies (IAPT) and outpatient care are lower; community care is
    higher.                                                                 Community care           -0.9%               2.1%                3.0
•   It is important to note that these are projections are not a            Primary care              0.9%               1.4%                0.5
    statement of what should happen, either to improve patient care or      IAPT*                    16.6%               0.2%               -16.4
    make best use of resources. They are an estimate of what could          Secondary
    happen if current patterns of service use are combined with             Mental Health**           0.8%               0.8%                0.0
    projected changes of the drivers of service use (eg age and             Community
    morbidity).                                                             prescriptions             2.3%               1.4%                -0.9
                                                                            Social Care***           -0.6%               1.7%                2.2
                                                                            Note: Historic rates are *2012/13–2018/19; **2011/12–2018/19; ***2015/16–
                                                                            2018/19. The difference may not exactly match due to rounding of numbers.
                                                                            Source: REAL Centre calculations                                            8
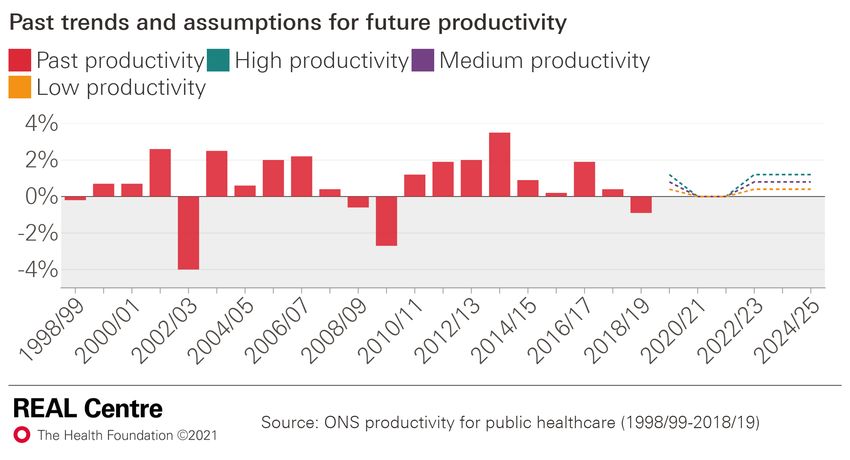
On the supply side, pay and productivity are two key drivers of spending growth,
and are areas where government has a degree of control.
Pay: trends and assumptions                                                     Productivity: trends and assumptions
•       We assume 1.3% real terms growth in pay (medium), 2.6%                  •   Productivity (non-quality adjusted) grew 0.8% a year in 1998/99-
        (high) and -0.4% (low) for 2021/22-2024/25                                  2018/19 (medium). The highest 10-year average growth was
                                                                                    1.2% (high); lowest was 0.4% (low).
    Historic real-terms growth in earnings, by staff group                      •   We assume no productivity growth in the pandemic.
                                2000–2010      2010–2020        2000–2020
ONS all employees                 1.2%           -0.1%            0.6%
ONS nurses                        2.6%           -0.3%            1.1%
NHS staff pay*                     n/a           -0.4%            -0.4%
    *Data start in 2011.

    Real-term pay growth assumptions
                      2018/19–2020/21            2021/22–2024/25
      Low pay                             NHS staff pay 2010–2020 (-0.4%)
                                           2021 OBR all-economy forecast
    Medium pay        Actual NHS staff               (1.3%)**
                        pay (-1.4%)
                                            Nurse pay growth 2000–2010
                                                       (2.6%)
      High pay
    **2018 OBR all-economy forecast for 2021/22 – 2030/31 was higher, at 1.8%
    on average in real terms.

                           Source, pay growth: ONS, OBR’s all-economy earning
                           forecasts and NHS digital

                                                                                                                                                       9
The combination of pay and productivity is crucial for determining how much
funding is needed to meet demand.
• Productivity growth reduces cost pressure by enabling
more output (eg admissions) to be delivered for the
same or less input (eg staff).
• Pay growth, on the other hand, increases cost
pressure. (Although, pay increases must be set against
the need to fill vacancies and the associated cost of
expensive bank/agency staff.)
• The chart illustrates the range of funding needs for
acute care under different combinations of pay and
productivity through to 2024/25.*
• As per the table, the range of potential funding growth
is broad, from 1.9% to 3.7%.
Annual growth in acute funding under different productivity
and pay assumptions
Annual growth
Possible assumptions 2018/19–2024/25 (%)
LOW (low pay / high productivity) 1.9%
MEDIUM (medium pay / medium productivity) 3.1%
*We use actual pay growth up to 2021/22; HIGH (high pay / low productivity) 3.7%
productivity growth is flat during the pandemic.
103. Additional funding pressures
2) Underlying 3) Additional
1) Our
funding funding 4) Results 5) Implications
approach
pressures pressures
11We then explore a number of ‘additional funding pressures’. These are policy
choices that may respond to public expectation, political commitments or the
impact of COVID-19.*
COVID-19 Costs of ongoing COVID-19
Vaccination programme
Additional mental health demand from the pandemic
Policy choices Pay policy
Long Term Plan funding commitments (primary, community and mental health care)
Elective care backlog and Constitutional standards
• Referral To Treatment (RTT) wait time target
• Bed occupancy and performance against A&E 4-hour wait target
Social care Improving pay and offering additional social care packages
*A selection of these additional funding pressures are presented in this slide pack with the full analysis to be included in our upcoming
report Health and Social Care Funding Projections 2021.
12We estimate the cost of treating the elective backlog based on a series of
assumptions about activity and costs.
• The health system was not meeting the 18-week referral to treatment target going into the pandemic.
• During the pandemic, referrals fell significantly. We estimate there were almost 8 million ‘missing patients’ between February
2020 and May 2021, some of whom will be referred later (returning patients).
• In June 2021, the waiting list was 5.5 million. But it is expected to grow further as referrals increase.
• We estimate the impact of different proportions of ‘missing patients’ returning (50%, 75% and 90%)
• Admitted patient care is more expensive than non-admitted: £2,332 vs. £716 in 2018/19 (2021/22 prices).
• Normally, patients on the waiting list longer than 18 weeks are more likely than usual to be admitted (39% admitted vs. overall
rate of 22%).
• The fall in care during the pandemic was more marked for admitted care, as such we assume that returning ‘missing patients’
are also more likely than usual to need admitted patient care (39% admitted).
• There is likely to be a premium to pay for additional activity – for instance, if care is delivered by the independent sector. This
premium is likely to be higher the quicker the backlog is cleared.
• Finally, government will have to decide what level of performance is desired. We estimate the cost to meet the 18-week RTT
and to return to 2018/19 levels of performance (87% within 18-weeks).
Source: REAL Centre calculations based on Consultant-led Referral to Treatment Waiting Times Data
13The cost of meeting the backlog varies considerably in our scenarios, both in absolute
terms and in profile over time.
Scenario A
• Average annual cost over 10 years ranges
from £2.1bn (90% return of missing
patients) to £1.5bn (50%).
• But this is not spread evenly: costs fall
almost entirely in the next 4 years (from
an average of £4.8bn to £3.2bn).
• There is some recurring cost each year to
meet the target (~£300m).
• The cumulative cost of clearing the
backlog (non-recurrent) would be £15.7bn
(75% of patient returning) and £16.8bn to
clear the backlog and return to 18 weeks
waiting time standard.
Scenario B
• The annual cost over 10 years is lower
(£1.7bn–£1.2bn) and is spread over a
longer time; the average cost over the
next 4 years would be £1.3bn–£2.0bn.
*Costs here are shown to 2030/31 as scenario B assumes the backlog would be
• The cumulative cost of clearing the
cleared over the next decade. Meeting the target in 2024/25 means bringing the
waiting list down to 3.8 million by March 2025. Alternatively, by our modelling, backlog (non-recurrent) would be £12.3bn
tackling the backlog by 2028/29 could mean running with a waiting list of 7– (75% of patient returning)
8.5million (50%–90% of patients returning) in March 2025. 14We estimate funding committed through the Long Term Plan (LTP) over the next
four years for community care, primary care and mental health.
• The Long Term Plan (LTP) committed an
additional £4.5bn in real terms for primary
and community care by 2023/24.
• We apportion this according to the
respective size of the budgets in 2018/19.
• The mental health implementation plan
committed £2.3bn in real terms by
2023/24.
• The figure shows the additional funding
represented by these commitments by
2023/24 (when they end).
• The majority of the funding is additional to
our underlying funding estimates.
15We estimate the cost of reducing the bed occupancy rate in order to increase
resilience and meet the A&E 4-hour wait standard
• Prior to COVID-19, bed occupancy rates had
increased, with an average occupancy in 2018/19 of
89.6%.
• Bed occupancy rates are a key determinant of
meeting the 4-hour A&E standard and of health care
system resilience more generally.
• We model the expected revenue cost associated
with increasing inpatient bed capacity to return to the
4-hour A&E waiting times target.
• The chart shows the annual costs of reducing bed
occupancy to:
• 85% by 2024/25 (NAO guidelines) –
representing almost £1.6bn in 2024/25
• 89.6% (2018/19 bed occupancy rate) – rising to
around £0.4bn in 2024/25
16We estimate the number of additional mental health referrals arising from
COVID-19 and the cost meeting this demand
Additional mental health referrals arising from COVID-19
Additional referrals 2020/21 2021/22 2022/23 2023/24 Annual average
Low 241,000 691,000 225,000 38,000 299,000
Point (central) 375,000 1,079,000 373,000 64,000 473,000
High 546,000 1,593,000 636,000 129,000 726,000
• We know the pandemic has had a significant impact on the mental health of the population. We model the impact of the pandemic
on certain risk groups in the population.
• We estimate there could be an additional 300,000-725,000 referrals for mental health services per year between 2020/21–
2023/24*.
• We estimate the total additional cost of the COVID-19 pandemic for mental health services could range from £1.6bn–£3.6bn, an
annual average of £410m–£900m.
• As most mental health referrals come through primary care, this implies a significant additional pressure on general practice.
Source: REAL Centre calculations based Strategy Unit analysis
*This time period reflects our estimate of when demand may come forward, i.e. there will be no new demand after 2023-24. For more,
see the SU model online. 17
https://www.strategyunitwm.nhs.uk/mental-health-surge-modelWe also consider the potential costs of ongoing COVID-19. These are
uncertain but crucial for determining funding needs.
• During the pandemic, infection prevention and control Illustration of potential impacts of COVID-19 on productivity
(IPC) measures, social distancing and higher-than-usual
staff absences impacted delivery in the NHS.
• This meant more inputs (eg beds and staff) were needed
to deliver less output (eg admissions). We consider this
a productivity shock.
• We estimate the associated costs are greater than the
direct costs of treating COVID-19 patients.
• In the diagram we illustrate different possible paths of
productivity. A crucial question is whether these costs
will continue (‘Ongoing COVID-19 impact’) or whether
productivity can return to its pre-pandemic level.
184. Results
2) Underlying 3) Additional
1) Our
funding funding 4) Results 5) Implications
approach
pressures pressures
19We model two scenarios – Stabilisation and Recovery – in order to bring this range
of analysis and assumptions into a coherent whole.
Recovery
Stabilisation
Lower pay growth though positive in real terms, and lower, A decade of high productivity and pay growth
but positive productivity growth
The elective backlog from COVID-19 met by end of 2028/29 The elective backlog from COVID-19 met by end of 2024/25
(double the time of recovery)
A&E and elective waiting times back to 2018/19 levels*, but NHS Constitution standards for A&E and elective waiting
still below NHS Constitution standards times being met again by 2024/25
Public health spending growing in line with NHS budget; Public health spending growing in line with NHS budget;
additional funding for social care packages, but not care increased access to social care packages and higher rates of
workers wages pay for care workers
• The scenarios set out two different levels of ambition for government and would lead to different experiences for staff and
patients and service users in health and social care.
• See Annex for a full list of assumptions.
See Annex C for detailed assumptions; * 87% within 18-weeks for RTT 20Our projections suggest NHS funding plans have been blown off course by the
pandemic.
• For NHS day-to-day spending (NHS RDEL) our
projections imply the following profile above the
Long-Term Plan (LTP) funding (which ends
2023/24)
o Stabilisation: an additional £4.7bn in
2021/22, £4.0bn in 2022/23 and £2.9bn in
2023/24.
o Recovery: an additional £7.7bn in
2021/22, £7.1bn in 2022/23 and £6.7bn in
2023/24.
o In 2024/25, NHS RDEL would need to be
£158bn in Recovery and £153bn in
Stabilisation (excluding pension costs*).
• The main reasons for higher costs in these early
years are the funding needs for meeting the Additional funding required (2021/22 prices)
elective backlog and increasing hospital capacity.
2021/22 2022/23 2023/24
Stabilisation £4.7bn £4.0bn £2.9bn
* Note, the absolute values exclude an Recovery £7.7bn £7.1bn £6.7bn
NHS pensions adjustment of £2.85bn in
nominal terms. 21These estimates don’t include the costs of COVID-19 and should be seen as a
minimum. We estimate every 1% hit to NHS productivity requires ~£1.5bn.
• These numbers exclude ongoing COVID-19 costs for
running the NHS.
• We estimate these costs separately, as this is so
uncertain and depends on the path of the pandemic and
the need to retain these measures.
• In our scenarios every 1% hit to productivity arising
from e.g. Infection Prevention Control (IPC) measures,
would require around £1.5bn per year in addition.
• A 10% hit would require £14-16bn per year over this
period.
Additional funding for COVID-19 hit to productivity:
Stabilisation scenario Recovery scenario
£bn, 21/22 prices 2021/22 2022/23 2023/24 2024/25 £bn, 21/22 prices 2021/22 2022/23 2023/24 2024/25
1% 1.4 1.4 1.5 1.5 1% 1.4 1.5 1.5 1.6
3% 4.2 4.3 4.5 4.6 3% 4.3 4.4 4.6 4.7
5% 7.0 7.2 7.4 7.6 5% 7.1 7.4 7.6 7.9
10% 14.0 14.4 14.9 15.3 10% 14.2 14.7 15.2 15.8Substantial increases in funding would be needed for Adult Social Care in order to
expand access and improve pay
Short-term funding requirements, social care
• In adult social care, funding is needed to expand £bn, 21/22 prices 2021/ 22 2022/23 2023/ 24 2024/25
access to care, pay more for care to sustain the Core spending
£bn 20.1 20.3 20.5 20.7
provider sector and pay higher wages. power
Real terms
• Funding would need to be £4.8bn to £9.3bn (excluding one-off 0.6% 0.9% 1.1% 1.0%
growth
higher than projected spending power by COVID-19 funding)
2024/25 in Stabilisation and Recovery, Stabilisation £bn 23.1 24.0 24.7 25.5
respectively. (Meeting future Additional
demand and funding (vs.
• These figures are for core spending on adult 3.0 3.7 4.2 4.8
improve access to core spending
social care under the existing means tested power)
care)
system. In addition, this analysis assumes no
Real terms
productivity improvements in the sector, nor any 8.6% 3.6% 3.2% 3.2%
growth
additional costs associated with COVID-19. Recovery
£bn 27.2 28.2 29.1 30.0
(Meet future
Additional
demand, improve funding (vs.
access to care and 7.1 7.9 8.6 9.3
core spending
Note, the level of funding needed is sensitive pay more for care) power)
to how quickly access can be expanded under
the Stabilisation and Recovery scenarios. The Real terms
17.4% 3.6% 3.2% 3.2%
analysis illustrates this happening in 2021/22, growth
but in practice achieving this objective would
likely be smoothed over a few years. Source: REAL Centre calculations
23Funding growth for both health and social care would need to be significantly higher
than in recent years to meet care needs.
Average annual increase in funding for health care
• Under our scenarios, healthcare funding (DHSC RDEL) Government Years Average annual
would require average real terms increases of 3.7% and increase for health care
4.3% for Stabilisation and Recovery, respectively. Whole period 1949/50 to 2019/20 3.7%
Coalition government 2009/10 to 2014/15 1.1%
Cameron and May Conservative
• These growth rates are at or higher than the average annual 2014/15 to 2018/19 1.5%
governments
increase since 1950. Johnson Conservative government
2018/19 to 2023/24 3.4%
(Long term plan)
• For social care, both the Stabilisation (5.5%) and Recovery Projected growth rates
(9.0%) scenarios imply much higher growth than in recent Scenarios 2018/19 to 2024/25
Stabilisation Recovery
years. 3.7% 4.3%
• Addressing the issue of catastrophic care costs through Average annual increase in funding for adult social care
introducing a cap of care costs as recommended in the Government Years Average annual increase for
social care
Dilnot review and enacted in the 2014 Care Act would add
Coalition government 2009/10 – 2014/15 -2.0%
to these costs.
Cameron and May 2014/15 – 2018/19 1.8%
governments
Johnson Conservative 2018/19 – 2020/21 1.7%
government
Scenarios 2019/20 – 2024/25 Projected growth rates
Stabilisation Recovery
5.5% 9.0%
Source: REAL Centre calculations
24Our projections imply an increase of more than 20% in the healthcare workforce and
a 28% increase in LA-funded adult social care jobs.
• Funding is a vital part of the solution but so Increase in the NHS and social care workforces
too is the workforce.
2018/19 2024/25 Extra FTE % change
• Even before the pandemic there were
Health care 1,218,000 1,482,200 264,200 22%
significant staff shortages. Pandemic-
related burn-out and sickness absence Of which:
have only added to the challenge. Stabilisation Doctors 146,200 179,200 33,000 23%
• Tackling the backlog and meeting demand Nurses 300,900 366,600 65,700 22%
imply the NHS workforce would need to
LA-funded social care 91,700 117,500 25,800 28%
grow by more than a fifth by 2024/25.
Healthcare 1,218,000 1,495,500 277,500 23%
• Improving social care may require the
workforce to increase by more than a Of which:
quarter. Recovery Doctors 146,200 180,400 34,200 23%
• Productivity gains may be labour saving but Nurses 300,900 370,500 69,600 23%
this sets out the scale of the challenge.
LA-funded social care 91,700 117,500 25,800 28%
Source: REAL Centre calculations
25Funding increases for the NHS would also need to be matched by funding for
the public health grant, Health Education England and DHSC capital to ensure
the system has the resources it needs.
Funding requirements, all budgets
• Staffing needs can't be fixed overnight but
£bn (2021/22 prices) 2018/19 2024/25
investment should start now. Stabilisation scenario
DHSC RDEL* 134.2 169.5
• This means further funding for Health
Of which:
Education England. NHS RDEL* 123.3 155.3
Public Health grant 3.5 4.3
• To keep up with growth in NHS funding and
Health Education England 4.4 5.5
improve prevention, the public health grant DHSC CDEL 6.4 10.2
would need to rise. DHSC TDEL 140.6 179.6
Social Care (2019/20 baseline) 19.5 25.5
• Finally, significant investment in capital is also Recovery scenario
needed, including for additional beds and DHSC RDEL* 134.2 175.0
diagnostic equipment. Of which:
NHS RDEL* 123.3 160.4
Public Health grant 3.5 4.4
Health Education England 4.4 5.7
DHSC CDEL 6.4 10.3
DHSC TDEL 140.6 185.3
Social Care (2019/20 baseline) 19.5 30.0
Source: REAL Centre calculations
*Absolute values for 2024/25 include NHS pensions adjustment of £2.85bn in nominal terms;
growth rates exclude the pensions adjustment since it is not present in the baseline.
265. Implications
2) Underlying 3) Additional
1) Our
funding funding 4) Results 5) Implications
approach
pressures pressures
27Key implications of our analysis
1. Rising numbers of older people, chronic conditions and deaths in the coming decade imply high underlying
pressures for care; the outlook for pay will be critical to the funding implications associated with those
pressures.
2. The ongoing impact of COVID-19, in particular the impact on service productivity, affect funding requirements
significantly.
3. There are key policy choices and funding requirements associated with the speed and ambition for clearing the
NHS elective backlog.
4. Similarly, the government has key policy choices for its level of ambition for adult social care and funding
requirements to improve the service are higher than the NHS.
5. Additional capacity is needed to return to NHS constitutional standards and clear the elective backlog.
6. The NHS and adult social care workforce will need to grow to meet these pressures and deliver policy.
* Absolute values include NHS pensions adjustment of £2.85bn in nominal terms; growth rates exclude pension adjustment
28Annex – scenario
assumptions
29A number of assumptions are held constant across both scenarios. These include those
relating to underlying pressures, and some relating to policy choices.
Stabilisation Recovery
Scenario summary The system is stabilised after the COVID-19 The ongoing effects of COVID-19 are limited
shock and more ambitious policy choices are made to
fund recovery.
Assumptions Demand factors Size and age structure of the population
held constant Mortality and birth rates
across all
scenarios Supply factors Hospital drug price growth (5.9% in real terms) and community drug price growth (flat in real
terms)
Actual NHS pay growth (2018/19 to 2020/21)
Flat productivity during COVID-19 pandemic (2020/21 to 2021/22)
Capital funding grows with plans and with NHS RDEL
Public Health grant and Health Education England funding grows in line with NHS RDEL
Specialised services grow in line with trend (4.6% in real terms)
Additional funding Long term plan commitments for primary care, community care and mental health
pressures and policy Ongoing vaccination programme linked to COVID-19
choices Addressing the additional COVID-19 related mental health demand.
30Other assumptions are varied between scenarios. Our results are sensitive to
assumptions about the ongoing impact of COVID-19 on productivity, how
ambitious the government is in policy aims and decisions about pay.
Stabilisation Recovery
Assumptions Supply Pay Medium: 1.3% real-term annual increase High: 2.6% real-term annual increase from
varied factors from 2021/22 2021/22
between
Additional Post COVID-19 Medium: 0.8% annual growth from High: 1.2% annual growth from 2021/22
scenarios
funding productivity 2021/22
pressures and Policy choices Increase in bed capacity to return to Increase in bed capacity to reach 85%
policy choices and 2018/19 occupancy rates (89.6%) from occupancy rate from 2024/25
constitutional 2021/22
standards RTT waiting time back to 2018/19 levels RTT waiting times back to 18-week target
(but not 18-week target) by 2028/29 by 2024/25
Public health grows in line with NHS Public health grows in line with higher rate
RDEL of NHS RDEL growth
Post LTP, mental health growing with Post LTP, mental health growing in line with
underlying funding pressures rest of the budget
Social care Additional care packages Additional care packages and higher staff
pay
31You can also read