Realistische Simulation spezifischer CT- Systeme in aRTist 2 Realistic Simulation of Specific CT-Systems in aRTist 2
←
→
Page content transcription
If your browser does not render page correctly, please read the page content below
DGZfP-Jahrestagung 2021

 Realistische Simulation spezifischer CT-
 Systeme in aRTist 2
 Realistic Simulation of Specific CT-Systems
 in aRTist 2
 Florian WOHLGEMUTH 1, Tino HAUSOTTE 1
 1
 Lehrstuhl für Fertigungsmesstechnik (FMT), Friedrich-Alexander-Universität Erlangen-
 Nürnberg (FAU), Erlangen
 Kontakt E-Mail: Florian.Wohlgemuth@fmt.fau.de

 Kurzfassung. Die Simulation röntgencomputertomografischer Messungen verspricht
 vielfältige Anwendungsmöglichkeiten wie die numerische Messunsicherheitsbestim-
 mung, simulative Aufnahmeplanung/-optimierung und die Vorhersage (sowie darauf
 basierende Korrektur) von systematischen Messabweichungen bzw. Artefakten. Alle
 diese Anwendungspotentiale benötigen eine möglichst realitätsgetreue Simulation.
 Die Software aRTist 2 der Bundesanstalt für Materialforschung und –prüfung (BAM)
 ist eine Simulationsplattform für virtuelle Radiografie und CT-Aufnahmen. Um ein
 spezifisches reales CT-System nachzubilden, ist eine entsprechende Parametrisierung
 in aRTist 2 notwendig. Hierfür gibt es bisher keine vollständige systematische
 Vorgehensweise – die Simulation eines konkreten realen CT-Systems ist oft Resultat
 eines aufwendigen individuellen Anpassungsprozesses, der zeitaufwändig und
 fehleranfällig ist.
 Im Beitrag werden systematische Vorgehensweisen beschrieben, mit denen auf
 Basis einer definierten Anzahl von Projektionsmessungen am realen CT-System eine
 realistische Simulation der Effekte von Brennfleck, Detektorunschärfe und Detektor-
 charakteristik möglich ist. Verschiedene Bestimmungsverfahren für die Effekte wer-
 den diskutiert. Dabei wird der Schwerpunkt nicht auf die möglichst realistische
 Charakterisierung des CT-Systems, sondern auf die Bestimmung von Parametern, die
 dessen Verhalten möglichst genau simulierbar machen, gelegt. Daher wird die Detek-
 torcharakteristik als klassisches Datenregressionsproblem verstanden, bei dem
 gemessene Projektionsgrauwerte durch eine Minimierung möglichst gut in der Simu-
 lation wiedergegeben werden. Weiterhin wird anhand von Messungen hinterfragt,
 inwiefern das Grauwertrauschen realer Projektionen sinnvoll wiedergeben werden
 kann.
 Als Ausblick wird diskutiert, welche weiteren Schritte für die Parameterbe-
 stimmung und Parametrisierung der Simulation notwendig sind. Als Fernziel soll auf
 Basis definierter Messprozeduren eine wiederholbare und übertragbare Vorgehens-
 weise geschaffen werden, mit der die Simulation eines realen CT-Systems ohne
 individuellen, iterativen Anpassungsprozess möglich ist. Dies würde den Nutzen und
 die Anwendbarkeit der CT-Simulation deutlich erhöhen bzw. erleichtern.

 1
Lizenz: https://creativecommons.org/licenses/by-nd/4.0/deed.de
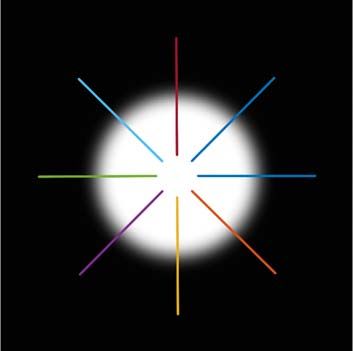
Introduction

The simulation of industrial X-ray computed tomography (CT) measurements would
potentially allow numerous applications like numerical measurement uncertainty evaluation,
simulative measurement parameter optimisation and correction of artefacts using simulative
predictions. All of these applications require a faithful simulation. There are simulation
platforms available – e.g. Scorpius XLab by Fraunhofer EZRT (Fürth, Germany) [1], CIVA
CT [2], SimCT by FH OÖ (Wels, Austria) [3] or aRTist by BAM (Berlin, Germany) [4]. The
latter is used for the purpose of this article. All of these simulation platforms simulate the
physical radiographic processes and allow for the parametrisation of different acquisition
scenarios. They do however not provide a faithful simulation of any given real CT system
out of the box as the parametrisation is still challenging.
After a general overview of the problem, this article describes systematic approaches to
capture some elements of the real CT system behaviour faithfully and parametrise them in
aRTist.

1. Challenges for the Simulation of Specific CT Systems

An overview of the necessary steps for CT system parameterisation – i.e., the determination
of parameters for a simulation platform that will enable faithful and realistic simulations of
a specific real CT system – has been given in [5]. The measurement object needs to be
represented as a geometric model as input for the simulation. This in itself can be challenging
for non-destructive testing purposes if e.g. pores have to be simulated realistically [6]. For
dimensional metrology purposes, a CAD model is often available and can be used. It is useful
for the exact material composition to be known as even small fractions can influence the
attenuation characteristics [5].
 For the CT system itself, the parametrisation can be roughly subdivided into the X-
ray source properties, the detector properties and the geometrical behaviour of the system.
Obviously, further system properties might be relevant for selected use cases or selected CT
systems, therefore this categorisation should not be understood as exhaustive.
 For the X-ray source, the most obvious characteristic is its spectrum. There are
multiple spectrum estimation tools available (see e.g. [7,8]). For the purpose of this
discussion, they will be considered adequate. A characteristic of real X-ray sources that these
spectrum estimators do usually not capture is angular anisotropy of the flux or spectrum – if
this effect proves relevant and cannot be modelled in another fashion, this is a possible source
of deviations between a simulation and real CT systems. The X-ray source is usually a X-ray
tube with a target on which incident electrons cause X-ray radiation. To limit the thermal
stress on the target, the incident electron ray is usually defocused, leading to a focal spot,
which blurs the projection. The focal spot size and shape are therefore important CT system
properties that need to be captured by the simulation. Simple edge-projection-based methods
can already yield some information about the focal spot size but are limited concerning their
information about the focal spot shape [9,10]. A method recently rediscovered for industrial
computed tomography systems is the single shot focal spot reconstruction [11-13]. A circular
aperture is X-rayed at a high magnification and edge grey value profiles in all directions are
collected around the projected circle (compare Figure 1). The derivatives of those edge
profiles are a rescaled version of the Radon transform of the focal spot shape and therefore
allow for reconstruction of the focal spot.
 All properties of the source can change over time (e.g. due to thermal load). This
change needs to be characterised and accounted for in the simulation if it happens during the
time scale of one scan.

 2
Fig. 1. Illustration of the focal spot CT method. The projection of a circular aperture is acquired and the edge
profiles along the circle are extracted. The derivatives of these edge profiles are calculated and can be used as
 input data for a planar reconstruction of the focal spot shape.
For the detector, spectral response (compare section 2.1) and noise behaviour (compare
section 2.2) are important properties that need to be modelled. Furthermore, the detector has
a certain inherent unsharpness that can be measured using edge profiles [9,10] or adequate
standardised methods [14-16]. Detectors can further exhibit effects like afterglow, internal
scatter or fluorescence, which will not be discussed here. If these effects are relevant, they
need to be included in the simulation model as well.
 The geometrical behaviour of the CT system entails both the system acquisition
geometry and the deviations from the acquisition setup occurring during a typical CT scan.
While the system acquisition geometry is usually well known due to system qualification
procedures and because it is needed for the reconstruction of the acquired projections, the
deviations from this assumed acquisition geometry are rarely characterised, much less
available to the end-user wanting to simulate their CT system. There are approaches to
determine these by evaluating projections (see e.g. [17-19]), but this topic will not be
discussed in detail in this article.
 For all properties listed in this section – both of the scanned object as well as the CT
system – it is currently unclear how accurate they need to be modelled in a simulation
software for which purpose. It is plausible that for different applications, different levels of
accuracy will suffice. As long as there is little experience on that matter, it does seem
instructive to aim for an accurate modelling of each property the real CT system does exhibit.
Reducing the effort in modelling single parameters or properties is easily feasible once the
whole simulation model yields realistic results analysing the perturbation of single
parameters and deriving (task-specific) parameter sensitivities. This can however only be
done once the whole simulation model is resulting in realistic projections – single parameter

 3
studies have limited significance for the necessary accuracy as they cannot capture
correlation effects.

2. Realistic Modelling of Detector Properties

Section 2.1 summarises an approach to derive a detector characteristic for the simulation
from measured projection data. Section 2.2 describes characterisation measurements of the
noise behaviour of a real CT system.

2.1 Spectral Detector Characteristic

In principle, the single parts of the detector can be modelled as faithfully as possible e.g. in
a physical particle transport Monte Carlo simulation or using models as proposed in [20]. A
different approach is to treat the detector as a black box and try to find model parameters
within the simulation approach that reproduce measured data as well as possible. We have
done this in [21]. The approach is based on measuring attenuation sequences of a material
with increasing material thickness at different tube voltage-/current-settings and extracting
different lines of calculated energy density-grey value characteristics for each voltage-/
current-setting. A spectral characteristic – that modifies the energy density values – is then
obtained by an optimisation procedure with the difference between the different
characteristics as a minimisation target function. The resulting spectral characteristic allows
the simulation to reproduce the grey values of the projections for all different voltage-/
current-settings. Details on the approach can be found in [21].

Fig. 2. Left: Measured average projection grey values versus energy densities calculated without any spectral
sensitivity. Right: Measured average projection grey values versus energy densities calculated with optimised
 spectral sensitivities. The optimisation procedure is therefore able to reproduce the spectral response of the
 real detector in the simulation. Taken from [21].

2.2 Image Noise in Projections

In projections of CT scans, there are multiple sources for grey value noise. Stolfi et al. name
four categories: random noise, quantum noise, electronics noise and round-off noise [22].
This noise is a contribution to the measurement uncertainty [23] and thus, an important
characteristic that the simulation should be able to reproduce. Consequently, we wanted to
inspect the noise characteristic of real projections to know how they should look. We
therefore measured projections with empty measurement volume at different settings using
the Zeiss (Oberkochen, Germany) Metrotom 1500 at the Institute of Manufacturing

 4
Metrology. For each setting, we measured around 1 000 projections to be able to see the noise
behaviour of each single pixel. Figure 3 shows the pixel-wise standard deviation of the grey
values at tube settings of 180 kV and 180 µA based on 1 000 projections. The projections are
flatfield-/gain-corrected. It is visually clear that the noise is non-ergodic – i.e., the ensemble
noise and the single pixel noise are not the same. The projection noise can therefore not be
characterised by inspecting single projections as this would neglect the spatial dependence
of the noise.

Fig. 3. Pixel-wise standard deviation of the grey values at tube settings of 180 kV and 180 µA based on 1 000
projections. A 0.25 mm Cu filter was used. The detector settings are 1 000 ms acquisition time, 16 x gain and
 no binning or image averaging.
The single pixel grey values show distributions that are compatible with a normal distribution
hypothesis according to Kolmogorov-Smirnov, Lilliefors, Anderson-Darling and Jarque-
Bera test for almost all pixels (rejection percentages below 0.02 % for all settings and all
tests). The patterns (as seen in Figure 3) seems to be characteristic for the detector as,
visually, they all seem to have a high degree of similarity (for various different tube settings).
To quantify this, ratio maps were created. These ratio maps , (with , denoting the
pixel indices) are calculated according to:

 ,
 ,
 ,

Here, , is the standard deviation image of a ‘reference’ setting and , the standard
deviation image of the setting under inspection.
For the tube setting of 140 kV and 360 µA, the ratio map is shown in Figure 4. It is
remarkable that all patterns seen in the noise image in figure 3 (which are similarly present
in the noise image for 140 kV and 360 µA (not shown)) vanish and the ratio map exhibits
visually pattern-free variations. This is interpreted as another indicator that the noise patterns
 5
are indeed characteristic for the detector and can be modelled accordingly. Similar ratio maps
result for most other measurement settings tested.

 Fig. 4. Ratio of pixel-wise grey value standard deviation of the measurement at tube settings of 140 kV and
360 µA and the measurement at tube settings of 180 kV and 180 µA (as reference; settings as in figure 3). It is
 worth noting that there are no clear patterns in the resulting image.
 The acquisition settings are 0.25 mm Cu filter, 1 000 ms acquisition time, 16 x gain and no binning or image
 averaging.
Motivated by these apparent similarities, we rescaled each standard deviation image for the
different settings by dividing by its own mean value. As a result, we obtained different
rescaled noise pattern images that have a high similarity. This means that, phenomeno-
logically, the noise could be simulated by using one single Gaussian distribution (with the
mean standard deviation appropriate for the tube and detector settings) for the whole detector
and then multiplying the resulting noise image by the rescaled map which captures the actual
spatial noise distribution the real projections exhibit. This would permit transferring the real
spatial distribution of the noise onto the simulated projections.

3. Conclusions

Section 1 summarised the challenges and steps necessary to parameterise a real CT system
in a radiographic simulation platform. In section 2, an approach for spectral sensitivity
determination of the detector using measured projections as well as an approach to transfer
real projection noise characteristics onto simulated projections were presented. It was shown
that projection noise is non-ergodic, meaning that an accurate characterisation is not feasible
using a single projection but will be a time-intensive process. The actual implementation of

 6
the transfer of the noise characteristics onto simulated projections will be a future step of
research.

Acknowledgements

F.W. would like to thank Carsten Bellon and David Plotzki (both BAM Federal Institute for Materials Research
and Testing) for many insightful discussions about aRTist and valuable help with using aRTist.
This work was funded through the project CTSimU (WIPANO project 03TNH026A). WIPANO projects are
financed by the German Federal Ministry for Economic Affairs and Energy and managed by Project
Management Jülich.

The Institute for Manufacturing Metrology would like to thank the German Research Foundation (DFG) for the
financial support of the acquisition of the CT system "Zeiss Metrotom 1500" through Grant No. 324672600.

Author Contributions according to CASRAI CRedit Taxonomy [24]

 F. W. contributed Conceptualization, Data curation, Formal Analysis, Investigation, Methodology,
Software, Visualization as well as Writing - original draft. Both T. H. and F. W. contributed to Funding
acquisition and Project administration. T. H. contributed Resources, Supervision and Writing - review &
editing.

References

[1] J. Hiller, T. Fuchs, S. Kasperl and L. Reindl, “Einfluss der Bildqualität röntgentomographischer
Abbildungen auf Koordinatenmessungen Grundlagen, Messungen und Simulationen“, Technisches Messen,
Vol. 78, pp. 334-347 (2011)
[2] Extende, “COMPUTED TOMOGRAPHY WITH CIVA”, (05.05.2020)
[3] M. Reiter, M. Erler, C. Kuhn, C. Gusenbauer and J. Kastner, “SimCT: A simulations tool for X-ray
imaging”, NDT.net issue, Vol. 21, No. 02, (2016)
[4] C. Bellon, K. Burger and C. Gollwitzer, “Virtual CT acquisition and reconstruction of complex and noisy
scanning trajectories in aRTist”, Proceedings of the 9th Conference on Industrial Computed Tomography,
Padova, Italy (2019)
[5] F. Wohlgemuth, F. Wolter, and T. Hausotte, “Digitale Zwillinge metrologischer Röntgencomputer-
tomografen für die numerische Messunsicherheitsbestimmung,” in ZfP heute. Wissenschaftliche Beiträge zur
zerstörungsfreien Prüfung 2020, Ed. 2020, pp. 106–110
[6] P. Fuchs, T. Kröger, T. Dierig, and C. S. Garbe, “Generating Meaningful Synthetic Ground Truth for Pore
Detection in Cast Aluminum Parts,” in 9th Conference on Industrial Computed Tomography, Padova, Italy,
2019
[7] C. Leinweber, J. Maier, and M. Kachelrieß, “X-ray spectrum estimation for accurate attenuation
simulation”, Medical Physics, 44 (12), pp. 6183–6194, 2017
[8] Deresch, “Modellierung von Röntgenspektren für technische Anwendungen“, Universität Potsdam, 2015
[9] M. Fleßner, M. Blauhöfer, E. Helmecke, A. Staude, and T. Hausotte, “CT measurements of microparts:
Numerical uncertainty determination and structural resolution”, in: SENSOR 2015, Nürnberg, 2015

 7
[10] C. Orgeldinger, F. Wohlgemuth, A. Müller, and T. Hausotte, “Spot size and detector unsharpness
determination for numerical measurement uncertainty determination”, in: 9th Conference on Industrial
Computed Tomography, Padova, Italy, 2019.
[11] G. D. Domenico, P. Cardarelli, A. Contillo, A. Taibi, and M. Gambaccini, “X-ray focal spot reconstruction
by circular penumbra analysis-Application to digital radiography systems”, Medical Physics, 43 (1), pp. 294–
302, 2015
[12] U. Ewert, G.-R. Jaenisch, A. Deresch, B. A. Bircher, and F. Meli, „Neue Konzepte zur Messung von
Parametern der Brennflecke von Nano- und Mikrofokus-Röntgenröhren“, in: DACH-Jahrestagung 2019, 2019
[13] U. Ewert, G.-R. Jaenisch, A. Deresch, B. A. Bircher, and F. Meli, “New Concepts for the Measurement of
Focal Spot Parameters of Nano- and Microfocus X-Ray Tubes”, in: International Symposium on Digital
Industrial Radiology and Computed Tomography – DIR2019, 2019
[14] ASTM E2597/E2597M – 14
[15] ASTM E2002 – 15
[16] DIN EN ISO 19232-5:2018-12, Zerstörungsfreie Prüfung – Bildgüte von Durchstrahlungsaufnahmen –
Teil 5: Bestimmung der Bildunschärfezahl mit Doppeldraht-Typ-Bildgüteprüfkörpern (ISO 19232-5:2018)
[17] B. A. Bircher , F. Meli , A. Küng , R. Thalmann, “CT geometry determination using individual radiographs
of calibrated multi-sphere standards”, in: 9th Conference on Industrial Computed Tomography, Padova, Italy
(iCT 2019)
[18] B. A. Bircher, F. Meli, A. Küng, R. Thalmann, “X-ray source tracking to compensate focal spot drifts for
dimensional CT measurements”, in: 10th Conference on Industrial Computed Tomography, Wels, Austria (iCT
2020)
[19] M. Ferrucci, “Systematic approach to geometrical calibration of X-ray computed tomography
instruments”, KU Leuven, 2018
[20] J. Hiller, “Abschätzung von Unsicherheiten beim dimensionellen Messen mit industrieller Röntgen-
Computertomographie durch Simulation”. IMTEK, University of Freiburg, 2011.
[21] F. Wohlgemuth, C. Bellon and T. Hausotte, “Measurement-based Detector Characteristics for Digital
Twins in aRTist”. WCNDT2020, South Korea 2022 (accepted)
[22] A. Stolfi, L. De Chiffre and S. Kasperl, “Error Sources”, in: S. Carmignato, W. Dewulf, R. Leach,
“Industrial X-Ray Computed Tomography”, Springer, Cham, 2018
[23] A. Rodríguez-Sánchez, A. Thompson, L. Körner, N. Brierley, R. Leach, “Review of the influence of noise
in X-ray computed tomography measurement uncertainty”, Precision Engineering 66 (2020) 382–391
[24] CASRAI, CRediT, available on https://casrai.org/credit/ (accessed 16.03.2021)

 8
You can also read