REDESIGNING LIVER DISTRIBUTION TO REDUCE VARIATION IN ACCESS TO LIVER TRANSPLANTATION - ACONCEPTPAPERFROMTHEOPTN/UNOSLIVERANDINTESTINALORG AN ...
←
→
Page content transcription
If your browser does not render page correctly, please read the page content below
Redesigning Liver Distribution to
Reduce Variation in Access to Liver
Transplantation
A Conc ep t Pap e r f r om t he OPTN/ UNOS Live r a nd In te sti nal Org a n T r a n sp la nta t i on
Committee

Circulated for Consideration June 16 – July 11, 2014
Executive Summary
There are significant geographic differences in access to liver transplantation across the United
States. Where transplant candidates are listed affects how likely they are to receive a liver
transplant and therefore their likelihood of death.
In 2013, 1,523 candidates (an average of eight per day) died while waiting for a liver transplant.
Another 1,552 were removed from the waiting list because they were considered too ill to
transplant. Candidates in some parts of the country must wait until they are very sick before
they receive a liver transplant, while those in other parts of the country may receive transplants
when they are much less ill.
The Organ Procurement and Transplantation Network (OPTN) is charged with developing a
national transplant system that uses objective criteria, based on medical evidence, to provide all
candidates nationwide with equitable access to transplantation. Where there are significant
disparities, there is opportunity for improvement. Even so, many factors contribute to these
disparities, and no single approach can equalize the experience of all candidates nationwide.
The OPTN manages the process of matching organs from deceased donors with medically
compatible transplant candidates nationwide. For matching livers, the process involves two
components:
a ranking component for ordering candidates according to medical urgency (allocation)
a pattern of geographic areas of the country where donated livers are matched to a
priority-ranked list of candidates (distribution)
Liver allocation has been based on the model for end-stage liver disease (MELD) and pediatric
end-stage liver disease (PELD) scores since 2002. This system prioritizes candidates based on
the risk of death while awaiting liver transplantation. The MELD/PELD system has proven to be
highly objective and a reliable predictor of most liver candidates’ short-term risk of dying without
receiving a transplant. While the MELD/PELD system has been adjusted since its
implementation to meet more precise needs and conditions of certain groups of liver candidates,
this concept document does not suggest any fundamental change to its use.
Liver distribution has been based historically on the geographic relationship between the
hospital where the organ is recovered and the transplant hospital where the candidate is listed.
Similar to kidney and pancreas allocation, the current liver distribution system uses a “local,
regional, national” algorithm.
The local distribution unit is defined as the donation service area (DSA) of an organ
procurement organization (OPO). There are 58 OPOs nationwide. Each serves a unique
service area, which may range from a single large metropolitan area to multiple states. OPOs
also vary widely in the number of people residing within their DSA, the frequency of deaths of
people medically suitable to be organ donors, and the number of transplant centers and
transplant candidates located within the DSA.
The OPTN system is divided into 11 geographic regions. The regional boundaries were based
upon historic organ sharing relationships. While the regional structure was developed originally
Page i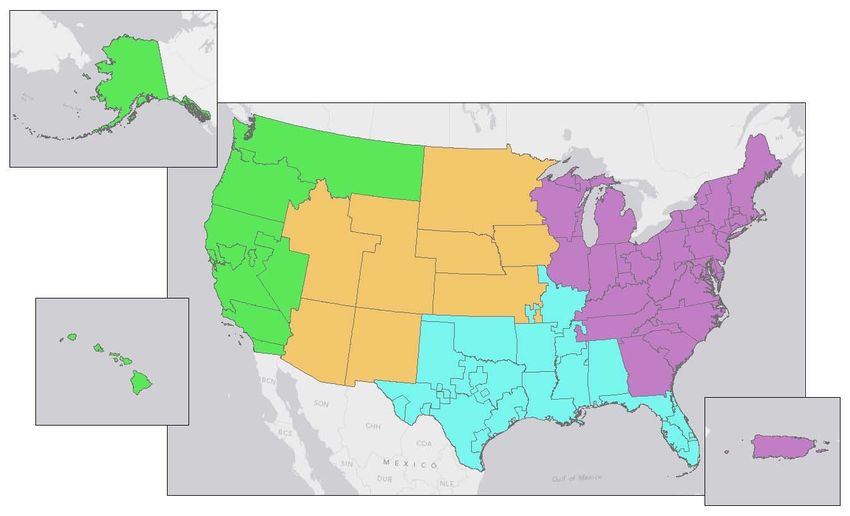
to facilitate organ allocation and to provide individuals with the opportunity to discuss issues
regarding organ procurement, allocation and transplantation that are unique to their particular
geographic area, the regions were not designed for optimal organ distribution.

Addressing These Disparities
The Health Resources and Services Administration (HRSA) explicitly addressed fair access and
geographic disparities in the OPTN final rule, effective March 2000. Additional
recommendations by the Institute of Medicine and the U.S. Department of Health and Human
Services’ Advisory Committee on Transplantation support the need for effective distribution of
livers based on medical evidence and not necessarily utilizing arbitrary DSA boundaries.

Over the years, the OPTN has enacted a series of changes to liver allocation and distribution
policy to broaden urgent candidates’ access to liver transplantation and minimize the effect of
geography. These efforts collectively have reduced deaths among waiting list candidates, a key
measure of system effectiveness. They have not, however, significantly reduced geographic
variation in the level of medical urgency many candidates must reach to receive liver
transplants.

In November 2012, the OPTN/UNOS Board of Directors agreed that geographic disparities in
candidate access to liver transplants are unacceptably high. The Board charged organ specific
committees, including the OPTN/UNOS Liver and Intestinal Organ Transplantation Committee,
to develop policy to minimize the effects of geography on access to transplantation for listed
candidates.

The Liver Committee has investigated a number of approaches to reduce geographic disparity,
in order to select the approach that may result in the most effective gains, while minimizing
undesirable effects such as increases in organ preservation time, costs related to organ
preservation and transportation, and organ discards. A leading method under consideration, as
an alternative to existing local/regional liver distribution, is distribution based on districts that
were mathematically optimized to reduce the variation in the median MELD at transplant.
Additionally, statistical and simulation modeling strongly suggests that using optimized
geographical allocation districts would likely reduce both waitlist deaths and variation in the
MELD or PELD scores at transplant. A series of maps have been generated using
mathematical optimization techniques designed to decrease geographic disparity based upon
criteria identified by the Liver Committee.

Summary of Results
The below table shows some summary results from the models being considered, as well as
results for the current system, full regional sharing using the current 11 regions, and national
sharing.1 National sharing would represent the “outer edge” in terms of reducing the effects of
geography for the sake of comparison, but is not under consideration. As compared to the
current system, maps of 4 and 8 districts would reduce the disparity, as measured by the

1 These are results of a 5-year simulation period using the Liver Simulated Allocation Model (LSAM). For more
information about the LSAM, see the Appendix.

Page ii
standard deviation of the MELD score at transplant across all the DSAs. Further, waiting list and
total deaths would be greatly reduced.

 Districts      Standard        % of               % of            %             Net total   Net
                deviation,      Transplants        Transplants     Pediatric     deaths      waitlist
                MELD @          with MELD          with MELD                     (over 5     deaths
                transplant      scores             scores                        years)
                                25
 4              1.87            2.5%               64.3%           8.7%          -553.8      -581.1
 8              2.08            3.7%               59.6%           8.1%          -332.4      -342.1
 Current        3.01            5.8%               50.1%           7.5%          0           0
 System
 Regional       3.26            5.5%               54.3%           7.7%          -164.6      -122.4
 National       1.66            1.9%               83.3%           10.4%         -343.6      -509.9

Potential Concerns
Any potential change to organ distribution will likely raise concerns and questions. The Liver
Committee recognizes several areas of concern, including the potential for increased costs,
organs being shifted from higher performing OPOs to lower performing OPOs under broader
sharing, and potentially poorer post-transplant outcomes due to transplanting more critically ill
candidates. Recent modeling analysis have included results related to total costs and organ
import/export for the various alternatives discussed. These are described in detail in this
document. In summary, the modeling suggests that total costs (pre-transplant, transport,
transplant plus one year follow-up, and plus 3 years of follow-up) would decrease under
redistricting due to the decrease in the cost of pre-transplant care. Further, there were no
apparent relationships between OPO performance metrics and several metrics related to liver
distribution.

Path Forward
After reviewing the modeling data, the Liver Committee unanimously agreed to seek public input
on the concepts it has discussed.

It is important to note that this document is not a policy proposal. It is a concept document,
intended to inform all interested parties about the status of the Liver Committee’s discussion
and seek valuable input, including alternative approaches, for further consideration. Any
resulting proposal will be submitted for public comment to allow any interested party to share
additional opinions, question or recommendations. The Liver Committee will consider and
respond to those comments before any final proposal is submitted to the Board for
consideration. The earliest any potential policy proposal will be circulated for public
comment is in the spring of 2015.

We encourage all interested organizations and individuals to review the concepts and
supporting information in this document, then provide responses to a brief questionnaire. These
responses will be used to guide additional discussion at a public forum, to be held in September

Page iii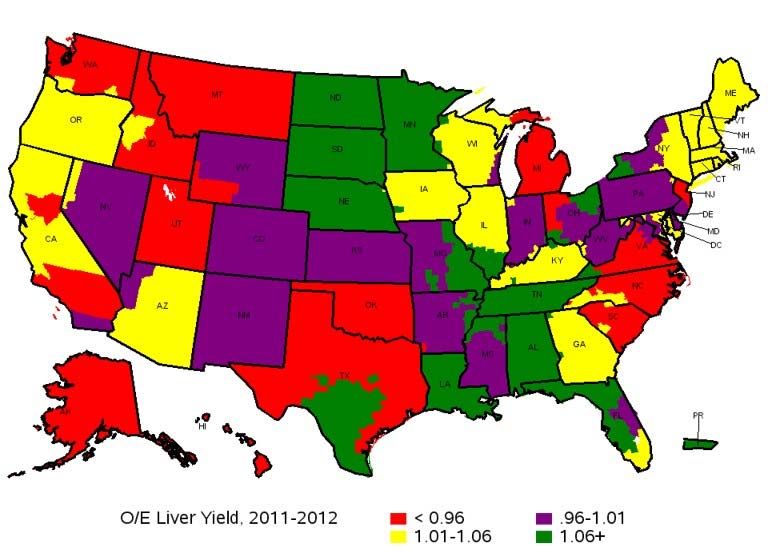
2014 in Chicago. The Liver Committee is willing to consider any alternative concepts suggested
and will use this input to assist in further development of liver policy to minimize the effects of
geography on access to transplantation for listed candidates.

Page iv
Contents
Executive Summary ....................................................................................................................... i
Introduction ................................................................................................................................... 1
The Current System...................................................................................................................... 3
   Concerns with Geographical Distribution ..................................................................................4
   Analysis of the Current System ................................................................................................. 5
Redistricting as a Potential Solution ............................................................................................. 7
   Cross-Organ, System-Wide Issues ...........................................................................................8
   Considerations of Liver Committee ...........................................................................................8
   Predicted Benefits of Liver Redistricting....................................................................................9
Analyses of Potential Redistricting.............................................................................................. 13
   Financial Considerations ......................................................................................................... 13
   Relationship to OPO Performance ..........................................................................................14
   Impact on Donation Rates....................................................................................................... 14
   Relationship to Transplant Center Volumes ............................................................................15
   Impact on Minority or Disadvantaged Populations ..................................................................15
Additional Issues Requiring Further Analyses ............................................................................15
   Acceptance Practices.............................................................................................................. 16
   Review Boards ........................................................................................................................ 16
   Multi-Organ Considerations..................................................................................................... 16
Information Requested................................................................................................................18
Appendices ................................................................................................................................. 19
   Simulation Modeling ................................................................................................................ 19
   Previous Efforts to Reduce Variation in Access ......................................................................22
   National Liver Review Board ................................................................................................... 25
   Contents of Questionnaire....................................................................................................... 26

Introduction
The OPTN/UNOS Liver and Intestinal Organ Transplantation Committee (the Liver Committee)
requests feedback from the transplant community and the public regarding the next steps to
consider as it seeks to reduce the variation in access to liver transplantation. This paper
summarizes the challenges in fair access to liver transplants posed by geographic disparity,
concepts under current consideration, and alternative approaches investigated. This concept
paper also includes a link to a questionnaire. Feedback from that questionnaire will be used to

Page 1
develop a forum for participants to further discuss the concepts in this paper and recommend
ways to address the current inequities in access to liver transplantation.

                                                           Many factors affect the geographic
                                                           variation in how ill candidates must
                                                           be in order to have routine access to
                                                           liver transplantation in the United
                                                           States. The OPTN/UNOS Board of
Directors has directed the Liver Committee to address factors within the purview of the OPTN to
provide more equal access to liver transplantation. The Liver Committee has investigated and
implemented several attempts to address these inequities.

Since 2011, the Liver Committee has investigated redistricting as a possible solution to these
geographical inequities.2 Redistricting would involve drawing new geographic boundaries for
liver distribution to be used instead of the current regions and DSAs. These new boundaries
would be optimized to address the current inequities in access to liver transplantation. Like any
large potential change, there are several questions raised by this potential solution. This paper
attempts to identify and provide information about these questions.

We encourage any interested organizations and individuals to review the concepts and
supporting information in this document, and then provide responses to a brief questionnaire.
These responses will be used to guide additional discussion at a public forum, to be held in
September 2014 in Chicago. The Liver Committee is willing to consider any alternative concepts
suggested, and it will use this input to assist in further development of liver policy to

Reduce the variation in access to liver transplants for candidates nationwide.

It is important to note that this document is not a policy proposal. It is a concept document,
intended to inform all interested parties about the status of the Liver Committee’s discussion
and seek valuable input, including alternative approaches, for further consideration. Any
resulting proposal will be submitted for public comment to seek additional opinions, questions or
recommendations. The Liver Committee will consider and respond to those comments before
any final proposal is submitted to the Board for consideration. The earliest any potential
policy proposal will be circulated for public comment is in the spring of 2015.

2Summary of OPTN/UNOS Liver and Intestinal Organ Transplantation Committee Meeting (December 14, 2011),
Available via:
http://optn.transplant.hrsa.gov/CommitteeReports/interim_main_Liver&IntestinalOrganTransplantationCommittee_1_1
1_2012_9_45.pdf

Page 2
The Current System
OPTN membership is divided into 11 geographic regions, each of which contains multiple Organ
Procurement Organizations (OPOs) with a unique donation service area (DSA). The regional
structure was developed to facilitate organ allocation and to provide individuals with the
opportunity to discuss issues regarding organ procurement, allocation and transplantation that
are unique to their particular geographic area. The regional boundaries were established to
recognize historic organ sharing relationships; however, the current regional boundaries were
not designed to optimize liver distribution.

Liver allocation
has been based
on the model for
end-stage liver
disease (MELD)
and pediatric
end-stage liver
disease (PELD)
scores since
2002. This
system
prioritizes
candidates based on the risk of death while awaiting liver transplantation. The MELD/PELD
system has proven to be highly objective and a reliable predictor of most liver candidates’ short-
term risk of dying without receiving a transplant. While the MELD/PELD system has been
adjusted since its implementation to meet more precise needs and conditions of certain groups
of liver candidates, this concept document does not suggest any fundamental change to its use.

Liver distribution has been based historically on the geographic relationship between the
hospital where the organ is recovered and the transplant hospital where the candidate is listed.
Similar to kidney and pancreas allocation, the current liver distribution system uses a “local,
regional, national” algorithm

Page 3
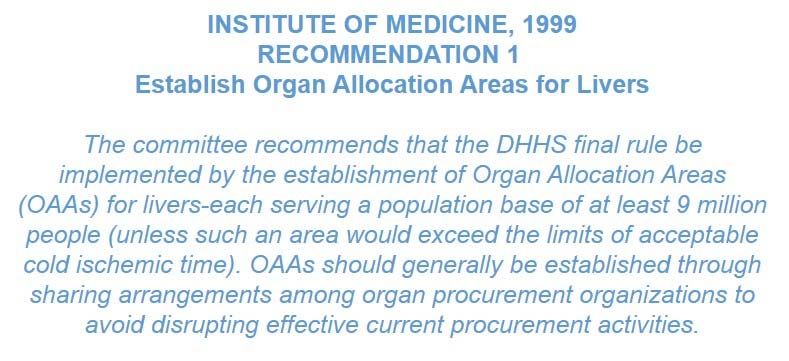
Concerns with Geographical Distribution

                                        The Health Resources and Services Administration (HRSA)
                                        explicitly addressed fair access and geographic disparities in
                                        the OPTN final rule, effective March 2000.3 The final rule built
                                        upon findings of a 1999 study of the OPTN by the Institute of
                                        Medicine (IOM).4 The IOM’s leading recommendation was the
                                        establishment of liver allocation areas broad enough to provide
                                        for medically effective distribution of organs. Further
                                        recommendations by the HHS Advisory Committee on
                                        Transplantation (ACOT) in 2010 approved a recommendation
                                        that states organ allocation should be evidence-based and not
                                        based on the arbitrary boundaries of OPOs or their DSAs.5
                                        HRSA supports effective approaches to develop distribution
                                        systems that minimize this variation.

                                The current efforts are a continuation this multi-year effort by
the OPTN and the Liver Committee to address these geographical inequities. Some of these
attempts have been in place for several years, some were only recently implemented, and
others were never implemented. These attempts include:

3 42 CFR Part 121, see http://optn.transplant.hrsa.gov/policiesAndBylaws/final_rule.asp, hereafter referred to as the
“final rule.” (§ 121.8(b) Allocation performance goals. Allocation policies shall be designed to achieve equitable
allocation of organs among patients consistent with paragraph (a) of this section through the following performance
goals:
…
(3) Distributing organs over as broad a geographic area as feasible under paragraphs (a)(1)-(5) of this section, and in
order of decreasing medical urgency
…
(8) Shall not be based on the candidate's place of residence or place of listing, except to the extent required by
paragraphs (a)(1)-(5) of this section.)
464 FR 56658 (Oct. 20, 1999). Institute of Medicine. Organ Procurement and Transplantation: Assessing Current
Policies and the Potential Impact of the DHHS Final Rule. Washington, DC: The National Academies Press, 1999.
5Minutes of August 19, 2010 meeting of the Advisory Committee on Organ Transplantation. Available via:
http://organdonor.gov/legislation/acotrecs51.html.

Page 4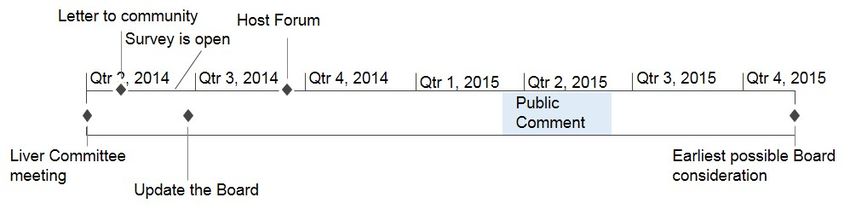
Share 15 Regional
Full Regional Sharing
Concentric Circles
Share 15 National
Share 35 Regional6
Analysis of the Current System
Candidates in some parts of the country must wait until they are quite ill before they receive a
liver transplant, while those in other areas receive transplants when they are much less ill. A
study by Massie and Segev published in the American Journal of Transplantation in 2011
demonstrated the wide variation in rates of transplant across the DSAs. Figures 1 and 2 below
illustrate these disparities.
Figure 1: 90-day Rate of
Transplant across DSAs7
Figure 1 illustrates this
disparity by showing the
wide variation in rates of
transplant across the 58
OPOs. For example, a
candidate with a MELD
score of 38 might have an
18% chance of transplant
in one OPO, versus an
86% chance in another.
6 See the appendix for more information about these previous efforts.
7Massie, A. B., Caffo, B., Gentry, S. E., Hall, E. C., Axelrod, D. A., Lentine, K. L., Schnitzler, M. A., Gheorghian, A.,
Salvalaggio, P. R. and Segev, D. L. (2011), MELD Exceptions and Rates of Waiting List Outcomes. American Journal
of Transplantation, 11: 2362–2371. doi: 10.1111/j.1600-6143.2011.03735.x
Page 5Figure 2: Death Rate per 100 Patient-Years on Waitlist by DSA, 2011
Figure 2 illustrates the wide variation in death rates across the DSAs. Another way to view these
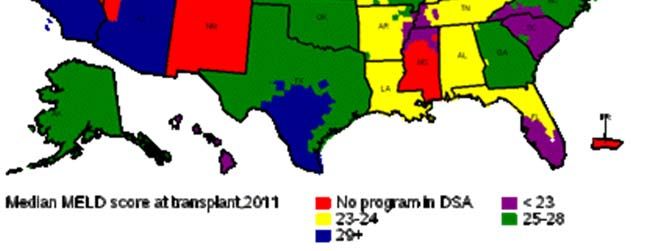
disparities is by looking at the variation in the median MELD at transplant, as shown in Figure 3.
Figure 3: Median MELD score at Transplant, 2011
The Liver Committee is also aware of the differences that exist in utilization, as illustrated by
Figure 4. The degree to which the number of livers transplanted is different from the number
expected based on statistical analysis of donor characteristics varies across the country.
Page 6Figure 4: Observed to Expected Liver Yield, 2011-2012 Where these variations exist, improvements can be made to increase care and access for candidates. The OPTN has prioritized reducing the degree to which OPTN policies contribute to these disparities. While this has been a key goal of the organization, it is a very complex problem and may be addressed by different organ systems in different ways. These issues are not new and there have been many attempts at addressing them over the years. Redistricting as a Potential Solution Redistricting is an established area of operations research that has most notably been applied to designing voting and school districts. Application of this to liver distribution originated under an NIH Challenge Grant to explore optimization methods in the context of organ allocation. At the 2011 American Transplant Congress, Sommer Gentry, Ph.D., presented this study exploring optimization methods in the context of organ allocation. The Scientific Registry of Transplant Recipients (SRTR) has applied this concept to design optimized districts for liver distribution. The mathematics behind optimization has been described in great detail in the published literature.8 The next year, in June 2012, the OPTN/UNOS Board of Directors adopted an OPTN Strategic Plan that included reducing geographic disparities in access to transplantation as one of its objectives.9 The plan called for an examination of the effectiveness of the existing regional boundaries and consideration of new methods for organ distribution. 8 Gentry, S. E., Massie, A. B., Cheek, S. W., Lentine, K. L., Chow, E. H., Wickliffe, C. E., Dzebashvili, N., Salvalaggio, P. R., Schnitzler, M. A., Axelrod, D. A. and Segev, D. L. (2013), Addressing Geographic Disparities in Liver Transplantation Through Redistricting. American Journal of Transplantation, 13: 2052–2058. doi: 10.1111/ajt.12301 9 OPTN Strategic Plan Available via: http://optn.transplant.hrsa.gov/ContentDocuments/OPTN_Strategic_Plan.pdf. Page 7
In November 2012, the OPTN/UNOS Board of Directors agreed that the observed geographic
disparities in transplant candidate access to organ offers were unacceptably high. To begin
analyzing redistricting as a possible solution to the geographic disparities, the Board charged
organ-specific committees, including the Liver Committee, to develop policy to minimize the
effects of geography on access to transplantation for listed candidates. While the organ specific
committees focused on defining a metric of fairness for their specific organ system, the Policy
Oversight Committee (POC), comprised of the vice-chairs from the other OPTN/UNOS
committees, was tasked with developing general principles to consider when addressing
observed geographic disparity in candidate access to transplants.
Cross-Organ, System-Wide Issues
In September and October 2013, the POC discussed the efforts of the organ-specific
committees to redraw their organ distribution regions. The Liver Committee came to several
conclusions where there was general agreement:
Distribution should not begin at the local level but should, instead, begin at least at the
broader regional level.
Regions for organ distribution should be relatively contiguous.
DSA and regional boundaries were not necessarily appropriate for defining organ
distribution areas, and individual organ-specific committees should be able to revise
such distribution areas as needed to achieve the overall goals of OPTN policy.
Different regions could exist for distribution and for other administrative purposes.10 The
use of zones in thoracic allocation had already started this decoupling. Each organ
should have its own metrics for measuring and monitoring the degree of geographic
variation in fair access for transplant candidates.
Metrics other than equity or fairness, such as utility and efficiency, should also be
considered in any system change.
All metrics should measure the impact on vulnerable populations such as children, the
elderly, ethnic minorities, and highly-sensitized candidates.
Each organ-specific committees should determine the makeup of its own review boards
and decide whether to have a national review board, follow the administrative regions, or
follow the allocation regions acknowledging it is more important to have consistency
within the organ system than across organ systems.
Considerations of Liver Committee
In response to the final rule’s performance mandates, ACOT’s recommendation, the transplant
community’s ongoing feedback, the POC’s recommendations, and the Board’s directive, the
Liver Committee considered what improvements in the distribution of livers would be feasible in
terms of logistics, costs and risks related to transportation, recipient outcomes, and community
acceptance.
10 As mentioned earlier, regions are used for multiple purposes (committee representation, review boards, in-person
member meetings, allocation, etc.).
Page 8To address the Board’s direction define a disparity metric for liver distribution; the Liver
Committee selected the variance in the median MELD score at transplant across DSAs, as
MELD has been shown to accurately reflect (with few exceptions) a candidate’s severity of
illness.11
The Liver Committee agreed upon the following parameters for these optimized maps:
The number of districts should be at least 4 and no more than 8;
The minimum number of transplant centers per district is 6;
The maximum median travel time between DSAs placed in the same district is 3 hours;
The number of waitlist deaths under redistricting must not be statistically significantly
higher than in the current system;
The districts should be contiguous.
The Liver Committee investigated distribution based on fewer allocation districts as an
alternative to the existing local/regional distribution. Using simulation modeling to predict how
proposed changes to distribution may affect the transplant system, the SRTR designed optimal
“districts,” that, if utilized for liver distribution, would reduce the disparities that occur under the
current system. Statistical modeling strongly suggests that using fewer geographical allocation
districts would likely result in reduced waitlist deaths and a reduced variation in the MELD or
PELD scores at transplant. These maps were generated by optimizing the areas to decrease
disparity without increasing deaths.
Predicted Benefits of Liver Redistricting
The SRTR presented the results of several redistricting solutions with varying numbers of
districts, compared to the current system: tiered sharing, full regional sharing, and national
sharing. The level of disparity for redistricting, as measured by the standard deviation of MELD
score at transplant across donation service areas (DSAs), would be markedly reduced with 8
districts, having 4 districts would further lower waitlist deaths over the 5-year simulation (n=554
total deaths over five years) as shown in Table 1. LSAM currently uses historic acceptance
practices, which might have led to more discards than would occur under broader sharing.
When Share 15 was implemented, acceptance practices appear to have changed such that
some centers began accepting organs that they did not previously accept. Such behavioral
changes are not included in the LSAM simulations.12 Therefore, the estimates of the number of
lives saved are probably conservative.
While the median transport time does not appear to change much across the options, the
proportion of organs that would be expected to fly increased from 44% under the current system
11 For discussion of other metrics discussed by the Committee, see the Minutes of OPTN/UNOS Liver and Intestinal
Organ Transplantation Committee Meeting (January 24, 2013). Accessed via:
http://optn.transplant.hrsa.gov/CommitteeReports/interim_main_Liver&IntestinalOrganTransplantationCommittee_2_2
7_2013_12_4.pdf.
12 Pomfret, E. A., Fryer, J. P., Sima, C. S., Lake, J. R. and Merion, R. M. (2007), Liver and Intestine Transplantation in
the United States, 1996–2005. American Journal of Transplantation, 7: 1376–1389. doi: 10.1111/j.1600-
6143.2007.01782.x
Page 9to 64% and 74% with 8 and 4 districts, respectively.13 However, the transportation costs, as
shown later, are a small component of the total costs.
Table 1: Results of Optimized Redistricting Plans (5-year LSAM Simulation)
Districts Standard % of % of % Net total Net
deviation, Transplants Transplants Pediatric deaths waitlist
MELD @ with MELD with MELD deaths
Transplant scores scores
25
4 1.87 2.5% 64.3% 8.7% -553.8 -581.1
8 2.08 3.7% 59.6% 8.1% -332.4 -342.1
Current 3.01 5.8% 50.1% 7.5% 0 0
System
Regional 3.26 5.5% 54.3% 7.7% -164.6 -122.4
National 1.66 1.9% 83.3% 10.4% -343.6 -509.9
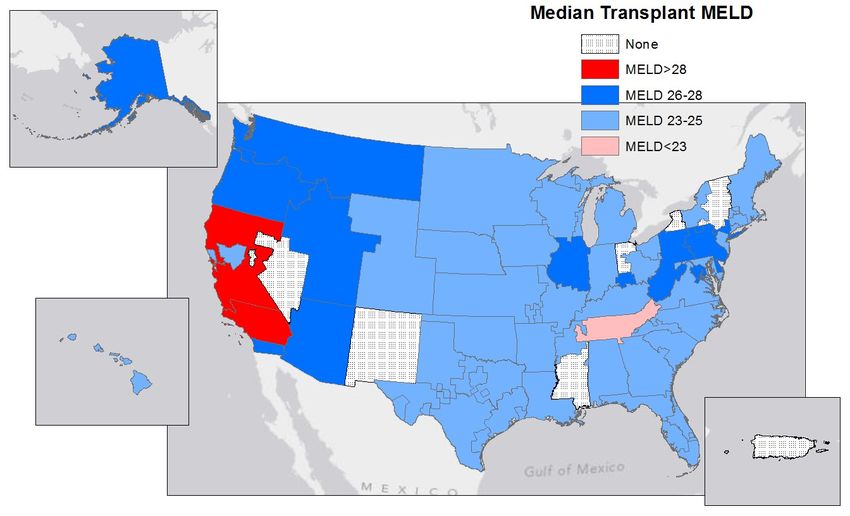
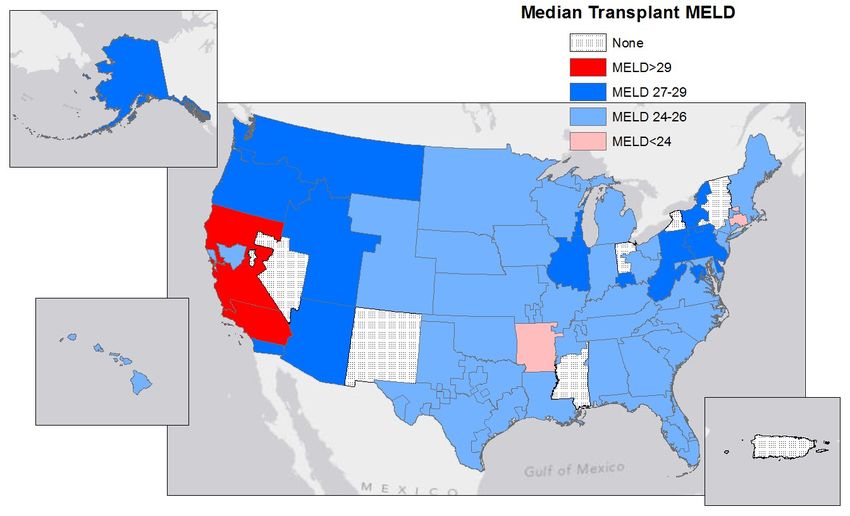
After reviewing the modeling data, the Liver Committee unanimously agreed to seek public input
on the redistricting concepts it has discussed and circulate the conceptual maps of 4 and 8
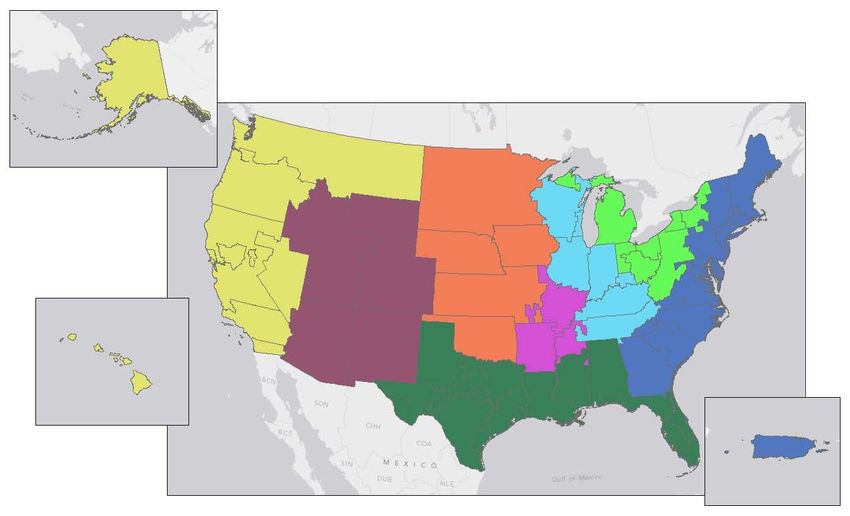
districts. The maps, and their projected impacts, are provided in Figures 5-8.
13 See the Appendix for more information about the effects of the redistricting solutions on organ transportation.
Page 10Figure 5: 4 district distribution model
No liver program
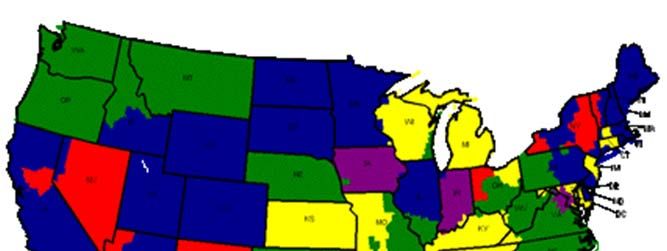
Figure 6: How 4 district distribution model reduces disparity
Page 11Figure 7: 8 district model
No liver program
Figure 8: How 8 district model reduces disparity
Page 12Analyses of Potential Redistricting
The Liver Committee requested additional information about several aspects of any redistricting
solution.
Areas of concern addressed by Liver Committee members include (1) information about costs,
(2) the relationship between OPO performance and organ distribution (3) impact on donation
rates, (4) relationship to transplant center volume, and (5) the impact of minority or
disadvantaged populations. These data were provided for maps with 4 and 8 districts, as well as
for the current policy, the previous policy, and full regional sharing using the current regions.
Financial Considerations
The Liver Committee has considered the potential costs of redistricting. The SRTR examined
the total costs of transplant care: pre-transplant, transport, and transplant plus one year and 3
years of follow-up. This analysis was based upon two papers in addition to data provided by
specific OPOs on the cost of charter flight information.14 With the exception of transportation
costs, these are the costs to the payer (e.g., a private health insurance provider.)
The elimination of local as the first tier of allocation and the use of larger regions may increase
the time, distances and frequency of travel for recovery teams, as well as the transportation cost
at the center level. However, it is predicted to decrease the costs of pre-transplant care. These
cost savings would be larger than the overall transportation cost increases. As a result, total
costs (pre-transplant, transport, transplant plus one year follow-up, and transplant plus three
years of follow-up) would decrease under redistricting due to the decrease in the cost of pre-
transplant care.
Table 2: Costs shows these costs broken down by type of cost and possible
options/solutions/models.
Table 2: Costs
Districts Pre- Transportation Transplant 2-3 year Total Costs
Transplant Costs Plus 1-year follow-up
Costs Follow-up
4 $1,376,893,919 $191,441,724 $2,955,491,110 $497,257,211 $5,404,527,449
8 $1,406,341,692 $175,509,419 $2,969,580,805 $493,132,467 $5,425,225,356
14 Salvalaggio, Paolo R., Nino Dzebisashvili, Kara E. MacLeod, Krista L. Lentine, Adrian Gheorghian, Mark A.
Schnitzler, Samuel Hohmann, Dorry L. Segev, Sommer E. Gentry, and David A. Axelrod. "The interaction among
donor characteristics, severity of liver disease, and the cost of liver transplantation." Liver Transplantation: 233-242.
Salvalaggio, Paolo R., Paula Buchanan, Nino Dzebisashvili, Krista L. Lentine, David A. Axelrod, and Mark A.
Schnitzler. "Liver transplantation cost in the model for end-stage liver disease era: Looking beyond the transplant
admission." Liver Transplantation: 1270-1277.
Page 13Districts Pre- Transportation Transplant 2-3 year Total Costs
Transplant Costs Plus 1-year follow-up
Costs Follow-up
Current $1,651,204,930 $124,863,503 $2,988,449,895 $485,889,231 $5,650,506,926
Regional $1,507,658,537 $165,351,072 $2,977,351,064 $491,003,037 $5,518,322,216
Relationship to OPO Performance
Another issue considered is the relationship between OPO performance and the current
geographical differences on access to transplantation for listed candidates
Some have commented that the current inequities are caused by poor OPO performance in
those areas. The SRTR examined whether there is any relationship between OPO performance
and liver distribution. They studied the observed/expected liver yield (O:E), whether the OPO
was a net importer or exporter, and the median MELD at transplants. In the current system
modeling, the SRTR found:15
In summary after extensive analyses, the following predictions were made:
There is no apparent relationship between OPO performance metrics and liver import
(using the current OPTN definition of organ yield), suggesting that the disparities are not
caused by difference in OPO performance.
Liver imports would flow to DSAs where eligible deaths are lower and where incident
(new) listings are higher, with or without redistricting.
With potential redistricting there was no difference in the rates of transplant by gender,
but there was a statistically significantly higher number of pediatric candidates
transplanted under the redistricting plans (pconducted by HHS published in 2013 indicated that this is not the case.16 Eighty-two percent of survey respondents felt that organs should go to the most medically urgent patient regardless of their location in the United States. Relationship to Transplant Center Volumes Liver Committee members inquired about the possibility that redistricting may reduce transplant volumes at some centers, and perhaps result in center closures, especially in areas with currently low median MELD scores at transplant. Any changes to distribution will result in at least some change in specific transplant center volumes. The LSAM is designed to look at aggregate policy changes; it is not designed to be able to predict changes at specific programs. Further, behavioral changes, which cannot be predicted, may change acceptance practices as noted below; an increase in acceptance of livers may offset predicted decrease at the low volume centers. Impact on Minority or Disadvantaged Populations SRTR modeling analyses indicated that there would be no significant change in the percentage of transplants for blacks (p=0.28), or for “other” ethnicity (p=0.08) under the redistricting scenarios. The percent of transplanted candidates who are white would decrease (p
would have previously been reserved for lower-MELD candidates (by turning
                down such offers for the higher-MELD candidates) may explain this
                                         phenomenon…“17

Acceptance Practices
The implementation of Share 35 introduced some unanticipated issues and concerns related to
sharing organs across regions. Centers and OPOs who had not previously worked together
now needed to agree upon procurement and acceptance practices, often in the middle of the
night or under difficult circumstances.

The Liver Committee has encouraged centers and OPOs to develop some clear “rules of
engagement” to address these issues. These ongoing conversations and agreements would be
crucial to the implementation of any of the redistricting plans, which remove the local tier from
the distribution algorithm and would result in many more organs being shared outside the local
area.

Review Boards
As mentioned above, regions are used for purposes beyond allocation. Changing the number
and boundaries of regions for liver distribution does not require changes to how regions are
used for in-person member meetings, committee representation, or member voting issues.
However, it would have impacts on liver review board operations.

Review of MELD/PELD exception cases is currently handled by each of the 11 Regional Review
Boards, a system that does not promote consistent reviews of the MELD/PELD scores across
the U.S. A potential change to districts would likely require some other mechanism for review.
The Liver Committee will have three broad choices to investigate and develop further:

     1. Maintain the current regional review board structure. The heart review boards utilize the
        common 11 regions even though heart allocation does not utilize the same 11 regions.
     2. Change to a national review board. Lung transplant exceptions are reviewed by a
        national board. In November 2013, the Board of Directors also charged the Liver
        Committee to develop a plan, to include a conceptual basis and a proposed timeline, for
        implementation of a National Review Board (NRB) for review of MELD/PELD exception
        applications. The Board requested that this be presented in June 2014, with a possible
        policy proposal ready for fall 2014 public comment.18
     3. Change the makeup of the review boards to utilize the new districts. This would change
        the makeup and number of the review boards.

Multi-Organ Considerations
Finally, any change to the current boundaries for liver distribution would also require clear
policies for multi-organ transplantation. For example, the Share 35 policy highlighted some
confusion about the rules for sharing kidneys along with livers. The regional priority for

17 Pomfret, E. A., Fryer, J. P., Sima, C. S., Lake, J. R. and Merion, R. M. (2007), Liver and Intestine Transplantation in
the United States, 1996–2005. American Journal of Transplantation, 7: 1376–1389. doi: 10.1111/j.1600-
6143.2007.01782.x
18 For more information about a national liver review board, see the Appendix.

Page 16
candidates with MELD scores of 35 and higher, some of whom have scores in the 35 to 40 range due to their need for dialysis, has led to more regional offers to those awaiting a combined liver-kidney transplant. Some areas of the country have agreed to share the kidney with the liver when the liver is accepted outside the local area. In other areas, there are no stated agreements. Going forward, these types of decisions will need to be addressed either by national policy or by agreements made by all the parties in the sharing area. If a new distribution system is developed for liver transplantation while other organs continue to use the traditional 11 regions for distribution, policies should be developed that clearly describe how the allocation of multi-organ transplants should proceed. Page 17
Information Requested
Please review the information in this document and provide responses to the questionnaire by
July 11, 2014. We welcome responses from individuals as well as institutions, and from any
perspective or experience that may provide information to the Liver Committee. The Liver
Committee also welcomes new and constructive alternative distribution concepts for
consideration and has provided a response field for these suggestions within the questionnaire.

                         Click here to give us your feedback.

At a public forum to be held in September 2014, summary responses to the questionnaire will
be displayed. In preparation for that forum, questionnaire responses will be used to determine
the topics to be discussed.

Responses received after July 11, 2014 will be accepted and shared with the Liver Committee,
but, if received after the cut off, may not be tallied in the summary of information prepared for
the public forum. The forum will provide an additional opportunity for public input, as will the
public comment period that follows the development of any resulting policy proposal.

We thank you and rely on your experience and perspective to help us best meet the needs of all
transplant candidates

Page 18
Appendices
Simulation Modeling
Potential changes to liver allocation were evaluated using the Liver Simulated Allocation Model
(LSAM), a validated discrete event simulator that estimates outcomes under any specified liver
allocation policy. The OPTN has been using LSAM for both research and policy development for
over 10 years. The following scenarios were tested using LSAM:
The current allocation policy
Full regional sharing (no local tier) using the current regions; and
Full “district” sharing (no local tier) with DSAs grouped into optimized areas of 4, 5, 6, 7,
8 and 11 districts, according to the outcomes of the model described above
Concentric circles of 500 miles
Full national sharing
LSAM uses historical inputs (e.g., donors and candidates, organ offer acceptance practices,
removals for death or other reasons). An elaborate transport model was also developed to
determine transport times. Transport distances were calculated from each donor hospital to
each transplant center, and between centers and nearby airports. Drive times were calculated
by Google’s driving algorithm. Flight segment lengths were estimated using scheduled
departure and arrival times, per aircraft category (jet or turboprop). The transport time between
every donor hospital and every transplant center was then estimated based on the most likely
transportation mode, which was determined following extensive discussions and validation with
two large OPOs.
LSAM produced numerous outputs, by DSA and region, for each allocation scenario, such as:
Median MELD score at transplant (including the variance and range across DSAs)
Number and rate of waitlist deaths
Total deaths
Percentage of livers allocated locally
Percentage of livers allocated by transport mode (driving vs. flying)
Average transport distance and time
Percentage of transplants by various demographics (age, gender, ethnicity)
Percentage livers to candidates with MELD scores >25
In March 2013, the Liver Committee reviewed data comparing several potential maps for
distribution, including those using both contiguous (i.e., DSAs in each district must be
geographically contiguous) and non-contiguous configurations, as well as the current system,
full regional sharing using the current 11 regions, 500-mile concentric circles as the initial
distribution unit, and national sharing. The Committee reviewed six optimized maps (A-F):19
19 For more information, see Minutes of the OPTN/UNOS Liver and Intestinal Organ Transplantation Committee
Meeting (March 13, 2013). Accessed via:
http://optn.transplant.hrsa.gov/CommitteeReports/interim_main_Liver&IntestinalOrganTransplantationCommittee_4_1
2_2013_14_17.pdf.
Page 19A. 10 regions, non-contiguous DSAs
B. 11 regions, non-contiguous DSAs
C. 11 regions, contiguous DSAs
D. 4 regions, non-contiguous DSAs
E. 4 regions, contiguous DSAs
F. 6 regions, contiguous DSAs
These results are shown in in Table 3, and were based on 1-year LSAM modeling runs.
Table 3 Modeling Results Presented to the Liver Committee in March 2013
Map Std. Dev. Std. % Net Net Median Median %
of the Dev. in MELD>25 Total Waitlist distance time flying
MELD @ Waitlist deaths deaths
Transplant Deaths
A 3.02 5.23 64% -85 -80 163 1.7 62%
B 2.51 5.55 62% 71 71 139 1.7 62%
C 2.72 5.61 66% 13 36 169 1.7 67%
D 2.78 4.96 71% -164 -157 296 2.0 74%
E 2.84 4.87 72% -153 -149 274 2.0 75%
F 2.81 5.18 67% -97 -90 204 1.9 70%
Concentric 3.1 5.27 62% 46 33 140 1.7 63%
Circles
Current 3.41 5.75 53% 0 0 68 1.5 44%
Regional 3.78 4.88 58% -57 -63 137 1.7 61%
National 1.77 5.06 89% -221 -202 768 2.9 89%
Based on these analyses, the SRTR concluded that, for concentric circles:
The standard deviation of median MELD was 3.1, higher than in the optimized 11-region
maps;
Travel time (1.7 hours) and the percent flying (63%) was almost identical to 11-region
maps;
Net Waitlist deaths (46) were similar to the higher rates among optimized 11-region
maps;
Concentric circles were not superior to optimized 11-region maps on any metric.
Circles based on some fixed difference are not designed to optimize liver distribution as the
optimized maps are designed to do. However, the Liver Committee understands that there may
still be interest in seeing updated, 5-year LSAM results for concentric circles for comparison with
the results for the 4- and 8- district maps. These analyses are currently underway.
Page 20In April 2014, the Liver Committee updated data for potential maps for distribution.20 The results
are an average of ten 5-year LSAM runs. Tables 4 and 5 provide summary statistics for each of
the scenarios modeled.
Table 4: Projected Organ Transport Impacts
Districts % Local % District % Median Median % flying
National distance hours
transport
4 26% 73% 1% 340 2.05 74%
5 31% 67% 2% 354 1.91 73%
6 34% 64% 2% 232 1.85 70%
7 38% 60% 2% 192 1.78 66%
8 40% 58% 2% 178 1.75 64%
11 49% 48% 3% 143 1.71 62%
Current 73% 23% 4% 68 1.5 44%
Regional 49% 48% 4% 137 1.7 61%
National 18% 15% 67% 768 2.9 89%
Table 5: Projected Redistricting Impacts
Districts Standard % MELD % MELD Median Net total Net
deviation 25 transplant deaths waitlist
of MELD deaths
transplant
MELD
4 1.87 2.5% 64.3% 26 -553.8 -581.1
5 2.01 2.9% 61.5% 26 -468 -441.8
6 2.01 3.2% 60.6% 26 -421.3 -431.7
7 2.04 3.5% 59.5% 25 -373.5 -382.2
8 2.08 3.7% 59.6% 25 -332.4 -342.1
11 2.44 4.5% 56.1% 25 -210.5 -239.7
Current 3.01 5.8% 50.1% 25 0 0
Regional 3.26 5.5% 54.2% 25 -164.6 -122.4
National 1.66 1.9% 83.3% 29 -343.6 -509.9
20
See Minutes of the OPTN/UNOS Liver and Intestinal Organ Transplantation Committee Meeting (April 1, 2014).
Accessed via:
http://optn.transplant.hrsa.gov/CommitteeReports/interim_main_Liver&IntestinalOrganTransplantationCommittee_5_1
_2014_11_31.pdf.
Page 21Previous Efforts to Reduce Variation in Access
The current efforts are a continuation of a multi-
year effort by the Liver Committee to address these
geographical inequities. Some of these attempts
have been in place for several years, some were
only recently implemented, and others were never
implemented. Below are some previous attempts
by the Liver Committee to address these
geographical inequities.
Share 15 Regional
The Share 15 Regional policy, implemented in
2005, was intended to reduce waiting list deaths by
directing livers to the candidates who would most
benefit. Analysis of national data showed that the
vast majority of candidates with a MELD/PELD
score below 15 did not receive a net survival
benefit from a liver transplant as compared to not
receiving a transplant. Thus, the goal of the Share
15 Regional policy was to redirect deceased donor
livers to more ill candidates and away from less ill
candidates (MELD or PELD score < 15) who, in
general, will live longer without a transplant than
candidates with a higher MELD or PELD score.
This goal has been met with no adverse impact on
post-transplant outcomes.
Full Regional Sharing
Two separate proposals for full regional distribution
of livers to all candidates ranked by their MELD or
PELD score were distributed for public comment in
the spring of 2009.21 The first proposal was to
create a Regional-National allocation of livers for
the very sickest candidates, Status 1. The second proposed to eliminate local from the adult
allocation algorithm entirely making regional the first level of allocation for all MELD/PELD
candidates.
Based on public comment response, the Liver Committee withdrew the proposal to eliminate
local allocation from consideration and did not forward it to the Board. The Board approved the
proposal for Regional-National Sharing for Status 1, which was implemented in late 2010.
However, as a result of the community’s mixed feedback on the proposal for full regional
21 See Proposal to Create Regional Distribution of livers for MELD/PELD candidates, available via:
http://optn.transplant.hrsa.gov/PublicComment/pubcommentPropSub_239.pdf and Proposal to Create Regional
Distribution of livers for Status 1 liver candidates, available via:
http://optn.transplant.hrsa.gov/PublicComment/pubcommentPropSub_238.pdf.
Page 22sharing for liver candidates, a number of requests and ideas were put forward for the Liver Committee to evaluate and assess in regards to improving the system. Concentric Circles Distribution via concentric circles, akin to the current thoracic organ distribution system, was also evaluated. (Under a concentric circle approach, distribution proceeds within a set of geographic intervals radiating outward from the location of the donor hospital, such as a radius of 500 miles, 1000 miles, etc.) Circles defined by population density were also considered. Although the use of concentric circles has many positive aspects, such as eliminating arbitrary geographic boundaries, distribution based on donor location rather than the transplant center, and current use and acceptance by the thoracic organ community, this system would substantially change liver distribution and may not be “feasible” given the current sentiments. Recent Changes to Liver Distribution Policy From 2009-2010 the Liver Committee sponsored multiple opportunities for community participation and feedback, including a Request for Information (RFI) document, questionnaires, and a public forum. These initiatives revealed several areas of common ground and the potential for consensus-building moving forward. Expansion of the Share 15 Regional policy to a Share 15 National system received substantial support. Other concepts for distribution systems were studied in detail including some form of tiered regional distribution, whereby livers are first offered regionally to candidates with scores over a certain MELD or PELD threshold. Models of tiered sharing with thresholds of 35, 32, 29, 25 and 22 were studied and presented, with the higher thresholds receiving the greatest support. This concept ultimately led to the development of the policy proposal for Share 35 Regional. Based on the feedback received through the RFI, questionnaire and public forum, a Concept Paper and questionnaire were distributed to the community in December 2010. The Liver Committee reviewed these results in February and March of 2011. Three-quarters of the respondents supported a Share 15 National policy. Similarly, the majority supported broader regional sharing at higher MELD scores. Finally, 72% of respondents supported some form of regional sharing. Released for public comment in September 2011, the Liver Committee proposed an extension of the Share 15 Regional policy. Under this policy, deceased donor livers (for donors age 18 and higher) would be offered to all status 1A and 1B candidates and those with MELD or PELD scores of 15 or greater locally, regionally, and nationally before being offered to candidates with lower MELD or PELD scores. The Liver Committee also released a second, separate proposal for regional distribution of livers to candidates with MELD or PELD scores of 35 and greater. Ongoing Evaluation of Share 15 National, Share 35 Regional, and Liver‐Intestine National Share The Liver Committee presented the Share 15 National and the Share 35 Regional policy proposals to the Board in June 2012, both of which were approved and implemented along with the Liver-Intestine National Share by UNOS on June 18, 2013. The Liver Committee has since been tracking the early impacts of these policies and will continue to do so. Page 23
The national data results at six months reveal the following:
As predicted, the percentage of liver transplants for those with MELD scores of 35 or
higher increased from 19.9% of total to 25.2%
Overall deaths on the waiting list have decreased by 7% when compared to the six
months prior to implementation (RR*=0.93 [0.86, 1.0]).
Regional sharing has increased, from 19.4% to 30.7%.
While concerns had been expressed that cold ischemia time (CIT) and the distance the
organs travel would increase with this policy change, this has not been demonstrated in
the data at a national level.
The percentage of discards has decreased nationally from 10.5% to 8.9%. While most
regions have experienced a reduction in discards (defined as a liver recovered for
transplant but not transplanted) in the six months following Share 35, two regions have
experienced a higher number of organs discarded.
The percentage of livers not recovered for transplant has remained the same at 13% of
donors.
While Share 15 National, Share 35, and the Liver-Intestine National Sharing appear to be
achieving the intended goals, regional variation persists in access to transplants for those
candidates most at risk of dying. The Liver Committee will continue to monitor the effects of
these policies, including patient and graft outcomes compared to the pre-Share 35 era, to
address concerns regarding the best use of donated organs.
Page 24National Liver Review Board
In response to the November 2013 directive from the Board, the Liver Committee renewed
discussions regarding a national liver review board.22 The Liver Committee reviewed
MELD/PELD exception data from 2013 to assess the potential caseload. In 2013, there were
approximately 7,200 cases submitted to the RRBs, including initial applications, appeals, and
extensions. The addition of sodium to the MELD score is anticipated to eliminate the 1,200
fluid/sodium-related exception requests. If those exceptions currently included in policy (e.g.,
Cholangiocarcinoma, familial amyloidosis, etc.) are programmed into UNet℠, plus those for
NET, PCLD, and PSC, the total could be reduced to just over 4,000 cases per year. (See
Figure 9.) Advantages of a national liver review board may include:
More consistent exception scores
7200 current cases
Potentially faster turnaround time
-1200 (if MELD-Na approved)
for exceptions
6000
More ability to equalize workloads
-1000 (if specific criteria accepted for
of review board members
NET/PCLD/PSC are programmed)
Difficulties with a national liver review board may 5000
include: - 860 (if other exceptions are
programmed)
Application of regional agreements will _______________
make national standards more 4140 cases/year
complicated
Current regional disparities in MELD at Figure 9: Assessment of Potential Caseload
transplant impact the average MELD under a National Liver Review Board
requested and approved by review boards
This may increase the workload for those review board members coming from regions
that do not currently have a high level of exceptions
22The Committee previously circulated a proposal for a national liver review board in 2004. The proposal did not have
broad support amongst the regions, would have been costly to implement, was not forwarded to the Board for
approval, and therefore was not implemented.
Page 25Contents of Questionnaire
Please consider the concepts and evidence described in the Concept Document and then
indicate the degree of your support or disagreement with the questions below.
Only items marked with an asterisk (*) are required.
1. *The ability of all liver transplant candidates to receive timely access to liver
transplantation is a component of a fair national organ transplant system.
o Strongly Agree
o Somewhat Agree
o Neutral
o Somewhat Disagree
o Strongly Disagree
2. *Addressing the geographic disparity in liver distribution should be a top priority for the
OPTN.
o Strongly Agree
o Somewhat Agree
o Neutral
o Somewhat Disagree
o Strongly Disagree
3. *If the current distribution system were to change, how important are the following
goals? (Very important, Somewhat important, Neutral, Somewhat unimportant, Very
unimportant)
___ Reducing how much the severity of illness varies among all liver candidates at
the time of transplant (for example, reducing variance of MELD/PELD scores at
time of transplant)
___ Fewer deaths on the waitlist
___ Maximum transplant survival benefit
___ Optimal quality of life for liver recipients
___ Maximum number of patients transplanted
Page 26You can also read