Reducing Information Barriers to Solar Adoption: Experimental Evidence from India - Robyn Meeks
←
→
Page content transcription
If your browser does not render page correctly, please read the page content below
Reducing Information Barriers to Solar Adoption:
              Experimental Evidence from India∗

             Meera Mahadevan†                       Robyn Meeks‡                   Takashi Yamano§

                                                  April 22, 2022

                                                    Abstract
Off-grid solar technologies hold promise for unelectrified and low-quality electricity settings;
however, their adoption remains low. Important barriers to adoption, such as incomplete
information remain relatively unexplored in developing countries. In collaboration with a
solar company, a randomized experiment was implemented in three Indian states to test
whether alleviating information asymmetries between sales agents and potential customers
improved predictors and other indicators of adoption of solar rooftop systems. The com-
pany’s sales agents were randomly assigned to receive a tablet consisting of an application
designed to ensure potential customers received accurate information on the solar products
during the sales process. Post-treatment, prospective customers approached by the treated
sales agents report greater knowledge of the solar products and a better impression of sales
agents’ product knowledge and professionalism. The treatment significantly increased poten-
tial customers’ intent-to-adopt, a stated preference measure, by 15%. Actual adoption did
not significantly increase, likely due to the additional income and credit constraints imposed
due to the COVID-19 pandemic.

Keywords: Solar, energy, technology adoption, information, development
JEL Codes: C93, D8, O1, O13, Q56

  ∗ We are grateful to Varun Dutt for invaluable project assistance. We thank Jennifer Alix-Garcia, Taryn Dinkelman, Teevrat

Garg, Gaurav Khanna, Kelsey Jack, Marc Jeuland, Johannes Mauritzen, Anant Sudarshan, the participants at the SETI
workshop 2021, and AEAs 2022 for helpful feedback. Funding for this evaluation was provided by the Asian Development
Bank. This randomized controlled trial was registered in the American Economic Association Registry under trial number
#AEARCTR-0007377. All views expressed in the paper and any errors are our own.
  † Department of Economics, University of California, Irvine. Email: meera.m@uci.edu.
  ‡ Sanford School of Public Policy, Duke University. Email: robyn.meeks@duke.edu.
  § Asian Development Bank. Email: tyamano@adb.org

                                                             1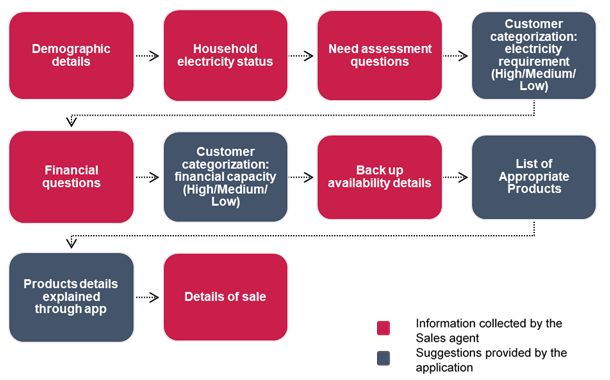
1    Introduction

Worldwide, around 840 million people lack electricity access and another 1 billion are con-
nected to unreliable grids that provide poor quality services with frequent outages and voltage
fluctuations (World Bank, 2020). Off-grid solar technologies, which are less polluting than
electricity generated via burning fossil-fuels, can serve as a stopgap by either providing elec-
tricity services until the grid is extended or by smoothing consumption of electricity until
quality improves (Sharma et al., 2020). The latter is particularly relevant in South Asia,
where unreliable electricity service is widespread (Pargal and Banerjee, 2014) resulting in
more power outages than any other region of the world (Zhang, 2019).

    The adoption of off-grid solar, however, remains low. Studies have examined barriers
to take-up among low-income households, including low willingness-to-pay relative to prices
(Burgess et al., 2020; Grimm et al., 2020; Rom and Günther, 2019; Sievert and Steinbuks,
2020), liquidity constraints (Grimm et al., 2020), and preferences either for the centralized
grid broadly (Burgess et al., 2020) or specific appliances that are more feasibly powered by
the grid (Lee et al., 2016). A number of other factors, however, likely also impact adoption
and require further study (Girardeau et al., 2021). For example, industry reports indicate
that incomplete information on solar products and their suitability for different appliances
drives low adoption among middle-income households and small firms (Chaudhary, 2018;
Trivedi et al., 2017). Although research has shown that information interventions increase
the adoption of other environmental technologies (and with more lasting impacts on adoption
than credit interventions) (see, e.g., Aker and Jack, 2021), such interventions in the context
of solar products remain understudied.

    Through a randomized experiment with an Indian solar rooftop company, we study the
role of information in off-grid solar adoption within the Indian states of Bihar, Uttar Pradesh,
and Odisha. Prior to the experiment, the solar company highlighted information constraints
as a barrier to adoption. Ex-ante, access to credit did not appear to be the main constraint

                                               2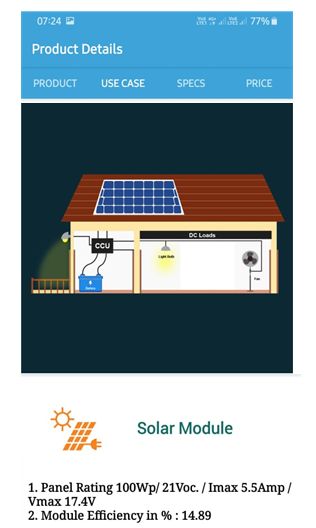
slowing adoption in this context, as the solar company already provided financing options
via a pay-as-you-go model prior to the experiment.1 Additionally, this company relies on
sales agents to sell their solar products; a business model common in developing countries
(Ashraf et al., 2013), yet vulnerable to information asymmetries between sales agents and
potential customers. Sales agents may use potential customers’ incomplete information to
their advantage by either over-promising on the capacity of a particular solar product or
upselling solar products, a finding confirmed by a pre-experiment survey of past purchasers
(Sambodhi Research, 2018).

     The study tests whether an algorithmic mobile application – designed to reduce infor-
mation asymmetries between sales agents and prospective customers, loaded onto electronic
tablets, and used during the sales process – improved consumer knowledge of these solar
products and their returns, thereby increasing adoption. The randomized experiment builds
upon the company’s existing sales structure, in which a single sales agent was assigned to
a census block as their sales territory. The intervention proceeded as follows: within the
solar company’s sales regions, 74 census blocks were randomly assigned to either treatment
or control status. Sales agents operating in treated census blocks were equipped with a
tablet containing a mobile interface (the “treatment app”) which was employed during the
initial sales visit to collect information about the potential customer (e.g., ability to pay
and electricity needs). Information on the most suitable solar product, including details of
the appliances feasibly-powered by the product and a product image, were provided. Con-
trol group sales agents also used an electronic tablet, but theirs contained only a standard
version of the product catalogue without the information guide designed to ensure complete
and correct information would be delivered.

     Our analyses use the solar company’s data on sales agents, the census blocks to which
they are assigned, and their historical sales records, all of which are complemented by baseline
  1 A pay-as-you-go model allows customers to make a down payment on the product, followed by regular payments (e.g.

monthly) until the cost of the technology is repaid in full (World Bank, 2020).

                                                         3
and follow-up surveys. Surveys were implemented by phone due to the government’s COVID-
19 lockdowns and were therefore brief. Nevertheless, the surveys collected data on customers’
(whether they were households or firms) characteristics, their experiences with electricity
and solar products, their knowledge of the solar products, and impressions of the sales’
agents knowledge and professionalism. In total, 2,246 existing solar company customers were
surveyed for the baseline in June 2020 and 2,328 potential customers (those approached by
both the treated and control sales agents) were surveyed for the follow-up during October
and November 2020.
We find three main results. First, potential customers approached by sales agents in the
treatment group were significantly better informed about their purchase options relative to
those in the control group. Second, the tool led to a perceived higher level of sales agents’
professionalism and product knowledge. These effects occur despite the control sales agents
also utilizing tablets in the sales process. Third, the information treatment led to increases
in two indicators of demand for solar. Potential customers in the treatment group report
a strong interest in adopting solar home systems that is 6 percentage points higher than
the control group. Given multiple visits from a sales agent are typically required prior to
a purchase, a reported plan to adopt solar in the near future is a strong predictor of later
purchases (in a pre-experiment survey, 46% of consumers who showed an interest in the
product went on to purchase it (Sambodhi Research, 2018)).2 Further, we find only a 1
percentage point increase in actual adoption, which is statistically insignificant, among the
treatment group.
By focusing on lower-middle and middle-income households, the study provides insights
on a relatively understudied, yet important, demographic group. The global middle class is
expected to play a substantial role in driving the purchases of energy-using assets (Gertler
et al., 2016) and government policies (Government of India, 2018). Further, this consumer
2 The COVID lockdown and resulting income constraints likely lengthened the average time between the first sales pitch and
the purchase.
4demographic may use solar home-systems explicitly for smoothing consumption of electricity
services, not only as a substitute for grid electricity.
With the treatment intended to affect potential consumers’ information on the returns to
solar adoption, our study contributes to both an extensive literature on the microeconomics of
technology adoption (see e.g., Foster and Rosenzweig, 2010), as well as the role of information
on the returns to investments, such as schooling (Jensen, 2010). In examples specific to
energy, high-frequency information on residential electricity usage has been shown to affect
consumer price elasticity (Jessoe and Rapson, 2014) and simple information campaigns can
impact clean fuel adoption (Afridi et al., 2021). Further, like the digital tool utilized in this
intervention, other digital technologies have provided important information channels to a
variety of small businesses, such as in the fisheries (Jensen, 2007) and agricultural sectors
(Fabregas et al., 2019).
Additionally, this study contributes to our understanding of the barriers to solar adop-
tion in developing countries. By exploring information constraints, this study complements
existing evidence on the low take-up of decentralized solar (Burgess et al., 2020; Lee et al.,
2016). We do not detect a large effect on solar adoption (although we cannot rule out an
effect), but we do observe a large increase in intent to adopt. While the drop-off in actual
adoption may be explained by the pandemic-related lockdown, credit barriers may remain a
significant deterrent.
The paper proceeds as follows: Section 2 provides some background to electrification
in India, and the market for solar home products. Section 3 describes the intervention and
data collected, while Section 4 presents results. Section 5 concludes.
52 Background
In this section, we provide background on the electricity sector in India, specifically gaps
in electrification and reliable service delivery, which provide a role for off-grid solar to fill.
We then provide a framework for conceptualizing the barriers to solar adoption in the study
context.
2.1 Electrification in India
Official government sources characterize all three states in our study as having 100% elec-
trification (Ministry of Power, India); however, large numbers from our study sample report
having no connection to the national grid.3 Those who are grid connected often face un-
reliable power supplies. More than 40% of the surveyed subjects report outages of at least
3 hours in the summer. Additionally, 13% of the sample report being dissatisfied (or very
dissatisfied) with the reliability of the grid’s power supply. In such settings, off-grid sources
of electricity, such as rooftop solar, can fill a gap by smoothing consumption during grid
outages.
The Government of India set a target of 40 GW to be achieved through the deployment
of decentralized rooftop systems, particularly in rural areas (Government of India, 2015).
As of 2018, only 14% of the total solar installed was from these rooftop systems (Gulia and
Garg, 2020). Since then, uptake of solar has remained relatively low. A number of private
actors have entered the market to independently supply households and businesses with
decentralized off-grid solar; our partner firm is one such company.
2.2 Conceptual Framework: Barriers to Solar Adoption
Prior to the information intervention, the partner solar company had addressed credit barri-
ers to adoption by implementing a pay-as-you-go purchase model. Through prior consumer
3 InBihar and Uttar Pradesh a portion of our study sample – 9% and 13%, respectively – report not being connected to the
electricity grid. At 1%, the portion in Odisha is much smaller.
6segmentation surveys and customer interviews, the solar company determined that limited
information on the returns to rooftop solar – and the potential for sales agents to use these in-
formation asymmetries to their advantage – remained a substantial barrier to adoption.
There are both financial and non-financial returns to adopting the solar rooftop system.
A lot of these returns depend on the number and type of appliances that can be powered by
the solar product, as that determines the types of services potentially consumed. Examples
of services consumed include lighting, cooking (kettles, electric cookers), cooling (fans), and
entertainment (televisions, radios).4 Solar products vary in the extent to which they may
power these appliances. When faced with the purchase of a solar rooftop system, potential
consumers may have incomplete information as to which of these services can be powered by
different solar products. Additionally, potential customers may not be aware that a rooftop
solar panel in conjunction with a battery could smooth their electricity consumption when
a grid outage occurs. As a result, potential consumers may lack sufficient information to
invest in a solar product that provides power sufficient for their homes’ needs.
With incomplete information, the returns to the solar technology may be uncertain to
potential buyers even after interacting with a sales agent. The sales agents may provide
accurate information, yet the potential customer may not trust or believe the information
provided by them. Alternatively, the sales agent may provide incorrect information due to
their own misunderstanding or due to incentives to either upsell to a more expensive solar
product beyond the potential customers’ needs or to overstates the services feasibly provided
by a given solar product.
3 Randomized Experiment with Sales Agents
In the sub-sections that follow, we explain the randomized experiment that was designed to
address information constraints, detail the data collection processes, and provide results of
4 Non-financial returns include e.g. improved social status in one’s community from adopting the solar technology
7balance tests using those data.
3.1 Intervention and Experimental Design
In collaboration with the solar company, a mobile application, the Sales Support App (SSA
or simply, app), was developed using past sales data and pre-experiment surveys of prior
customers. The aim of this app was two-fold: first, to provide consumers with accurate
information on the solar products and how they each meet different energy needs and, second,
to build customers’ confidence in the information provided by the sales agent.
The app and the tablets are relatively low cost and simple for sales agents to use. The
app guides sales agents through a questionnaire to collect information from consumers, after
which they are presented with images and information on appropriate solar products. This
process of both collecting and providing information is detailed in Figure 1.
Figure 1: Description of data collection with app
Note: The flowchart above describes how the app guides the interaction between the sales agent and the customer.
After collecting bits of information, the app makes various recommendations on how to categorize the consumer in
terms of their electricity usage, financial capabilities and finally a list of appropriate products with their details.
8Further, images of application screen examples through which either information is
collected or provision are also shown in Figures 2(b) and 2(a), respectively.
Figure 2: Examples of information collected and provided by the mobile application
((a)) Information collected ((b)) Information provided
Note: These images are screenshots from the mobile app. The left panel shows the kinds of questions that sales
agents ask of respondents, while the right hand side panel is an example of a recommendation made by the app
The intervention was designed to isolate the effect of information. First, in order to
avoid conflating the treatment app’s impact with the potential prestige of having a tablet,
a parallel control app, with only the old basic product catalog, was also developed and
loaded onto tablets for sales agents in the control group to use. Second, in order to avoid the
treatment sales agents targeting systematically different potential customers, both treatment
and control sales agents continued to follow the company’s sales model that was in place
9long before the intervention, approaching potential customers from a list generated by the
company’s network of local village contacts (called an “urja mitra”).
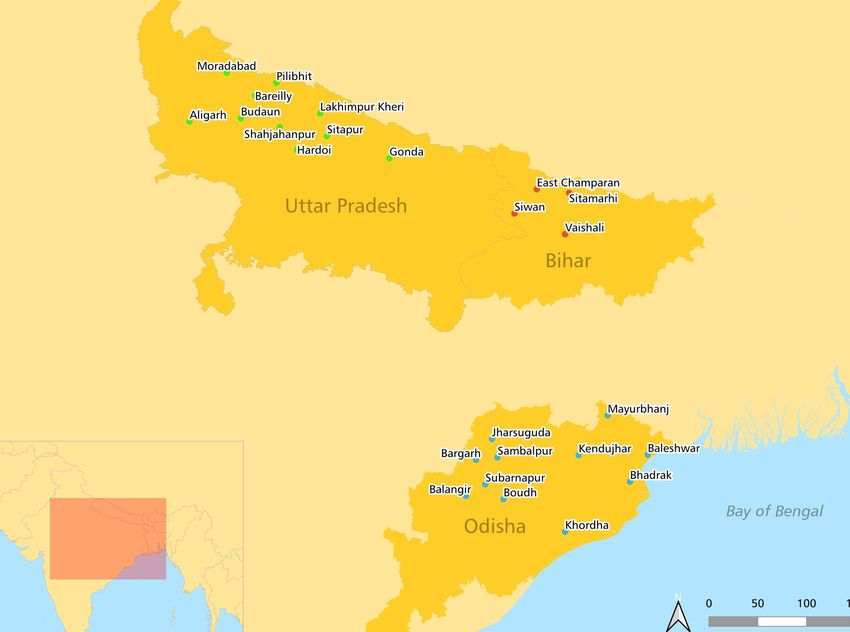
The randomized experiment was implemented in 25 districts across the three states of
Bihar, Odisha, and Uttar Pradesh (shown in Appendix Figure A.1). Within these states, the
74 census blocks in which the company was operating were randomly assigned to treatment
and control groups. The sales agents operating in treatment group census blocks received
a tablet with the SSA and the training required to use it. The sales agents operating
in control group census blocks were provided access to the Control app and were trained
separately.
The training of sales agents began in February 2020, with interruptions due to India’s
rapidly developing COVID-19 travel restrictions. Lock-downs affecting company staff move-
ment both interrupted training and decreased the number of potential customers that the
sales agents could approach, thereby reducing our study sample. This was particularly the
case in Bihar and Uttar Pradesh, where lockdown restrictions were more strict than Odisha.
Although the app was designed for sales agents to approach consumers in person, in a few
cases, due to lockdown restrictions, the first approach was by phone. This was possible given
the customer contact lists generated locally by the urja mitras.
3.2 Data
There are three sources of data used for the analyses in this paper: data collected from the
solar company, those available via the 2011 Indian Population Census, and those collected
through our baseline and follow-up surveys. The solar company’s data included informa-
tion on sales agents such as their assigned sales territory (census block). The 2011 Indian
Population Census data provide baseline information at the census block level, such as the
population as well as their educational attainment.
We implement both baseline and follow-up surveys for this study. A baseline survey was
10conducted in June 2020 by telephone to assess existing customers’ take-up and satisfaction
with both the sales process and the solar product that they had purchased. This survey was
conducted with the company’s customers who had bought products prior to the intervention
between August 2019 to January 2020. A total of 2246 consumers were surveyed, with 1185
in the subsequent treatment census blocks, and 1061 in the control census blocks, across the
states of Uttar Pradesh, Bihar and Odisha.
For the endline, we surveyed customers approached by the treatment and control sales
agents following the start of intervention, between February and October 2020. In total,
1539 potential customers were surveyed, comprised of 856 customers from 40 control blocks
and 683 potential customers from 34 treatment blocks. The two surveys examined different
respondents, creating a stacked panel. The treatment and control block assignments stayed
consistent across the surveys and the experiment. The proportion of potential customers
surveyed across evaluation groups was similar to the proportion of potential customers ap-
proached using the SSA and the Control app. Approximately 73% of the surveyed sample
was from the state of Odisha, followed by 15% and 12% from the states of Bihar and Uttar
Pradesh, respectively. The distribution of surveys across states was driven by differences in
the COVID restrictions across states, which impacts the extent to which sales agents were
able to approach potential customers during the study period.
3.3 Baseline Balance Checks
We test for baseline balance across treatment and control census blocks using a combination
of data from the baseline and endline surveys and the 2011 Indian Population Census. Table
1 presents these results. We do not find any statistically significant baseline differences
between our treatment and control groups. These baseline figures however do provide a
sense of the population we are studying. Approximately one-third of our subjects own some
form of electricity backup to account for outages, while about three-quarters are connected
to the electrical grid. In terms of income, the respondents are not amongst the poorest
11populations, with over $3000 in annual income. Further, the sample is well educated, with
over half reporting higher education, while under 1-2% report only primary or below primary
education.
Table 1: Balance of characteristics across treatment and control blocks
Panel A: Baseline Survey
(1) (2) (3)
Variable Control Treatment Difference
Own backup 0.36 0.39 0.03
(0.48) (0.49) (0.11)
Connected to grid 0.79 0.77 -0.02
(0.41) (0.42) (0.28)
% of residential customers 0.78 0.80 0.02
(0.42) (0.40) (0.18)
% of enterprise customers 0.22 0.20 -0.02
(0.42) (0.40) (0.18)
Income (Rs.) 211,450.00 229,166.83 17,716.83
(230,353.52) (294,800.03) (0.18)
Correctness of info. from agent 0.87 0.86 -0.00
(0.34) (0.34) (0.80)
Happy with purchase 0.87 0.86 -0.01
(0.34) (0.35) (0.35)
Buyer understood features 0.73 0.76 0.03
(0.44) (0.43) (0.16)
Agent product knowledge 0.89 0.89 -0.00
(0.31) (0.31) (0.91)
Observations 1,061 1,185 2,246
Panel B: Population Census
(1) (2) (3)
Variable Control Treatment Difference
Share of female pop. 0.49 0.49 0.00
(0.01) (0.01) (0.55)
Education: primary or below 0.02 0.01 -0.01
(0.12) (0.09) (0.24)
Higher education 0.58 0.60 0.02
(0.49) (0.49) (0.36)
Observations 856 683 1,539
Notes: We do not find any economically or statistically significant differences in characteristics of households across
treatment and control groups. The above variables are sourced from the baseline and endline surveys, and the last Indian
Population Census of 2011 for the relevant blocks. The baseline survey shows results from consumer experiences with sales
agents in treatment and control blocks before the use of tables and the treatment application.
124 Analysis and Results
In this section, we present the regression specifications employed, followed by the results.
4.1 Regression Specification
To measure the effect of the treatment on potential customers’ perception of agent profes-
sionalism and product knowledge, the potential consumers’ own knowledge and assessment
of the suitability of the product recommendation, and whether they report intending to pur-
chase a solar product or have made any actual purchase in the short-run, we estimate the
following regression:
Yavb = β T reatmentvb + avb , (1)
in which T reatmentvb is an indicator variable for potential customer a in village v and
block b that equals 1 if the customer is located in a treated census block in which the sales
agent was assigned to receive the SSA and equals 0 if located within a control census block.
We interpret the coefficient on the treatment variable as an Intent-to-Treat (ITT) estimate,
as sales agents may not comply with treatment.
A characteristic of the COVID lockdown in India was restricted movement across vil-
lages within blocks. For this reason, there is likely limited correlation between outcomes
across villages within a block. Clustering standard errors at the village level, therefore, is
a reasonable choice in presenting our regression results, following the discussion in Abadie
et al. (2017). Nevertheless, given randomization was at the block level, we also report block
level clustered standard errors. In most cases, the results are the same or less than village
level clustered estimates.
134.2 Experimental Results
Tables 2 and 3 present the estimated impacts of the informational tool, with the former
including impacts on the perceived professionalism of sales agents, their knowledge on solar
products, and the knowledge that potential consumers gained from interacting with sales
agents. The latter table presents impacts on outcomes such as take-up and intention to
adopt the solar products.
We first examine whether the tool indeed decreased information gaps. Table 2 presents
the informational tool’s estimated impact on consumer perceptions. We find a significant
increase in the perceived knowledge (Column 1) and professionalism (Column 2) of sales
agents. Perhaps most importantly, the app led to greater product knowledge among poten-
tial customers (Column 3). The treatment, however, did not significantly affect potential
customers’ perception regarding the product suitability (Column 4).
Table 2: Impact of intervention on knowledge and perceptions
(1) (2) (3) (4)
Agent product Agent Buyer product Product
knowledge professionalism knowledge Suitability
β / SE β / SE β / SE β / SE
Treatment 0.027*** 0.030*** 0.031*** 0.017
(0.008) (0.008) (0.009) (0.015)
Constant 0.966*** 0.966*** 0.955*** 0.926***
(0.005) (0.005) (0.006) (0.010)
Observations 1396 1399 1396 1110
SE (Block clustered) 0.006 0.006 0.009 0.018
Notes: This table presents Intent-to-Treat (ITT) results from the main estimating equation of the effect of the informational
tool on various outcomes. Standard errors are clustered at the village level. The bottom row also presents standard errors
clustered at block the level for the treatment variable. *Significant at 10%, **Significant at 5%, ***Significant at 1%.
Next, Table 3 presents insights as to whether the greater knowledge led to changes in
adoption or planned adoption, which are revealed and stated preference measures of demand,
respectively. Column 1 indicates that the informational mobile application loaded on the
tablet increased take-up or strong interest (pooled together) in buying a solar home-system
14Table 3: Impact of informational tool on indicators of adoption
(1) (2) (3)
Adoption or Interest Adoption Interest in purchasing
in Solar of Solar after COVID lockdown
β / SE β / SE β / SE
Treatment 0.069** 0.010 0.060**
(0.030) (0.015) (0.029)
Constant 0.487*** 0.090*** 0.397***
(0.020) (0.010) (0.019)
Observations 1539 1539 1539
SE (Block clustered) 0.061 0.021 0.059
Notes: This table presents Intent-to-Treat (ITT) results from the main estimating equation of the effect of the informational
tool on various outcomes. Standard errors are clustered at the village level. The bottom row also presents standard errors
clustered at block the level for the treatment variable. *Significant at 10%, **Significant at 5%, ***Significant at 1%.
in the near future by almost 7 percentage points over a baseline of 49%. Breaking this apart
and analyzing the two measures separately, we find an effect on actual adoption to be only
a 1 percentage point or 11% increase that is not statistically significant (Column 2). The
treatment did lead to a statistically significant 6 percentage point increase in the probability
that a potential customer reports a strong interest in purchasing the solar technology at a
later date, after the COVID lockdown ends (Column 3).
We consider this last measure – the intent-to-adopt outcome – to be particularly rel-
evant for our study for multiple reasons. Our pre-intervention studies indicated that 46%
of potential customers reporting a strong interest in purchasing a solar product, eventually
went on to do so. However, even before 2020, sales agents typically would visit potential
customers multiple times before a sale. With COVID-19 reducing incomes in the short-term
and related lockdown restrictions limiting movement, it is reasonable that the sales process
would take longer than the short-run time period of our study.
Lastly, in an effort to better understand the potential mechanisms through which the
impacts occurred, we investigate potential heterogeneous treatment effects. Results are in
Table 4. We find no large differences in rates of purchase or intent to purchase the solar
products across a number of factors, such as respondents’ own grid connection (Column
151), their ownership of either backup generation sources (Column 2), or across firms versus
households (Column 3). However, these figures are suggestive of the fact that the demand
for solar is not driven by people who do not have grid access or do not own backup energy
sources: in fact, these groups adopt solar to an equal degree. Finally, we find that households
and firms also adopt solar products at similar rates.
Table 4: Heterogeneous impact of informational tool on purchase decision or interest in
future purchase (ITT Results)
Purchase/Intent Purchase/Intent Purchase/Intent
(1) (2) (3)
Heterogeneity Heterogeneity Heterogeneity
1=Grid Connection 1=Own backup 1=Household
0=No 0=No 0=Firm
β / SE β / SE β / SE
Treatment 0.067 0.063* 0.002
(0.141) (0.034) (0.088)
Treat X Heterogeneity 0.004 0.011 0.067
(0.143) (0.053) (0.090)
Heterogeneity -0.118 0.032 0.072
(0.084) (0.037) (0.055)
Constant 0.600*** 0.474*** 0.426***
(0.083) (0.022) (0.054)
R2 0.01 0.01 0.01
Observations 1528 1528 1539
Notes: This table presents Intent-to-Treat (ITT) results from the main estimating equation of the effect of the informational
tool on various outcomes. Standard errors are clustered at the village level. The bottom row also presents standard errors
clustered at block the level for the treatment variable. *Significant at 10%, **Significant at 5%, ***Significant at 1%.
4.3 Discussion
To better understand the gap between the stated and revealed preference measures, we
analyze responses to a survey question asking potential customers for reasons as to why they
had not adopted yet adopted the solar rooftop system. Results are presented in Table 5.
We find that 68% of households are reporting financial constraints, either inability to afford
the payment (18%) or general lack of funds (49%) as the main reason that they have not
adopted a rooftop solar product. Only 22% of respondents report that the solar products
16offered do not fit their preferences or meet their energy needs. Another 6% of respondents
report that electricity or these products are not a priority or are not expected to provide
them with much value.
Table 5: Why did respondents not adopt solar rooftop systems?
Proportion of respondents
Financial constraints
Cannot afford the payment 0.18
Do not have the funds currently 0.49
Different preferences or needs
Products do not meet my energy requirement 0.03
I want to run heavier equipment like refrigerator, cooler, TV 0.01
Other company has cheaper solar products 0.02
Prefer other electricity back up sources 0.16
Low priority or value
None of these products add any incremental value to my life 0.04
Expenditure on electricity is not a priority 0.02
Other 0.06
Observations 1393
Notes: This table presents descriptive evidence from the endline survey conducted on respondents from both the control and
treatment groups in our sample.
We interpret the persistence of financial constraints reported in these results and the
difference between the stated intent-to-purchase measure and the actual purchase numbers
is likely the result of the COVID-19 shock on labor mobility and income in the study regions.
The COVID-19 induced lockdown severely affected mobility across states and villages. Mil-
lions of the workforce were rendered unemployed due to the halting of infrastructure and
manufacturing activities leading to unavailability of both skilled and unskilled jobs, closure
of shops and services and disruptions in the supply chain. Approximately 85% of the solar
company’s customers surveyed reported a fall in their incomes. Almost 70% of customers
report a loss of 50% or more due to the COVID-19 induced restrictions. These dramatic
declines were exacerbated for firms and enterprises with 93-96% of enterprise customers
reported decreases in income.
175 Conclusion
We contribute to a burgeoning literature studying the demand for off-grid energy in de-
veloping counties that are either without universal grid access or where electricity service
quality is poor. In India, as well as other countries, solar mini-grids and home-systems
are touted for their potential to address energy gaps. But, adoption of these technologies
remains low.
We investigate the potential to alleviate information constraints, which may be one of
the large barriers to solar adoption. To some extent, alleviating the information constraints
showed promise. The greater perceived degree of professionalism and knowledge of the
treated sales agents, relative to the control agents, matters for the adoption of this technology.
Additionally, by presenting a set of products customized to the household’s energy needs,
the app improved the potential customer perception of the sales agents themselves, and by
extension, the products.
We find that relaxing such constraints increases intent-to-adopt, our stated preference
measure of demand. It is possible that such an information intervention could also increase
actual purchases. We did not find significant effects on this revealed preference measure dur-
ing the short-run period of our study; however, given the number of sales visits and length
of time typically required for purchases of roof-top solar to be completed, it is quite plau-
sible that sales are impacted in the longer-run. Further, this difference between our stated
and revealed preference measures also may be indicative that income and credit constraints
remain a main barrier to solar adoption, particularly as the COVID-19 pandemic continued
to interrupt labor mobility and earnings.
18References
Abadie, A., Athey, S., Imbens, G. W., and Wooldridge, J. (2017). When should you adjust
standard errors for clustering? Working Paper 24003, National Bureau of Economic
Research.
Afridi, F., Debnath, S., and Somanathan, E. (2021). A Breath of Fresh Air: Raising Aware-
ness for Clean Fuel Adoption. Journal of Development Economics, 151:102674.
Aker, J. C. and Jack, K. (2021). Harvesting the Rain: The Adoption of Environmental
Technologies in the Sahel. SSRN Electronic Journal.
Ashraf, N., Jack, B. K., and Kamenica, E. (2013). Information and subsidies: Comple-
ments or substitutes? Journal of Economic Behavior & Organization, 88:133–139. Asian
Institutional Economics.
Burgess, R., Greenstone, M., Ryan, N., and Sudarshan, A. (2020). Demand for Electricity
on the Global Electrification Frontier. Cowles Foundation Discussion Paper No. 2222.
Chaudhary, J. (2018). Incentives for rooftop solar can light up homes cheaply. India Climate
Dialogue.
Fabregas, R., Kremer, M., and Schilbach, F. (2019). Realizing the potential of digital devel-
opment: The case of agricultural advice. Science, 366(6471):eaay3038.
Foster, A. D. and Rosenzweig, M. R. (2010). Microeconomics of Technology Adoption.
Annual Review of Economics, 2(1):395–424.
Gertler, P. J., Shelef, O., Wolfram, C. D., and Fuchs, A. (2016). The Demand for Energy-
using Assets among the World’s Rising Middle Classes. American Economic Review,
106(6):1366–1401.
Girardeau, H., Oberholzer, A., and Pattanayak, S. K. (2021). The enabling environment
for household solar adoption: A systematic review. World Development Perspectives,
21:100290.
Government of India (2015). Report of the Expert Group on 175 GW RE by 2022. Technical
report, NITI Aayog.
19Government of India (2018). Guidelines of Off-grid and Decentralized Solar PV Applications
Programme –Phase III. Ministry of New and Renewable Energy.
Grimm, M., Lenz, L., Peters, J., and Sievert, M. (2020). Demand for Off-Grid Solar Electric-
ity: Experimental Evidence from Rwanda. Journal of the Association of Environmental
and Resource Economists, 7(3):38.
Gulia, J. and Garg, V. (2020). Powering Up Sunshine – Untapped Opportunities in India’s
Rooftop Solar Market. Technical report, Institute for Energy Economics and Finance
Analysis.
Jensen, R. (2007). The Digital Provide: Information (Technology), Market Performance,
and Welfare in the South Indian Fisheries Sector. The Quarterly Journal of Economics,
122(3):879–924.
Jensen, R. (2010). The (Perceived) Returns to Education and the Demand for Schooling * .
Quarterly Journal of Economics, 125(2):515–548.
Jessoe, K. and Rapson, D. (2014). Knowledge is (Less) Power: Experimental Evidence from
Residential Energy Use. American Economic Review, 104(4):1417–1438.
Lee, K., Miguel, E., and Wolfram, C. (2016). Appliance Ownership and Aspirations among
Electric Grid and Home Solar Households in Rural Kenya. American Economic Review,
106(5):89–94.
Pargal, S. and Banerjee, S. G. (2014). More Power to India : The Challenge of Electricity
Distribution. The World Bank.
Rom, A. and Günther, I. (2019). Decreasing Emissions by Increasing Energy Access? Evi-
dence from a Randomized Field Experiment on Off-Grid Solar.
Sambodhi Research (2018). Simpa - Consumer Segmentation Study: Study for Segmentation
of solar rooftop users in India. Technical report.
Sharma, A., Agrawal, S., and Urpelainen, J. (2020). The adoption and use of solar mini-grids
in grid-electrified Indian villages. Energy for Sustainable Development, 55:139–150.
20Sievert, M. and Steinbuks, J. (2020). Willingness to pay for electricity access in extreme
poverty: Evidence from sub-Saharan Africa. World Development, 128:104859.
Trivedi, S., Ray, I., Vulturius, G., Goldar, A., Jena, L. P., Paul, S., and Sagar, A. (2017).
Scaling up Rooftop Solar Power in India: The Potential of Solar Municipal Bonds. Climate
Policy Initiative (CPI), New Delhi, Stockholm Environment Institute (SEI), Stockholm,
Indian Council for Research on International Economic Relations (ICRIER), New Delhi.
World Bank (2020). Off-Grid Solar: Market Trends Report 2020. Technical report.
Zhang, F. (2019). In the Dark: How Much do Power Sector Distortions Cost South Asia?
South Asia Development Forum.
21A Appendix
A.1 Map of Study Area: Uttar Pradesh, Bihar and Odisha
Note: The above map shows the three states, as well as districts covered by our study area.
22You can also read