Reimagine Repurpose Resource - May 2021 Corporate Presentation - Hemisphere Energy
←
→
Page content transcription
If your browser does not render page correctly, please read the page content below

Reimagine
Repurpose
Resource
May 2021
Corporate Presentation

 TSX-V: HME
 OTCQX: HMENF            1
Hemisphere is a growing energy company

   We reimagine technical solutions to
 repurpose assets in the energy industry,
 building value and wealth from resources

TSX-V: HME
OTCQX: HMENF                                2
The Hemisphere Strategy:
Core Principles

      Simple                Clean               Profitable              Unique

› One core area        › Minimal             › Low cost operations   › Active share
 with two oil pools     decommissioning       and high free funds     buyback program
                        liabilities           flow yield
› Large oil-in-place                                                 › Approaching low
 with low recovery     › Low environmental   › Top-tier reserve       debt/debt-free
 to date                footprint             value/boe               operation

TSX-V: HME
OTCQX: HMENF                                                                             3
Corporate Overview

         TSX Venture Listing (Canada)                                                 HME
         OTCQX Listing (USA)                                                        HMENF

         Share Price (TSX) (May 18, 2021)                                            $0.55

         Insider Ownership (Basic / Fully Diluted)                                 13% / 28%

         Basic Shares Outstanding                                                  88 million

         Fully Diluted Shares Outstanding                                          108 million

         Market Cap                                                                $48 million

         Enterprise Value(1)                                                       $69 million

TSX-V: HME        (1)   Based on net debt of $21.1 million as of March 31, 2021.
OTCQX: HMENF                                                                                     4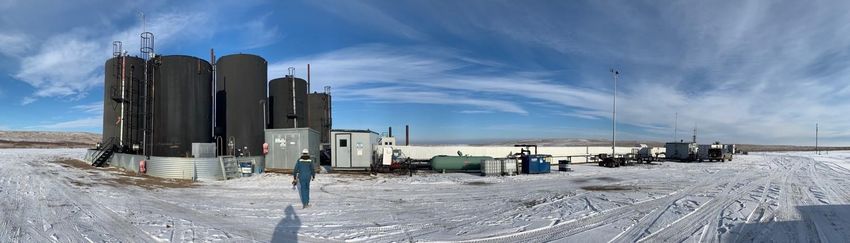
Concentrated Canadian Oil Resource

2020 Year End Reserves(1)
Proved + Probable (TPP) NPV10 BT / Reserves                                                                   $211 MM / 14.9 Mmboe

Proved (TP) NPV10 BT / Reserves                                                                               $170 MM / 11.7 MMboe

Proved Developed Producing (PDP) NPV10 BT / Reserves                                                             $81 MM / 4.2 Mmboe

Corporate Production                                                                                                  ~1,800 boe/d
(Apr 1-May 16 field estimate)                                                                                                   (99% heavy oil)

Abandonment, Decommissioning &
Reclamation Costs (ADR)(2)                                                                                       $8 MM / $1.9 MM
(unescalated and undiscounted / escalated at 2%/yr and discounted 10%)

Liability Management Rating (LMR)                                                                                                  9.92                                                                                           Atlee
Ratio of deemed assets (production) to deemed liabilities (abandonment & reclamation costs)                       (Within top 7% of Alberta Companies)
                                                                                                                                                                                                             Calgary
                                                                                                                                                                                                                                 Buffalo

                                                                                                                                                                                                                             Medicine
                                                                                                                                                                                                                                  Hat

                            (1)    Reserve volumes and Net Present Values are as attributed by McDaniel & Associates Consultants Ltd, discounted at 10% and before tax (NPV10 BT), in the independent reserve report prepared for Hemisphere in
                                   accordance with NI 51-101 effective as of December 31, 2020 and run at the Jan 1, 2021 3-Consultant Average Price (the “McDaniel Reserve Report"), and include all corporate abandonment, decommissioning, and
        TSX-V: HME                 reclamation estimates.
        OTCQX: HMENF                                                                                                                                                                                                                                5
                            (2)    100% of corporate ADR is included in the McDaniel Reserve Report.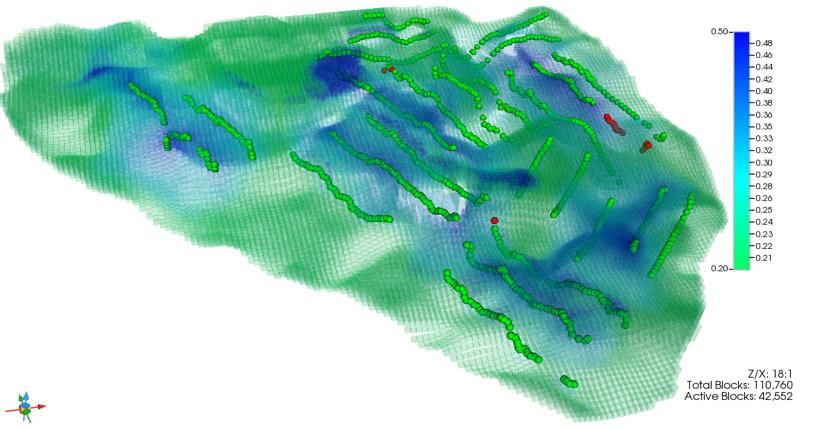
Q1 Results:
Leading the Pack …

                Q1 Corporate Production                                                                       1654 boe/d
                Q1 Revenue                                                                      $7.9 million / $53.00/boe
                Q1 Operating Field Netback                                                      $5.4 million / $36.26/boe
                Q1 Operating Netback (incl Hedges)                                              $5.3 million / $35.59/boe
                Q1 Adjusted Funds Flow (AFF)(1)                                                $4.0 million / $27.15/boe
                Q1 Net Debt(1)                                                                               $21.1 million
                Net Debt to Annualized Q1 AFF                                                                        1.3x

                 Q1 AFF per barrel ($/boe)                                                   Q1 Net Debt to Annualized Q1 AFF ($/boe)
30                                                                                  14

                 Peer group includes Canadian conventional oil-weighted public companies
                                                                                      12 with Q1 results released as of May 18, 2021 as follows:
25               ATH, BNE, BTE, CJ, CPG, ERF, GXE, IPCO, IPO, JOY, KEL, OBE, PPR, SGY, TVE, VET, WCP, YGR

                                                                                    10
20
                                                                           Median
                                                                                    8
15
                                                                                    6
10
                                                                                    4
                                                                                           Median
5                                                                                   2

0                                                                                   0
     HME                                                                                            HME
 TSX-V: HME            (1)       See Advisory Statements – Non-IFRS Measures.
 OTCQX: HMENF                                                                                                                                      6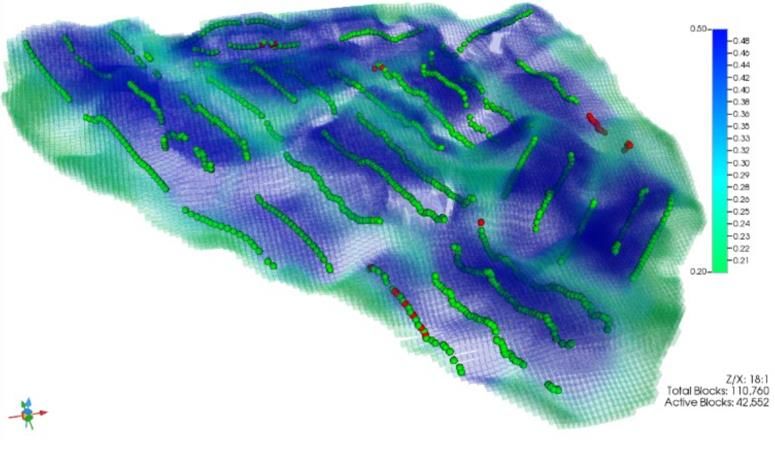
Q1 Results:
Leading the Pack … but Lagging in the Market

                                                              EV(1) to Annualized Q1 AFF (2) ($/boe)
       16

       14

       12

       10

         8

         6                                                                                                                                    Median

         4

         2

         0
                                                                                                                                        HME
               Peer group includes Canadian conventional oil-weighted public companies with Q1 results released as of May 18, 2021 as follows:
               ATH, BNE, BTE, CJ, CPG, ERF, GXE, IPCO, IPO, JOY, KEL, OBE, PPR, SGY, TVE, VET, WCP, YGR

TSX-V: HME             (1)       EV is calculated using Q1 net debt, current shares outstanding, and market price as of May 18, 2021.
OTCQX: HMENF                                                                                                                                           7
                       (2)       See Advisory Statements – Non-IFRS Measures.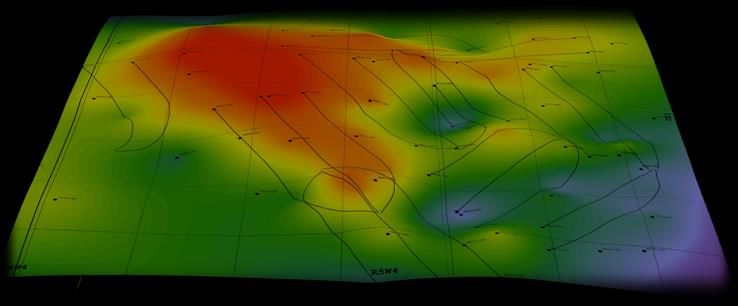
US$60/bbl WTI Guidance(1):
Near Term Growth & Debt Repayment

                                                                                          2021            2022

Average Annual Production                                                              1,900 boe/d     2,550 boe/d

Exit Production                                                                        2,200 boe/d     3,000 boe/d

Adjusted Funds Flow (AFF)(2)                                                           $19 million     $30 million
AFF per Basic Share(3)                                                                    $0.22/sh       $0.34/sh

Capital Expenditures                                                                    $6 million     $7 million

Free Funds Flow(2)                                                                     $13 million     $23 million

Exit Cash (Net Debt)(2)                                                                ($13 million)   $9 million

Exit Net Debt to AFF                                                                       0.7x             -

TSX-V: HME          (1)   See forecast details and assumptions on next slide.

OTCQX: HMENF
                    (2)   See Advisory Statements – Non-IFRS Measures.                                               8
                    (3)   Assuming 87.9 million basic shares issued and outstanding.
US$60/bbl WTI:
Revenue Breakdown(1)

                      2021: 1,900 boe/d                                                                                            2022: 2,550 boe/d

 Free Funds                                                   Royalties
                                                                                               Free Funds                                                                       Royalties
   Flow(2)                                                      17%                              Flow(2)                                                                          16%
    35%                                                                                           45%

                                                                         Opex                                                                                                              Opex
                                                                         19%                                                                                                               19%

               Capex
                16%                                       Hedging / G&A / Interest                                                Capex                                       Hedging / G&A / Interest
                                                                    13%                                                            13%                                                  7%

                (1)    Assuming US$60/bbl WTI for remainder of 2021 (Apr-Dec) and 2022 with WCS Differential of $US12/bbl, Fx of 1.265, and Average quality adjustment of Cdn$4.50/bbl; Royalties and GORRs of
                       17% and 16% (2021 and 2022), Opex and Transportation of $10.7/boe and $10.8/boe (2021 and 2022); Hedging losses of $0.6/boe and $0.5/boe (2021 and 2022) as per hedging program
                       outlined on slide 22; G&A costs of $3.5/boe and $2.5/boe (2021 and 2022); Loan Interest costs of $3.2/boe and $0.9/boe (2021 and 2022); Capex of $6 million and $7 million (2021 and 2022); and
TSX-V: HME             Free Funds Flow of $13 millions and $23 million (2021 and 2022) .
OTCQX: HMENF                                                                                                                                                                                                             9
                (2)    See Advisory Statements – Non-IFRS Measures.
High Free Funds Flow Yield and Production Growth:
Pricing Sensitivities(1)

                                                                                    WTI US$50/bbl(2)                           WTI US$60/bbl(3)                                 WTI US$70/bbl(4)
                                                                                    2021     2022                               2021    2022                                    2021     2022
           Exit Production                                 boe/d                    2,200                  3,000                 2,200                   3,000                   2,200                 3,000
   Adjusted Funds Flow (AFF)               (5)
                                                        $ million                      17                     23                  19                      30                        20                    36
         AFF per Basic Share         (6)
                                                            $/sh                     0.20                   0.26                 0.22                    0.34                     0.22                  0.40
               Free AFF   (5)
                                                        $ million                      11                     16                  13                      23                        14                    29
       Exit Cash (Net Debt)         (5)
                                                        $ million                     (15)                     0                 (13)                     9                        (13)                   15
        Exit Net Debt to AFF                                   x                     0.9x                       -                0.7x                      -                      0.6x                      -
        Free AFF / EV(7) Yield                                 %                       16                     23                  19                      33                        20                    42

                        Strong Balance Sheet = Financial Flexibility
                                › Debt repayment
                                › Accelerated internal projects
                                › Strategic acquisitions
                                › Return of capital - share buybacks and/or dividends

                  (1)       Assuming Flat WTI as per table for remainder of 2021 (Apr-Dec) and 2022 with WCS Differential of $US12/bbl, Fx of 1.265, and Average quality adjustment of Cdn$4.50/bbl; Opex and
                            Transportation of $10.7/boe and $10.8/boe (2021 and 2022); G&A costs of $3.5/boe and $2.5/boe (2021 and 2022); and Loan Interest costs of $3.2/boe and $0.9/boe (2021 and 2022).
                  (2)       Assuming Royalties and GORRs of 12% and 11% (2021 and 2022), and hedging losses of $(2.8)/boe and $0.4/boe (2021 and 2022) as per hedging program outlined on slide 22.
                  (3)       Assuming Royalties and GORRs of 17% and 16% (2021 and 2022), and hedging losses of $0.6/boe and $0.5/boe (2021 and 2022) as per hedging program outlined on slide 22.
                  (4)       Assuming Royalties and GORRs of 21% and 22% (2021 and 2022), and hedging losses of $5.0/boe and $1.5/boe (2021 and 2022) as per hedging program outlined on slide 22.
                  (5)       See Advisory Statements – Non-IFRS Measures.
TSX-V: HME        (6)       Assuming 87.9 million basic shares issued and outstanding.
OTCQX: HMENF      (7)       EV is calculated using Q1 net debt, current shares outstanding, and market price as of May 18, 2021.
                                                                                                                                                                                                                10
High Free Funds Flow Yield and Production Growth:
Peer Comparison
2021 Free AFF(1) / EV(2) Yield @ $60 WTI
40%
Free AFF / EV Yield
35%
FY21/Q121 Production Change
30% Free AFF / EV Yield (Median)
25%
20%
15%
Median
10%
5%
0%
HME
-5%
Peer group includes Canadian conventional oil-weighted public companies with 2021 full year guidance released by each company at $60 WTI as follows:
ATH, ATU, BNE, BTE, CJ, CPG, ERF, GXE, IPCO, IPO, JOY, KEL, OBE, TVE, VET, WCP, YGR
TSX-V: HME (1) See Advisory Statements – Non-IFRS Measures.
OTCQX: HMENF (2) EV is calculated using Q1 net debt, current shares outstanding, and market price as of May 18, 2021 11Reserves:
Third Party Audited Estimate of Future Cash Flow
Reserve Report Valuations(1)
› 2P $211 Million NPV10 BT
› 1P $170 Million NPV10 BT
› PDP $81 Million NPV10 BT
Significance of Reserve Comparisons
› The best comparison across the board of a companies’ assets and future cash flows
› Accounts for all existing and future decommissioning liabilities
› Accounts for all future development capital, operating & transportation costs, and royalties
› Conservative price forecast : 2021 WTI price of $47.17 and isn’t > $60 until 2029
Superior Metrics(2)
› 2-year average Proved Finding & Development (F&D) costs of $2.32/boe
› 2-year average Proved Recycle Ratio 11.6
› Proved Reserve Life Index (RLI) of 18.8 years
› Per barrel value of reserves in all categories is higher than our peer group of
Canadian conventional oil-weighted public companies (see next slide)
TSX-V: HME (1) McDaniel Reserve Report uses the 3-Consultant Average Price Forecast, which is is an average of the published price forecasts for McDaniel, GLJ Petroleum Consultants Ltd.,
OTCQX: HMENF
and Sproule Associates Ltd. at January 1, 2021. It uses a US$47/bbl WTI in 2021 with appreciation to US$56/bbl by 2025 (+2%/yr thereafter). 12
(2) As press released by Hemisphere on March 11, 2021.Top-Tier Oil Resource:
Best per Barrel Value of Reserves
Value per Barrel of Reserves(1) ($/boe)
20.00
18.00
16.00
HME’s value of reserves in
all categories is higher
14.00
than its oil-weighted peers
12.00
10.00
8.00
6.00
4.00
2.00
0.00
HME Peer group includes Canadian conventional oil-weighted public companies as follows:
ATH, ATU, BNE, BTE, CJ, CPG, ERF, GXE, IPCO, IPO, JOY, KEL, OBE, PPR, RZE, SGY, TVE, VET, WCP, YGR
PDP TP TPP
TSX-V: HME
OTCQX: HMENF 13
(1) Calculated by dividing NPV10 BT (Net Present Value of Future Net Revenues discounted at 10%, before tax) by Reserves, using 2020 audited reserve valuations as press released by each company.Exceptional Opportunity in the Market
Ratio of EV to Reserve Value(1)
3.5
3.0
Most peers are trading well
2.5 above PDP valuations with
the majority also trading
above TP valuations
2.0
1.5
1.0
0.5
0.0
Peer group includes Canadian conventional oil-weighted public companies as follows: HME
ATH, ATU, BNE, BTE, CJ, CPG, ERF, GXE, IPCO, IPO, JOY, KEL, OBE, PPR, RZE, SGY, TVE, VET, WCP, YGR
EV/PDP EV/TP EV/TPP
TSX-V: HME (1) Calculated using share price and outstanding shares as at May 18, 2021, and Q1 net debt as press released by each company, divided by 2020 audited reserve valuations of NPV10 BT
OTCQX: HMENF (Net Present Value of Future Net Revenues discounted at 10%, before tax), as press released by each company.
14Debt Adjusted Reserve Value / Share (Sensitivity)
$ / Basic Share(1)
$3.50 $3.28
$3.00 Recall from previous
slide that the majority of $2.66 $2.62
peers are trading above
$2.50
Total Proved valuations $2.17
$2.10
$2.00
$1.69
$1.50
$1.13
$1.00 $0.89
$0.68
$0.50 HME May 18/21 trading price: $0.55/share
$-
Proved Developed Total Proved ($MM) Proved plus Probable ($MM)
Producing ($MM)
3-Consultant Price Forecast $60 WTI $70 WTI
TSX-V: HME (1) Calculated using Hemisphere’s NPV10 BT (Net Present Value of Future Net Revenues discounted at 10% and before tax), taken from the McDaniel Reserve Report as at Dec 31, 2020 and run at the
OTCQX: HMENF
Jan 1, 2021 3-Consultant Price Forecast, as well as at sensitivities of US$60 WTI and US$70WTI flat pricing (each with WCS Differentials of US$12 and Fx of 1.265), minus year-end net debt of 15
$21.1MM, divided by 87.9 million basic shares outstanding.Our Resource:
Atlee Buffalo Core Area
2 Oil Pools ~84 MMbbl total oil in place(1)
› ~5% recovery to date between the pools
(Atlee Buffalo Upper Mannville F and G pools)
Low risk, highly lucrative EOR projects Hemisphere’s Atlee G Pool
› Excellent quality reservoirs delineated by vertical wells and 3D seismic Top reservoir structure
› Horizontal drills are only ~$800K/well and don’t require fracs due to high
permeability / productivity
› Existing facilities are easily expanded
Reserve Report currently recognizes polymer flood in one
of the two pools
› Reserve bookings reflect the impact of polymer flood for the G pool only,
as start-up is imminent in 2021
› F pool polymer flood conversion is under evaluation in 2021
TSX-V: HME
OTCQX: HMENF
(1) Based on McDaniel's reservoir mapping for the purposes of the McDaniel Reserve Report and are not indicative of actual reserve or resource volumes. 16
See Advisory Statements – Oil and Gas Information – OOIP.Development Plans
2021 Plans
› Convert G pool water flood to
polymer flood
› Drill 3 G pool wells
› Expand G pool facilities to handle increased
oil production
Before
› Evaluate and submit applications to AER for Polymer
F pool polymer flood conversion
2022 Plans
› Drill 3 additional G pool wells and continue
to optimize polymer flood
› Drill 4 F pool wells
› Move towards implementation of polymer
flood at F pool After
Polymer
TSX-V: HME
OTCQX: HMENF 17The Technical Advantage of Polymer Floods
Tried and True
› Proven method of enhanced oil recovery (EOR)
› Polymer is added to injection water to increase its viscosity (similar to olive oil)
› ‘Wall’ is built between water and oil to push more oil to producing wells without
water ‘streaking through’ reservoir
› Typically leads to:
Oil production
940 metres
Water production
Overall Oil Recovery
TSX-V: HME
OTCQX: HMENF 18An Exciting Change
Polymer flooding is successfully used in hundreds of oil pools
by companies around the world, including:
› Athabasca, Bankers Petroleum, Baytex, CNRL, BP, Caltex, Chevron, Enerplus, Hillcorp,
Husky, IPC, Whitecap and many others
Atlee G Pool Polymer Project is primed and ready
› Construction starts early Q2 2021
› First injection planned for late Q2
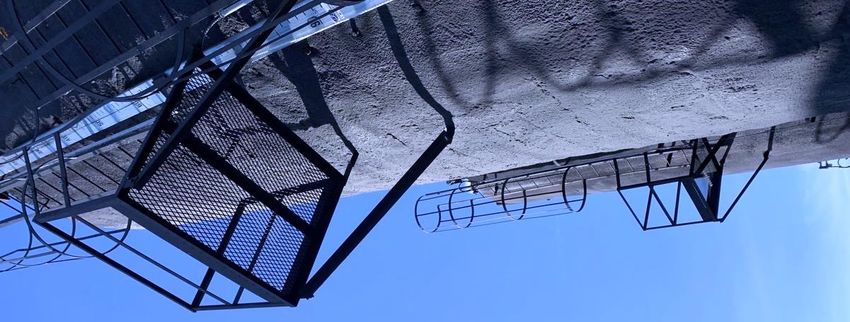
Hemisphere’s
Atlee, Alberta Facilities
TSX-V: HME
OTCQX: HMENF 19Environmental Social Governance:
Canadian Energy - Committed to the Highest Standards
Stakeholder value is built when we take care of the environment
› Low decommissioning liabilities
› No surface/fresh water used in EOR operations
› Natural gas power generation
› Pad drilling to reduce footprint
› Pipeline-connected field to reduce trucking
Aligned with our communities
› Hire local companies and support the people and businesses in our communities
› Build positive relationships with all stakeholders
Solid governance
› Safety of our employees and stakeholders is vital
› Culture of honesty, integrity, and accountability
TSX-V: HME
OTCQX: HMENF 20Leadership
MANAGEMENT BOARD OF DIRECTORS
Don Simmons, P.Geol. Charlie O’Sullivan, B.Sc. Chairman
President & Chief Executive Officer
Over 20 years of experience technical, operational and management
experience (Alberta Energy Company, Encana, Sebring)
Don Simmons, P.Geol.
Ian Duncan, P.Eng.
Chief Operating Officer
Frank Borowicz, QC, JP, CPA (Hon)
Over 17 years of experience which includes drilling, completions,
facilities, and operations (Talisman and Solaris MCI)
Bruce McIntyre, P.Geol.
Dorlyn Evancic, CPA, CGA
Chief Financial Officer
Over 30 years of experience in corporate finance and management
(Guyana Frontier, Northern Continental and Gemco Minerals)
Gregg Vernon, P.Eng.
Andrew Arthur, P.Geol. Richard Wyman, B.Sc., MBA
Vice President, Exploration
Over 30 years of experience with several hundred wells drilled across
the Western Canadian Sedimentary Basin (Enerplus, Mission, Talisman)
Ashley Ramsden-Wood, P.Eng.
Vice President, Engineering
Over 20 years of experience in reservoir engineering, capital planning,
and reserves evaluation (NAL, Petro-Canada)
TSX-V: HME
OTCQX: HMENF 21The Hemisphere Story:
Small Cap, Big Value
REIMAGINE REPURPOSE RESOURCE
Developing a simple, Breathing new life Maximizing recovery of
clean asset of exceptional into used equipment and our top-quality oil pools
profitability. conventional oil pools. using proven technology.
TSX-V: HME
OTCQX: HMENF 22TSXV: HME
OTCQX: HMENF
www.hemisphereenergy.ca
Don Simmons
(604) 638-6213
simmons@hemisphereenergy.ca
TSX-V: HME
OTCQX: HMENF 23APPENDIX TSX-V: HME OTCQX: HMENF 24
Risk Management:
     Protecting Cash Flow

    Hedging Considerations
            › Continually monitor WTI Oil and WCS Differential hedge pricing
            › Layer in protection for up to 18 months
            › Look for near term wellhead price protection and longer term
             floor protection

Product       Type       Volume                       Price                          Index                    Term
Crude oil     3-Way      625 bbl/d   US$40.00(put)/US$48.00(put)/US$60(call)      WTI-NYMEX         Apr 1, 2021 – Jun 30, 2021
Crude oil   Phys. Swap   400 bbl/d                  US$48.00                          WCS           Apr 1, 2021 – Jun 30, 2021
Crude oil     Swap       200 bbl/d                  US$11.15                     WCS Differential   May 1, 2021 – Jun 30, 2021
Crude oil   Phys. Swap   200 bbl/d                  US$46.05                          WCS            Jul 1, 2021 – Sep 30, 2021
Crude oil   Phys. Swap   200 bbl/d                  US$11.45                     WCS Differential    Jul 1, 2021 – Sep 30, 2021
Crude oil     Swap       100 bbl/d                  US$56.75                      WTI-NYMEX          Jul 1, 2021 – Sep 30, 2021
Crude oil     Swap       500 bbl/d                  US$60.07                      WTI-NYMEX          Jul 1, 2021 – Sep 30, 2021
Crude oil     Swap       200 bbl/d                  US$11.50                     WCS Differential    Jul 1, 2021 – Sep 30, 2021
Crude oil     Swap       100 bbl/d                  US$11.20                     WCS Differential    Jul 1, 2021 – Sep 30, 2021
Crude oil     Swap       100 bbl/d                  US$11.15                     WCS Differential    Jul 1, 2021 – Sep 30, 2021
Crude oil     Swap       800 bbl/d                  US$58.45                      WTI-NYMEX         Oct 31, 2021 – Dec 31, 2021
Crude oil     Swap       100 bbl/d                  US$12.50                     WCS Differential   Oct 31, 2021 – Dec 31, 2021
Crued oil     Swap       100 bbl/d                  US$12.00                     WCS Differential   Oct 31, 2021 – Dec 31, 2021
Crude oil     Swap       800 bbl/d                  US$57.03                      WTI-NYMEX         Jan 1, 2022 – Mar 31, 2022
Crude oil   Put Spread   725 bbl/d   US$30.00(put sell)/US$40.00(put buy), net    WTI-NYMEX         Apr 1, 2022 – Aug 31, 2022
                                                cost US$1.65/bbl

      TSX-V: HME
      OTCQX: HMENF                                                                                                                25
Selected Crude Oil Pipelines
Trans Mountain
Edmonton, AB
Vancouver, BC
HME Head Office Atlee Buffalo Mainline
Line 3 Replacement
Keystone XL
Express
Superior, WI
Casper, WY Keystone
HME trucks to Tilley and
sells to Montana Refineries Flanagan, IL
Steele City, NE
via Bow River System
Patoka, IL
Montana Refineries
Crushing, OK
Tilley Oil Terminal
Bow River System
Atlantic Ocean
St. James, LA
Nederland, TX
Freeport, TX
Gulf of Mexico
TSX-V: HME
OTCQX: HMENF 26Advisory Statements
Forward-Looking Information and Statements
This presentation contains certain forward–looking information and statements within the meaning of applicable securities laws. The use of any of the words "expect", "anticipate", "continue", "estimate", "may", "will", "project", "should",
"believe", "plans", "intends", "forecast", "potential" and similar expressions are intended to identify forward-looking information or statements. In particular, but without limiting the forgoing, this presentation contains forward-looking
information and statements pertaining to the following: the Company's plans to target low debt/debt-free operations, the Company's guidance for 2021 and 2022 as set forth in slides 6 through 8, the Company's development plans for its
assets in 2021 and 2022, including various enhanced oil recovery plans; the Company's business strategy and plans; the volumes and estimated value of the Company's oil and gas reserves; in place volume estimates in respect of the
Company's Atlee Buffalo Upper Mannville F and G pools; the volume and product mix of the Company's oil and gas production; production estimates and forecasts; future oil and natural gas prices and the Company's commodity risk
management programs; future liquidity and financial capacity; future results from operations and operating metrics; future development, exploration, acquisition and development activities, infrastructure plans and related capital
expenditures and the timing thereof; the total future capital associated with development of reserves and resources; and methods of funding our capital program. In addition, information and statements relating to reserves and contingent
resources are deemed to be forward‐looking statements, as they involve implied assessment, based on certain estimates and assumptions, that the reserves described exist in quantities predicted or estimated, and that they can be profitably
produced in the future.
Forward-looking statements or information are based on a number of material factors, expectations or assumptions of management which have been used to develop such statements and information but which may prove to be incorrect.
Although management believes that the expectations reflected in such forward-looking statements or information are reasonable, undue reliance should not be placed on forward-looking statements because management can give no
assurance that such expectations will prove to be correct. In addition to other factors and assumptions which may be identified herein, assumptions have been made regarding, among other things: the impact of increasing competition; the
general stability of the economic and political environment in which management operates; the timely receipt of any required regulatory approvals; the ability of the Company to obtain qualified staff, equipment and services in a timely and
cost efficient manner (including any disruptions or affects as a result of COVID-19); drilling and EOR results; the ability of the Company to obtain financing on acceptable terms including the continued availability of its credit facilities; field
production rates and decline rates; the ability to replace and expand oil and natural gas reserves through acquisition, development and exploration; risks associated with the degree of certainty in resource assessments; the Company will
realize the anticipated benefits of its enhanced oil recovery operations; the timing and cost of pipeline, storage and facility construction and expansion and the ability of the Company to secure adequate product transportation; future
commodity prices; currency, exchange and interest rates; regulatory framework regarding royalties, taxes and environmental matters in the jurisdictions in which the Company operates; and the ability of the Company to successfully market
its oil and natural gas products. There are a number of assumptions associated with the potential of resource in place volumes assigned to lands evaluated in the Company's area of operations, including the quality of the reservoir, future
drilling programs and the funding thereof, continued performance from existing wells and performance of new wells, the growth of infrastructure, well density per section and recovery factors and discovery and development of the lands
evaluated in such lands necessarily involves known and unknown risks and uncertainties, including those identified in this presentation.
The forward-looking information and statements included in this presentation are not guarantees of future performance and should not be unduly relied upon. Such information and statements; including the assumptions made in respect
thereof, involve known and unknown risks, uncertainties and other factors that may cause actual results or events to defer materially from those anticipated in such forward-looking information or statements including, without limitation:
changes in commodity prices; the potential for variation in the quality of its assets; changes in the demand for or supply of the Company's products; unanticipated operating results or production declines; changes in tax or environmental
laws, royalty rates or other regulatory matters; changes in development plans of the Company, increased debt levels or debt service requirements; inaccurate estimation of the Company's oil and gas reserve and resource volumes; limited,
unfavourable or a lack of access to capital markets; increased costs; a lack of inadequate insurance coverage; the impact of competitors, suspension of delays of operations as a result of COVID-19, or otherwise, activities by third party plant
turnaround times and continued ability to transport products, reserve volumes, business prospects and opportunities, the future trading price of the Company's shares, the availability and cost of financing, labor and services; the impact of
increasing competition; ability to market oil and natural gas successfully and the Company's ability to access capital (including its credit facility).
The forward-looking information and statements contained in this presentation speak only as of the date of this presentation, and the Company does not assume any obligation to publicly update or revise any of the included forward-looking
statements or information, whether as a result of new information, future events or otherwise, except as may be required by applicable securities laws.
This presentation, including in respect of Company's guidance for 2021 and 2022 as set forth under slides 6 and 7, may contain future oriented financial information ("FOFI") within the meaning of applicable securities laws. The FOFI has
been prepared by management to provide an outlook of the Company's activities and results. The FOFI has been prepared based on a number of assumptions including the assumptions discussed and disclosed in such slide and under the
heading "Forward-Looking Information and Statements". Management does not have firm commitments for all of the costs, expenditures, prices or other financial assumptions used to prepare the FOFI or assurance that such operating
results will be achieved and, accordingly, the complete financial effects of all of those costs, expenditures, prices and operating results are not objectively determinable. The actual results of operations of the Company and the resulting
financial results may vary from the amounts set forth in this presentation, and such variation may be material.
Non-IFRS Measures
References are made in this presentation to "Adjusted Funds Flow", "Adjusted Funds Flow per Basic Share", "Free Funds Flow", and "Net Debt", that are commonly used terms in the oil and natural gas industry, but do not have any
standardized meaning as prescribed by IFRS and therefore may not be comparable with the calculations of similar measures for other entities. Management believes that the presentation of these Non‐IFRS measures provide useful
information to shareholders as the measures provide increased transparency and the ability to better analyze performance. "Adjusted Funds Flow" is a measure that represents cash generated by operating activities, before changes in non-
cash working capital and adjusted for decommissioning expenditures, and may not be comparable to measures used by other companies. "Adjusted Funds Flow per Basic Share" is calculated using the outstanding basic shares of the
company as at the date of the presentation and noted herein. "Free Funds Flow" is a measure of "Adjusted Funds Flow" less capital expenditures. "Net debt" is used in this document in the context of liquidity and is calculated as the total of
the Company’s current assets less current liabilities, excluding the fair value of financial instruments, and including the gross term loan. The Company considers "Adjusted Funds Flow" and "Free Funds Flow" to be key measures that indicate
the Company’s ability to generate the funds necessary to support future growth through capital investment and to repay any debt, and "Net debt" is closely monitored by the Company to ensure that its capital structure is maintained by a
strong balance sheet to fund the future growth of the Company, however such metrics should not be unduly relied upon. Readers are cautioned that the information provided by these metrics, or that can be derived from the metrics
presented in this report should not be relied upon for investment or other purposes. See "Non-IFRS Measures" contained within the Company's MD&A for the year ended December 31, 2019 for applicable definitions, calculations, rationale for
use and reconciliations to the most directly comparable measure under IFRS. Non-IFRS measures should not be considered in isolation or as a substitute for measures prepared in accordance with IFRS.
TSX-V: HME
OTCQX: HMENF 27Advisory Statements
Information Regarding Disclosure on Oil and Gas Reserves, Resources and Metrics
Unless otherwise specified, all reserve and resource estimates disclosed in this presentation are derived from the Company's independent reserve evaluations (the "Reserve Evaluation"). The reserve and resource estimates contained herein
are estimates only and there is no guarantee that the estimated reserves or resources will be recovered. Actual oil, gas, and natural gas liquids reserves may be greater than or less than the estimates that are provided herein. In relation to
the disclosure of estimates for individual properties, such estimates may not reflect the same confidence level as estimates of reserves and future net revenue for all properties, due to the effects of aggregation. The Company's belief that it will
establish additional reserves over time with conversion of resources into reserves and probable undeveloped reserves into proved reserves are forward-looking statements and are based on certain assumptions and is subject to certain risks,
as discussed under the heading "Forward-Looking Information and Statements".
Net Present Values
It should not be assumed that the estimates of the future net revenues presented in this presentation represent the fair market value of the reserves. There is no assurance that the forecast prices and costs assumptions herein will be attained
and variances could be material.
OOIP
Original Oil-In-Place ("OOIP") is used by Hemisphere in this presentation as an equivalent to Discovered Petroleum Initially‐In‐Place ("DPIIP"). DPIIP, as defined in the Canadian Oil and Gas Evaluation Handbook, is that quantity of petroleum
that is estimated, as of a given date, to be contained in known accumulations prior to production. The recoverable portion of DPIIP includes production, reserves and contingent resources; the remaining portion of DPIIP is unrecoverable. It
should not be assumed that any portion of the OOIP/DPIIP set forth in this presentation is recoverable other than the portion which has been attributed reserves by McDaniel. There is uncertainty that it will be commercially viable to produce
any portion of the OOIP/DPIIP other than the portion that is attributed reserves. The OOIP/DPIIP set forth in this presentation has been provided for the sole purpose of highlighting the recovery factors for the reservoirs that have been
attributed reserves. The OOIP/DPIIP volumes disclosed in this presentation are from the mapping of the reservoirs by McDaniel (who is independent of Hemisphere) in connection with preparing the Reserve Evaluation. All OOIP/DPIIP
estimates set forth herein are provided as of December 31, 2020. There may be more specific sub-categories of such resources applicable to such estimates that would provide a more accurate description of the resources and the work
programs, technology and capital required to exploit such resources, but these have not been prepared by the Company. There are numerous risks and uncertainties associated with recovery of such resources, including many factors beyond
the Company's control. There is no certainty that any portion of the noted volumes or resources will be discovered. If discovered, there is no certainty that the Company will ultimately recover the estimated quantity of oil or gas from such
reserves, resources or wells nor that it will be commercially viable to produce any portion thereof.
BOE Equivalent
Natural gas and liquids reserves and volumes are converted to a common unit of measure on a basis of six Mcf of gas to one bbl of oil. Disclosure provided herein in respect of BOE may be misleading, particularly if used in isolation. A BOE
conversion ratio of 6 Mcf: 1bbl is based on an energy equivalency conversion method primarily applicable at the burner tip and does not represent a value equivalency at the well head. Given that the value ratio based on the current price of
crude oil as compared to natural gas is significantly different than the energy equivalency of 6:1, utilizing a 6:1 conversion basis may be misleading as an indication of value.
Third Party Information
Certain information contained herein is based on, or derived from, information provided by independent third-party sources. Management believes that such information is accurate and that the sources from which it has been obtained are
reliable; however, management is unable to independently verify such information. Readers are also cautioned that the management is, as a result, unable to determine or verify whether such information was prepared in accordance with NI
51-101 or the COGE Handbook.
TSX-V: HME
OTCQX: HMENF 28TSXV: HME
OTCQX: HMENF
www.hemisphereenergy.ca
Don Simmons
(604) 638-6213
simmons@hemisphereenergy.ca
TSX-V: HME
OTCQX: HMENF 29You can also read