Leejam Sports Company - Investor Presentation

Page created by Lois Garcia
 
CONTINUE READING
Leejam Sports Company - Investor Presentation
Leejam Sports Company
Investor Presentation

Q1 – 2021
Leejam Sports Company - Investor Presentation
DISCLAIMER
Leejam Sports Company makes no representation or warranty of any kind,
express, implied or statutory regarding this document or the materials and
information contained or referred to on each page associated with this
document. The material and information contained on this document is
provided for general information only and should not be used as a basis for
making business decisions. Any advice or information received via this
document should not be relied upon without consulting primary or more
accurate or more up-to-date sources of information or specific professional
advice. You are recommended to obtain such professional advice where
appropriate.

Leejam Sports Company accepts no liability and will not be liable for any loss or
damage arising directly or indirectly (including special, incidental or
consequential loss or damage) from your use of contents in the document,
howsoever arising, and including any loss, damage or expense arising from, but
not limited to, any defect, error, imperfection, fault, mistake or inaccuracy with
this document.

                                                                                2
Leejam Sports Company - Investor Presentation
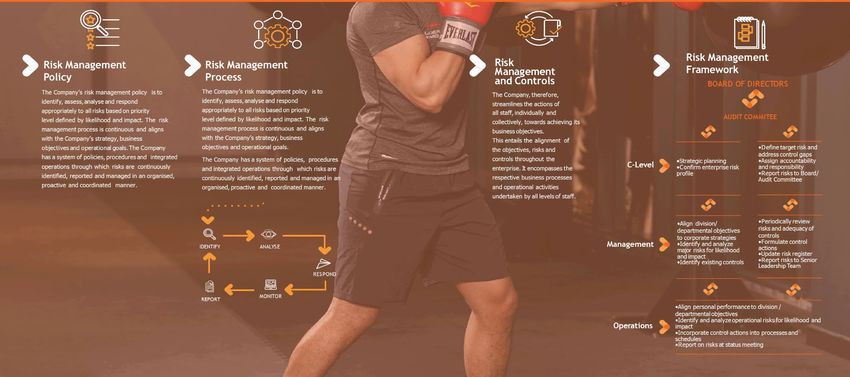
Leejam’s Profile &
Overview

Financial
Performance

STRATEGIC
REPORT

Outlook FY
2021

Q&A
Leejam Sports Company - Investor Presentation
Leejam’s Profile
& Overview
Leejam Sports Company - Investor Presentation
Our Vision
To be the people’s favourite and most accessible wellness club.

            Our Mission
            To steer society towards a healthy lifestyle and encourage people to
            exercise daily.

                                                   “More than just a gym”
                                                   From its humble beginnings, Leejam has continued in its
                                                   path of evolution, fast becoming the region’s largest
                                                   operator of sports and fitness centers. Under the tutelage
                                                   of the Company’s vibrant, dynamic, and energetic core of
                                                   key management personnel, with extensive experience in
                                                   the industry, Leejam has been able to further diversify its
                                                   offerings to create a so-called “One Stop Fitness Shop”,
                                                   offering state-of-the-art facilities for all users, leading
                                                   apparel lines and locations that people want to spend
                                                   time in, in all corners of the Country.

                                                   In addition, the leadership team pride themselves in
                                                   knowing that the evolution of the brand under their
                 Our Values                        guidance aligns directly with Saudi Arabia’s Vision 2030; to
                 •   Customer service excellence   get people exercising daily and to lead a healthier life.

                 •   Integrity

                 •   Responsibility

                 •   Collaboration

                 •   Innovation
                                                                                                             5
Leejam Sports Company - Investor Presentation
Leejam Brands

                                                       Leejam prides itself on its international and professional Fitness
                                                       Team, designed to make Fitness Time the gym of choice. Leejam
                                                       currently operates the following fitness brands:

          Situated in strategically selected
          locations to provide an accessible fitness
          centre to the fitness communities,all
          centres are equipped with the latest in
          state-of-the-art equipment and facilities
          and are complimented by the Company’s
          diverse range of offerings, through its
          tactically astute brand differentiation,
          incorporating choice offerings to suit
          every budget.

                                                                                                                            6
Leejam Sports Company - Investor Presentation
Key Highlights
— Operational & Financial
                                                                                                                                                       Q1 2020           Q1 2021
STATEMENTOF OPERATIONS DATA                 Q1 2021               Q1 2020                Change %

Revenue                                    SAR 149M               SAR 198M                    (25%)
                                                                                                                                                             FEMALE
Gross profit                                SAR 27M               SAR 52M                     (48%)                                                          Members
Operating Profit

EBITDA
                                            SAR 5M                SAR 21M                     (76%)                 250K                               57K                46K
                                            SAR 55M               SAR 71M                     (23%)    Total members at the end of Q1 2021
                                                                                                                        vs .
Net Profit (Loss)                           SAR (7)M                  SAR 6M                  (217%)        253K at the end of Q1 2020
Cash and cash equivalents                  SAR 227M               SAR 141M                     61%

                                                                                                                                                                          MALE
                                                                                                                                                                          Members

                                                                                                                      39
New
Partnerships
                                                                                                                                                       164K               157K
                                                                                                        Female Centers as of, March 2021

 New
 Products

                                                                                                            Corporate                                  135                131

                      37
                     STAFF & MEMBERS OF
                                                                                                                    December 2020
                                                                                                                                                         TOTAL CENTERS

                                          96%
                                                         74%                   66%
                                                                                                       180+                         47K
                                                                                                        Corporate               Corporate Members
                     DIFFERENT                                                            44%           Customers               32K as of March 2020
                     NATIONALITIES
                                                Jan-21                               Mar-21
                                                               Male     Female                                                                                                      7
Leejam Sports Company - Investor Presentation
Business Model

Leejam’s business model looks at the ways in
which the Company is able to generate value
for its stakeholders, along with the resources
used to achieve all strategic objectives.
These are built taking consideration towards
the Company’s vision to
be the people’s favourite and most
accessible wellness club,and the Company’s
mission to steer society towards a healthy
lifestyle and encourage people to exercise
daily.

                                                                                                                                                                      Inputs
                                                                                                                  ValueProposition
                                                               TheApproach
                                                                                                                                                              •   Finance
                                                                                                    •   Long term lease of land and construction of state-    •   Customer Service
                                                 •   Diligent and risk-based decision making
                                                                                                        of- the-art and technologically superior facilities   •   People
                                                 •   Customer centricity
                                                 •   Innovative and diverse range of products and   •   High value membership                                 •   Operational Efficiencies
                                                                                                    •   Strategic locations                                   •   Represented Brands
                                                     services tailored to meet customer needs
                                                                                                    •   Certified trainers and experts
                                                 •   Focus on quality and efficiency
                                                                                                    •   Brands catering to various KS A demographics
                                                                                                    •   Internationally certified training programs
                                                                                                    •   Provision of opportunities for women.

                                                                                                                                                                                             8
Leejam Sports Company - Investor Presentation
Business Model            (Continued)

                                                                                               The Facilities                 Leejam’s Value Creation
                                              Services and Features
                                                                                        •   Half Olympic Sized Pools
                                                                                        •   Jacuzzi                    •   Membership growth, retention and loyalty
                                          •   Cardio
                                                                                        •   Sauna                      •   Sustainable returns for shareholders
                                          •   Strength
                                                                                        •   Steam                      •   Steering society towards a healthy lifestyle
                                          •   Personal Training
                                                                                        •   Soccer, Basketball and     •   Consistency in increasing market share.
                                          •   CrossFit Style
                                                                                            Volleyball Courts
                                          •   High Intensity Interval Training (HIIT)
                                                                                        •   Squash
                                          •   Extreme Boxing
                                                                                        •   Lounges
                                          •   Swimming
                                                                                        •   Business centres
                                                                                        •   Showers
                                                                                        •   Lockers
                                                                                        •   Towels
                                                                                        •   Slippers

44 | LeejamSports Company
                                                                                                                                                                          9
Leejam Sports Company - Investor Presentation
Strategy
                                                                                                          Growth

Leejam has carefully crafted its 3 year strategy to enable the Company                                   To increase the rate of expansion of fitness centres
to continue its upwards trajectory built on rapid growth, expansion,                                     through
                                                                                                              • Traditional new clubs
diversification and evolution. Every step of the Company’s strategic pillars
                                                                                                             •    Corporate Wellness partnerships
will support the Company in achieving its vision of becoming the people’s
                                                                                                             •    Small Gym concepts for males and
favourite and most accessible wellness club. By aligning its daily activities                                     females.
with its strategy, the Company is determined to furthercreate significant
and sustainable value for its members, employees, shareholders and the                                     To balance expansion with maintaining brand quality/investment/operational excellence. To diversify and
Nation.                                                                                                    develop additional, secondary income lines e.g. Spa, Coffee, Retail, Protein, online such as Online Nutirition and
                                                                                                           Squat Wolf. To analyse pricing policies to ensure no loss-making clubs and to maximize on income
Strategy Pillars                                                                                           opportunities. To increase membership to achieve 500k members by 2025. To use research and logic to
  Unrivalled Customer                                                                                      ensure land acquisition targets have the highest prospects of success. To blend the Company’s business focus
  Experience                                                                                               on sales and adding considerable focus on retention.
To be recognized for unrivalled customer experience by exceeding expectations and providing
industry leading communication channels, with a special focus on being easy to use and providing           Quality
extensive access to Fitness Time Support. To provide an outstanding new member onboarding
                                                                                                         To build systems that guarantee a high degree of quality standards throughout the business (Total Quality
process (FT90), to maximize enjoyment and results in the club. To be proactive in listening to members
                                                                                                         Management). To introduce quality control measures audited by third parties, including mystery shop, NPS;
through frequent customer satisfaction surveys. To instil in staff members a culture of customer focus
                                                                                                         which are linked to Company management development and rewards. To continually innovate with the latest
through thorough and extensive recruitment practices, training, e-learning and regular testing and
                                                                                                         Sports Equipment, trend setting group exercise, indoor cycling and HIIT Studios to strengthen Leejam’s
assessment. iligent and risk-based decision making
                                                                                                         position as the market leader. To partner with winning brands that add kudos and value to all members. To
  Class Leading                                                                                          preserve Leejam’s exemplary reputation for having the highest hygiene standards. To provide the Company’s
  Technology                                                                                             operation with cutting edge data analytics in order to make sophisticated decisions that benefit both members
                                                                                                         and the business.
To be a digital leader; The Neom of the Fitness sector. To deliver a “Best in Class” consumer App that
enhances the Company’s relationship with members and prospects and is enabled for all wearable
integrations. To adopt “Smart Gym” through a connected experience for members providing a cashless
and convenient environment. To complete the integration of automated business processes through
Oracle and all other connected systems. To move to a cloud based office system, creating efficiency
and collaboration. To create a unique Employee app that improves communication, supports training
and provides a hub for all useful information. To be a leader in ESG through adoption of sustainable
and renewable energy sources.

  Focus ing on People

To become the Employer of choice through reputation and inspirational leadership. To provide clear,
effective structures, rewarding hard work through shared success and creating a dynamic, positive,
motivational working culture. To attract the best, retain the best and to grow from within through
career development, succession planning and caring staff facilities. To develop a Leejam Academy to
provide the best training and development for employees. To create a strong communication led
culture with team building and goal achievement at its core by harnessing staff sentiment to the brand
through organized and measured listening exercises. To become the ‘Employer of Choice’ that offers a
positive and motivated working culture.

                                                                                                                                                                                                                                10
Strategy Framework

For Leejam to achieve on its strategic objectives, a
clear and concise framework is required outlining the
way in which the Company plans to execute its
strategy and achieve its goals.

                                                                                                                                                                                                  To ensure structure and
                                                               To lead by example                                        To manage business performance                                           process
                                                    •   Portray the core values of Leejam in all company
                                                                                                                     •    Ensure all Financial KPIs are cascaded and distributed to         •   Driving improvement and enhancements across the
                                                        activities starting with
                                                        leadership      and   cascaded   dow n   to   the   entire       departmental teams. Monitor    approved KPIs on a monthly              organization. Without limitations, to set the
                                                                                                                         basis and immediate action plan for any deviation is required.         strategy but continually scan the market locally and
                                                        organization.
                                                    •   Coaching theme must be embraced for direct repor ts and      •   Ensure all other KPIs (customers, regulatory, processes) are           internationally, to adopt what is beneficial for future
                                                                                                                         also cascaded down to all teams.                                       growth.
                                                        mentoring the great talents in all teams to create a pool
                                                        of outperformer.                                             •   As for Strategic projects and expansions, stakeholders must be     •   Focus on evolution, diversification, innovation
                                                                                                                         accountable and responsible for execution within their allocated       and digitalisation.
                                                    •   Conduct a well-planned meetings internally, scheduled
                                                        one-on-one and team meetings regularly.                          timeframes.

                                                    •   Project the right image for the Company throughout
                                                        the company and centres. Leadership image will reflect
                                                        on Company’s image.

                                                                                                                                                                                                                                                          11
Risk Management

Leejam strives to ensure that its stakeholders, its reputation and the value
of its assets are protected through effective risk assessment, identification
and mitigation. The Company is committed to continually developing a risk
management culture through its Risk Management Policy, framework and
continual team development.

                                                                                12
Risk Management

Strategic Risk                                                                                                                                                     Operational Risk                                               People Risk
Strategic Risks are those that failed business decisions pose to a company.                                                                                        The failure to maintain adequate security and safety
                                                                                                                                                                   environment as well as regulatory non-compliance               The risk that staff either leave or that they do not
By continuing to diversify its customer base, the Company has negated this risk by continually adding new customers, both locally
                                                                                                                                                                   causing interruptions in business.                             follow company procedure or practices.
and internationally in different segments, thus eliminating concentration and spreading the Company’s revenue income across a
larger pool.                                                                                                                                                       Leejam mitigates operational risk through maintaining          The Company mitigates this risk through various
                                                                                                                                                                   appropriate security equipment and tracking systems at         initiatives to be the employer of choice in its
New competitors in the market and a change in the partnerships of existing competitors may affect The Company`s market share.
                                                                                                                                                                   club level, as well as through training and development of     sector, by implementing individual personal
Failure to provide members with high quality products and services. To mitigate such risks, the Company maintains price discipline
                                                                                                                                                                   staff and carrying out regular audit checks.                   development programs and by ensuring the
and leadership and maintains focus on choosing the best sites in a given geographical area. Leejam continues to invest in the
member proposition and monitor utilisation and member satisfaction scores. Ongoing review of equipment usage is caried out to                                                                                                     highest level of ongoing training,
                                                                                                                                                                   To minimise the risk of non-compliance with regulatory
ensure timely replacements and the Company continuously explores further innovations to improve the member experience.                                                                                                            as well as utilising a full and clear succession
                                                                                                                                                                   bodies, the Company ensures oversight of management
                                                                                                                                                                                                                                  planning process.
                                                                                                                                                                   on regulatory compliances and seeks appropriate legal
                                                                                                                                                                   and expert advice for complex matters. This is

Financial Risk                                                                                                                                                     complemented by the recruitment of suitably qualified

1                                                             2                                                       3
                                                                                                                                                                   staff and the provision of their continuous professional
                                                                                                                                                                   development through training.                                  Insurance Risk
      Credit Ris k                                                   Liquidity Risk                                         Currency                               To ensure minimal interruption to service, the Company         The risk of an outcome that an insurance
                                                                                                                            Ris k
                                                                                                                                                                   has prepared a fully qualified maintenance department          company has agreed to insure against in the
                                                              The inability to provide the funds necessary to         The fluctuation of the financial value of
                                                                                                                                                                   that employ highly skilled and specialized technicians         policy wordings, which has the potential to cause
Failure of one party to fulfil its financial obligations as   fulfil its obligations with respect to financial     the assets and financial liabilities due to
                                                                                                                                                                   in addition to stocking of critical spare parts for the        financial loss, property damage or bodily harm
they fall due, causing financial losses to the other          instruments, which arises when it is not possible to the change in the foreign exchange
                                                                                                                                                                   production lines to ensure minimal disruption and              were it to occur.
party.                                                        sell a financial asset quickly at an amount close to rates.
                                                                                                                                                                   downtime in the event of a breakdown.
To minimise the impact of credit risk, the Company            its fair value.                                                                                                                                                     To ensure there is no risk to the Company, its
                                                                                                                      Currency risk is mitigated by ensuring
sets a credit limit for individual customers and                                                                                                                                                                                  property or any of its stakeholders, the
                                                                                                                      all the material transactions of the
continuously monitors existing receivables.
                                                              The Company mitigates liquidity      risk by engaging
                                                                                                                      company are made in either Saudi
                                                                                                                                                                   Information Technology Risk                                    Company continuously reviews and updates its
                                                              multiple banking institutions to ensure the best                                                                                                                    insurance policies and ensures the adequacy of
                                                              possible rates when sourcing the various,               Arabian Riyals or in US Dollars.             The threat to a Company’s business data, critical systems
                                                                                                                                                                                                                                  these policies for their requirements.
                                                              available financing options,                                                                         and business processes, and the lack of a Company’s IT
                                                                                                                      The Company also always agrees in
                                                              and fully utilizes all available sources.                                                            performance/
                                                                                                                      advance on a fixed exchange rate with
                                                                                                                      suppliers for all goods, equipment or
                                                                                                                      material which are purchased from            The ability to enrol members, carry out online marketing
                                                                                                                      abroad, prior to import, mainly carried      activity, process payments and control gym access is
                                                                                                                      out in US Dollars, owing to the Saudi        dependent on the performance of our IT systems. The IT
                                                                                                                      Arabian                                      risks are mitigated by ensuring primary IT infrastructure is
                                                                                                                      Riyal being pegged to the US Dollar, which   fully managed by specialist IT companies with best
                                                                                                                      negates this risk.                           practice architecture and support. Backing up all
                                                                                                                                                                   membership and business information, ensuring all
                                                                                                                                                                   sensitive information is encrypted and ensuring a robust
                                                                                                                                                                   disaster recovery and business continuity plans is also
                                                                                                                                                                   essential in minimising the risk to Leejam.

                                                                                                                                                                                                                                                                                         13
KSA
 Locations                                  131 Centers
                                                                   UAE
                                                                   5 Centers

No. of Centers                2   50   35          4      0   31          7    1

Corporate Wellness = 1 Club
                                                                                   14
Financial
Performance
Profitability – Q1 2021

                                             Revenue                                               Gross profit

                                             (24.9%)                                               (47.4%)

                                                          197.7                                                          52.0
                                     148.5
                                                                                          27.4

                                  Q1 2021               Q1 2020                          Q1 2021                    Q1 2020

          Operating income                                        Net income                                                    EBITDA

              (78.1%)                                                                                                           (22.0%)

                                                                                 6.2

                                                                                                                                           70.6
                              20.9                                                                                55.1
                                                        (7.0)

  4.6
                                                       Q1 2021                 Q1 2020                        Q1 2021                     Q1 2020
Q1 2021                      Q1 2020

                                                                                                                                                    16
QoQ Growth

                                                                                      Revenue
         3 0                                                                                                                                                      2 .5

                                                      1.9                                             2
                                            1.8                             1.7          1.8                                                    1.7
         2 5
           0

                                                                                                                                                                  2

                    1.5         1.6                              1.6                                                                  1.6
         2 0

                                                                                                                  1.5
                                                                                                                                                          1.1
                                                                                                                                                                  1 .5

                                                                                                     267
         1 5
           0

                                                      225        217        219          238                                                    230
                                           210                                                                                        210
                                                                                                                                                                  1

         1 0

                    177         187                                                                               196
                                                                                                                                                         149
                                                                                                                            0.2
                                                                                                                                                                  0 .5

          5 0

           0
                                                                                                                            24                                    0

                  Q1 2018     Q2 2018    Q3 2018    Q4 2018    Q1 2019    Q2 2019      Q3 2019     Q4 2019      Q1 2020   Q2 2020   Q3 2020   Q4 2020   Q1 2021
                                                                            Revenue      Revenue per center

                                                                                    Net Income
                                          0.5        0.5                                            0.5
                                                                           0.4          0.4
  8 0                                                                                                                                                             0 .6

  6 0

                  0.3         0.3                               0.3
                                                                                                                                      0.2
                                                                                                                                                                  0 .4

                                                                                                    68                                                   -0.05
  4 0

                              40          54         54         40         50           49                        0.1                           0.0
                                                                                                                                                                  0 .2

                  33                                                                                                                  26.6
  2 0

   0

                                                                                                                   6                                              0

                                                                                                                                               -0.5       -6.97
                                                                                                                           -91.3
 -2 0

                                                                                                                                                                  -0 .2

 -4 0

                                                                                                                                                                  -0 .4

 -6 0

                                                                                                                                                                  -0 .6

 -8 0

-1 0 0

                                                                                                                           -0.7                                   -0 .8

                Q1 2018     Q2 2018     Q3 2018    Q4 2018    Q1 2019    Q2 2019      Q3 2019    Q4 2019        Q1 2020   Q2 2020   Q3 2020   Q4 2020   Q1 2021
                                                                         Net Income     Net Income per center
                                                                                                                                                                          17
Revenue Break-Down Q1 2021

               Fitness Time - Ladies                        Fitness Time Xpress,
                                                                                        PT, 16, 11%                     Rental, 1, 1%
                    Plus, 1, 1%                                     1, 0%

          Fitness Time - Ladies                                                                                        Q1 2021, Other
                                                            Male Mnmgt, 2, 2%
               Pro, 3, 2%                                                                                               Service, 0, 0%

                                                             Fitness Time - Ladies
                                                                 Xpress, 0, 0%
           Fitness Time -
          Ladies, 28, 21%                                                            Corporate, 2, 1%
                                                                                                                         Individual
                                                                                                                       Membership, 129,
                                                                                                                            87%

          Fitness Time Plus, 4,
                   3%

                                                                                             Female, 36, 25%

                                                            Fitness Time, 62,
                                                                  48%
           Fitness Time Pro,
                30, 23%

                                                                                                               Male, 112, 75%

Label Key:
Brand Name, Revenue, % of Total Revenue                                                                                                   18
Q1 2021 P&L

SR M                                  Q1 2021 Q1 2020    ∆           ∆%       Q1 2019     ∆        ∆%       Key Messages:
Revenue                                148.5   197.7  (49.1)       (24.9%)     219.7   (71.2)    (32.4%)
Cost of revenue                       (121.2) (145.7)  24.5        (16.8%)    (142.2)   21.0     (14.8%)     Revenue decreased by SR 49.12million representing 24.85% due to Gym
Gross profit                           27.4    52.0   (24.6)       (47.4%)     77.5    (50.1)    (64.7%)      closure in the Kingdom from 5th February 2021 till 6th March 2021.
Gross profit Margin                   18.42% 35.00% (16.59%)       (47.4%)    35.26% (16.85%)    (47.8%)
                                                                                                             Cost of revenue decreased by 24.48 million representing 16.81% due to
General and administrative expenses   (21.0)    (22.2)    1.2       (5.3%)    (20.7)    (0.3)     1.6%        Decrease in salaries and related benefits by 11.25 million representing
Advertising and marketing expenses     (3.7)     (8.6)    4.9      (56.8%)     (3.6)    (0.1)     3.5%        22.38%, Decrease in operational expenses such as cleaning and maintenance
Impairment loss on fixed assets and                                                                           by SR 8.77 million representing 28% and Decrease in utilities expenses by SR
                                       (1.2)     0.0      (1.2)       -        0.0      (1.2)       -
advancses to suppliers                                                                                        4.90 million representing 31.40%
Impairment loss on financial assets    0.1       (0.3)     0.4     (128.7%)    (0.1)      0.2   (157.5%)
Other (expenses) / income, net         3.1        0.0      3.1          -       0.0       3.1       -        General & administrative expenses were lower by SR 1.17million
Operating income                       4.6       20.9     (16.3)    (78.1%)    53.0      (48.5) (91.4%)       representing 5.29% mainly due to decrease in salaries and related benefits.
Operating income Margin               3.08%     10.57%   (7.49%)    (70.8%)   24.14%   (21.06%) (87.2%)
                                                                                                             Advertising & marketing expenses were reduced by SR 4.9million
Finance charges                       (11.5)    (14.5)    2.9       (20.2%)   (12.4)     0.9       (7.2%)    representing 56.8% due to less expenditure on campaign during the current
Net income before Zakat                (7.0)     6.4     (13.4)    (208.7%)    40.6     (47.6)   (117.2%)    quarter because of the lock down.

Zakat                                    0.0     (0.2)     0.2     (100.0%)    (1.0)      1.0   (100.0%)     Other income was higher by SR 3.1million mainly due to rental concession
Net income                              (7.0)     6.2     (13.2)   (211.6%)    39.6      (46.6) (117.6%)      received on lease payments during the period.
Net income Margin                     (4.69%)   3.16%    (7.85%)   (248.6%)   18.02%   (22.72%) (126.0%)
                                                                                                             Decrease of finance cost by SR 2.9million (20.18%) mainly due to the
Basic earnings per shares              -0.13     0.12     (0.3)    (211.6%)    0.76     (0.9)    (117.6%)     decrease in finance costs on lease liabilities .

EBITDA                                 55.1      70.6    (15.5)    (22.0%)     98.8     (43.7)   (44.2%)
EBITDA Margin                         37.09%    35.72%   1.38%      3.9%      44.97%   (7.87%)   (17.5%)

                                                                                                                                                                                        19
COGS & SG&A

                           COGS         COGS/Center
1 6
  0                                                                  1 .2

1 4
  0

                                                                     1 .1

1 2
  0

                                     1.1                   1.1       1 .1

                                                                            Key Messages:
1 0

                                                                     1 .0
                                                                             15% decrease in average COGS / center is mainly driven by:
 8 0

                                                                                 Lower in salaries and related benefits by 11.25 million representing
                                                                                  22.38%, Decrease in operational expenses such as cleaning and
                                                                     1 .0

 6 0

            0.9
                                                                     0 .9

                                                                                  maintenance by SR 8.77 million representing 28% and Decrease in utilities
                                                                                  expenses by SR 4.90 million representing 31.40%
 4 0

                                                                     0 .9

            121                      146                   142
 2 0

  0                                                                  0 .8

        Q1 2021                   Q1 2020              Q1 2019

                                  G&A      S&M

                                                                            Key Messages:
                                                                             5% decrease in G&A & 57% decrease in S&M is mainly driven by:
                                                                                 General & administrative expenses were lower by SR 1.17million
                                                                                  representing 5.29% mainly due to decrease in salaries and related benefits.

       21                       22                    21                         Advertising & marketing expenses were reduced by SR 4.9million
                                                                                  representing 56.8% due to less expenditure on campaign during the
                                                                                  current quarter because of the lock down.
                                            9
                  4                                              5

        Q1 2021                   Q1 2020              Q1 2019
                                                                                                                                                                20
Loans & Finance Charges

                   Loans     Finance Charges
5 0                                                      1 6

4 9
  0

                             14
                                                         1 4

4 8
  0

                                                 13      1 2

                                                               Key Messages:
4 7
  0

4 6
  0
        12                                                      Overall bank loan decreased by SR 15M, however Cash increased by SR 86M
                                                                Approximate 50-60% split by managing the portfolio between floating & fixed
                                                         1 0

4 5
  0

                                                                 rated borrowings.
                                                                Weighted average cost of borrowings approximate 2.39% during Q1 2021
                                                         8

                                                                 comparing last year of 4.0% due to decrease in SIBOR and better negotiation of
4 4
  0

4 3
  0
                                                         6

                                                                 interest rates during Q1 2020.
4 2
  0

                                                         4

4 1
  0

                                                         2

4 0

       473                  488                 425
3 9
  0                                                      0

      Q1 2021              Q1 2020             Q1 2019

                                                                                                                                                  21
Cash Generation

3 5
  0
                   Cash Flow from Operating Activites               Deferred Revenue   Cash flow/EBITDA         1 2
                                                                                                                  0 %

                                                                                            113%
3 0

                                                             102%                                               1 0 %

2 5
  0

                                                                                                                8 0
                                                                                                                  %

             75%
2 0

                                                                                                                6 0
                                                                                                                  %

1 5
  0

                                                                                                                4 0
                                                                                                                  %

1 0

                                                                                                                2 0
                                                                                                                  %

 5 0

        41                321                           72              326              111              302
  0                                                                                                             0 %

             Q1 2021                                          Q1 2020                          Q1 2019

                                                                                                                        22
Male vs. Female Centres Performance

                                                           Ave. Revenue   Ave. GP

% Gross Margin, average
                                          22.1%                                            7.2%

                                    1.2            0.3                              1.0            0.1
                                            Male                                          Female

                                                                                                         23
2021
Outlook
2021 Outlook

Tentative Guidance:                                                                                        Current      Expected (Range)
2021 growth will be driven by:                                                               Category
                                                                                                          31-Mar-21         31-Dec-21
•   Further opening of 26-30 Xpress Clubs
•   Further opening of 2-4 female centers                                           Female - Xpress           1               3 to 5
•   Continuing LFL growth and ramp up of non-LFL & new centers                      Female - Big Box         38              40 to 42
•   Expanding corporate & PT business
•   Gradual improvement of realized prices                                          Male - Big Box           87              87 to 90
•   Launching New App & Website by Q2
•   Launching New Membership System by Q2                                           Male - Xpress             5              20 to 30
•   Cost control, and improving customer experience, member retention & services.                           131            150 to 167
                                                                                    Total
•   Launching recurring payment by 2nd Half.

                                                                                                           Expected CAPEX (Range) SAR
                                                                                               Category
                                                                                                                      Per Center
                                                                                    Xpress Format                     2.5M to 5M
                                                                                    Big Box Format                   15M to 20M

                                                                                                                                           25
You can also read