Report to the Commission Regulation A Lookback Study and Offering Limit Review Analysis - SEC.gov
←
→
Page content transcription
If your browser does not render page correctly, please read the page content below
Report to the Commission
      Regulation A Lookback Study and Offering Limit Review Analysis

This is a report by the staff of the U.S. Securities and Exchange Commission. The Commission has
        expressed no view regarding the analysis, findings, or conclusions contained herein.

                                        March 4, 2020

                                               1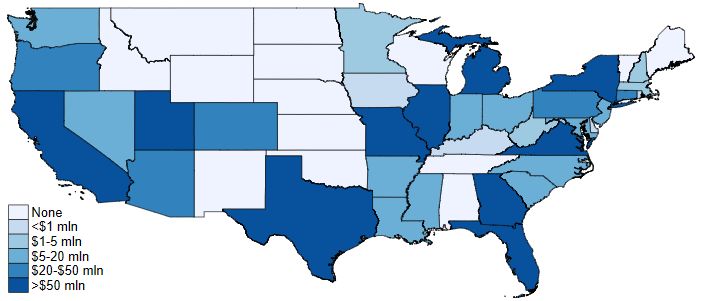
Contents
 A. Executive Summary ..................................................................................................3
 B. Background ................................................................................................................6
 C. Capital Formation in the Regulation A market .....................................................7
    1. Capital Raising under the Amendments ............................................................. 7
    2. Characteristics of Regulation A Issuers and Offerings ................................... 13
 D. Intermediaries in the Regulation A market ..........................................................19
 E. Investor Protection Considerations in the Regulation A Market .......................20
    1. Federal, State, and Other Actions ...................................................................... 20
    2. Issuer and Intermediary Characteristics ......................................................... 22
    3. Consideration of Additional Investor Protections ............................................ 25
 F. Offering Limit Review Analysis .............................................................................26
    1. Evidence from Public Comment ........................................................................ 26
    2. Evidence from Regulation A Market ................................................................. 28
    3. Inflation-Related Considerations ....................................................................... 31
    4. Evidence from Other Offering Methods ........................................................... 32
 G. Other Considerations Related to Regulation A ....................................................36

                                                                   2
A. Executive Summary
Regulation A was originally adopted by the Commission in 1936 as an exemption for
small issues under the authority of Section 3(b) of the Securities Act of 1933 (the “Securities
Act”). 1 Section 401 of the Jumpstart Our Business Startups Act of 2012 (the “JOBS Act”) 2
amended Section 3(b) of the Securities Act by designating Section 3(b), the Commission’s
exemptive authority for offerings of up to $5 million, as Section 3(b)(1), and adding new
Sections 3(b)(2) through 3(b)(5) to the Securities Act. 3 Section 3(b)(2) directed the Commission
to adopt rules adding a class of securities exempt from the registration requirements of the
Securities Act for offerings of up to $50 million of securities within a 12-month period. Sections
3(b)(2) through (5) specify certain terms and conditions for such exempt offerings and authorize
the Commission to adopt other terms, conditions, or requirements as necessary in the public
interest and for the protection of investors.
In 2015, the Commission adopted final rules to implement Section 401 of the JOBS Act
by creating two tiers of Regulation A offerings: Tier 1, for offerings of up to $20 million in a 12-
month period; and Tier 2, for offerings of up to $50 million in a 12-month period. 4 In 2018, the
Commission adopted further amendments to the issuer eligibility and related provisions pursuant
to the Economic Growth, Regulatory Relief, and Consumer Protection Act of 2018 (the
“Economic Growth Act”) to allow issuers that are subject to the ongoing reporting requirements
1
See Release No. 33-632 (Jan. 21, 1936).
2
See Sec. 401(a), Pub. L. No. 112-106, 126 Stat. 306 (Apr. 5, 2012).
3
See 15 U.S.C. 77c(b)(2) through (5).
4
See Amendments for Small and Additional Issues Exemptions under the Securities Act (Regulation A), Release
No. 33-9741 (March 25, 2015) [80 FR 21805 (April 20, 2015)] (“2015 Regulation A Release”).
3of Section 13 or 15(d) of the Securities Exchange Act of 1934 (the “Exchange Act”) to use the
exemption. 5
The Commission is required by Section 3(b)(5) of the Securities Act to review the Tier 2
offering limit every two years. In the 2015 Regulation A Release, the Commission stated that
the staff would undertake to review the Tier 1 offering limit at the same time. 6 Following
completion of the staff reviews of the offering limits in 2016 and 2018, the Commission did not
propose to increase the offering limit for either Tier at those times. At the time of adoption of
the 2015 amendments, the Commission also stated that the staff would study and submit a report
to the Commission no later than five years following the adoption of the amendments on the
impact of both Tier 1 and Tier 2 offerings on capital formation and investor protection. 7 The
Commission indicated in the 2015 Regulation A Release that, based on the information
contained in the report, it may propose either to decrease or to increase the offering limit for
Tier 1, as appropriate. 8
Staff has conducted a lookback review of Regulation A as specified in the 2015
Regulation A Release and an offering limit review as required under the JOBS Act. While the
joint findings of these analyses are discussed more in depth throughout this report, at a high
level:
5
See Amendments to Regulation A, Release No. 33-10591 (Dec. 19, 2018) [84 FR 520 (Jan. 31, 2019)] (“2018
Regulation A Release”).
6
See 2015 Regulation A Release, at Section II.A.
7
See id. The 2015 Regulation A Release stated that “[t]he report will include, but not be limited to, a review of:
(1) the amount of capital raised under the amendments; (2) the number of issuances and amount raised by both
Tier 1 and Tier 2 offerings; (3) the number of placement agents and brokers facilitating the Regulation A
offerings; (4) the number of Federal, State, or any other actions taken against issuers, placement agents, or
brokers with respect to both Tier 1 and Tier 2 offerings; and (5) whether any additional investor protections are
necessary for either Tier 1 or Tier 2.” Id.
8
Id.
4• Through the staff’s examination of capital formation in the Regulation A market since the
effectiveness of the 2015 amendments, the amount of capital raised and the number of
issuances and amounts sought in Tier 1 and Tier 2 offerings, as of December 31, 2019
were reported as follows:
o $2.446 billion reported raised by 183 issuers in ongoing and closed offerings
(average of $13.4 million), including $230 million in Tier 1 and $2.216 billion in
Tier 2 offerings;
o $9.095 billion sought across 382 qualified offerings (average of $23.8 million),
including $759 million sought across 105 qualified Tier 1 offerings and $8.336
billion sought across 277 qualified Tier 2 offerings (excluding withdrawn
offerings); and
o $11.170 billion sought across 487 filed offerings (average of $22.9 million), some
of which have not been qualified, including $1.102 billion sought across 145 filed
Tier 1 offerings and $10.069 billion sought across 342 filed Tier 2 offerings
(excluding withdrawn and abandoned offerings).
• Aggregate Regulation A financing levels between 2016 and 2019 were significantly
higher than financing levels prior to the 2015 amendments, due to the increase in the
offering limit and the number of offerings. However, aggregate Regulation A financing
levels remain modest relative to registered offerings or Regulation D offerings.
Financing levels are likely related to a combination of factors, including the pool of
issuers and investors drawn to the market under existing conditions; the availability to
issuers of attractive private placement alternatives without an offering limit; the
availability to investors of attractive investment alternatives with a more diversified pool
5of issuers; limited intermediary participation and a lack of traditional underwriting, which
limits certification (i.e., signaling of an issuer’s growth potential to the market through an
underwriter’s reputation, which mitigates the information asymmetry about an issuer’s
potential); and a lack of secondary market liquidity.
The staff’s analysis took into account evidence from Regulation A market activity since
the 2015 amendments through December 31, 2019; public comment following the 2015
amendments and the 2019 harmonization concept release; 9 evidence from industry reports;
recommendations from the SEC’s annual Government Business Forums on Small Business
Capital Formation; 10 and other public sources.
B. Background
In adopting the two-tiered structure for Regulation A in 2015, the Commission indicated
that it expected the requirements for Tier 1 to result in securities offerings that would be more
local in character, while Tier 2 offerings would likely be more national in character. 11 Certain
basic requirements are applicable to both tiers. While an issuer of $20 million or less of
securities can elect to proceed under either Tier 1 or Tier 2, Tier 2 issuers are subject to
significant additional requirements. For example, Tier 2 issuers are required to include audited
financial statements in their offering circulars 12 and must provide ongoing reports on an annual
and semiannual basis with additional requirements for interim current event updates, assuring a
9
See 2015 Regulation A Release; and Concept Release on Harmonization of Securities Offering Exemptions,
Release No. 33-10649 (June 18, 2019) [84 FR 30460 (June 26, 2019)] (“Concept Release”). Unless otherwise
indicated, comments cited in this report are to comment letters received in response to the Concept Release,
which are available at https://www.sec.gov/comments/s7-08-19/s70819.htm.
10
See https://www.sec.gov/oasb/sbforum.
11
See 2015 Regulation A Release.
12
See Part F/S of Form 1-A [17 CFR 239.90].
6continuous flow of information to investors and the market. 13 In addition, Tier 2 offerings are
not subject to state securities law registration and qualification requirements, while Tier 1
offerings remain subject to those state requirements. 14
In addition to expanding the Regulation A offering limit, the 2015 amendments sought to
modernize the Regulation A filing process, align practice in certain areas with prevailing practice
for registered offerings, create additional flexibility for issuers in the offering process, and
establish an ongoing reporting regime for certain Regulation A issuers. 15
C. Capital Formation in the Regulation A market
1. Capital Raising under the Amendments
Below we discuss available information on the amount of capital raised under the
exemption and the number of issuances and amount raised by both Tier 1 and Tier 2 offerings.
Subject to the considerations detailed below, we analyze the available evidence on offering
activity under Regulation A. 16 Except where specified otherwise, we consider evidence from the
effectiveness of the 2015 amendments (June 19, 2015) through December 31, 2019. During the
considered period, we estimate that 487 offerings by 442 issuers were filed, of which
approximately 382 offerings by 346 issuers were qualified. The total amount sought was
13
See 17 CFR 230.257 (“Rule 257”).
14
See 2015 Regulation A Release.
15
See id.
16
These data exclude offerings identified as withdrawn or abandoned. Some offerings included in our data may
have been effectively halted and may be withdrawn or abandoned at a future date. Unless noted otherwise, the
analysis relies on the information reported by issuers in the most recent amendment during the considered
period, including post-qualification amendments. Offerings were identified based on CIK and file number;
offerings identified as duplicates were consolidated; and amendments were consolidated with the original
offering for purposes of the number of offerings. Rounding affects totals. After a prospective Regulation A
issuer files an offering statement with the Commission, the offering statement is subject to review by
Commission staff. The offering statement may then be declared qualified by a notice of qualification. After a
Regulation A offering statement has been qualified, issuers may begin selling securities.
7approximately $11.2 billion across all filed offerings, including approximately $9.1 billion across
qualified offerings.
Table 1. Capital Sought under Regulation A during June 19, 2015 - December 31, 2019 17
All Filed Offerings
Tiers 1 & 2 Tier 1 Tier 2
(Dollar amounts in millions)
Aggregate dollar amount sought $11,170.2 $1,101.5 $10,068.6
Number of offerings 487 145 342
Average dollar amount sought $22.9 $7.6 $29.4
Offerings Qualified by Commission Staff
Tiers 1 & 2 Tier 1 Tier 2
(Dollar amounts in millions)
Aggregate dollar amount sought $9,094.8 $759.0 $8,335.8
Number of offerings 382 105 277
Average dollar amount sought $23.8 $7.2 $30.1
Table 2 summarizes information about the proceeds reported in Regulation A offerings.
Between June 2015 and December 2019, approximately $2.4 billion in proceeds was reported by
183 issuers.
Table 2. Capital Reported Raised under Regulation A during June 19, 2015 -
December 31, 2019 18
Capital Reported Raised
Tiers 1 & 2 Tier 1 Tier 2
(Dollar amounts in millions)
Aggregate dollar amount reported raised $2,445.9 $230.4 $2,215.6
Number of issuers reporting proceeds 183 39 144
Average dollar amount reported raised $13.4 $5.9 $15.4
17
See supra note 16.
18
Capital raised is based on information reported by companies in Forms 1-Z, 1-K, 1-SA, 1-U, and offering
circular supplements pertaining to completed and ongoing Regulation A offerings and post-qualification
amendments, and for issuers whose shares have become exchange-listed, information from other public sources.
Estimates represent a lower bound on the amounts raised given the time frames for reporting proceeds following
completed or terminated offerings and that offerings qualified during the report period may be ongoing. In
particular, proceeds in ongoing offerings disclosed in periodic reports of Tier 2 issuers are likely to be amended
at a future date. Issuers that report proceeds of zero are excluded from the count. Some of the issuers that have
not yet made reports of proceeds may have ongoing offerings. Other issuers may have halted attempts to raise
capital under Regulation A but have not made subsequent EDGAR filings. If an issuer reported proceeds both
from a Tier 1 and a Tier 2 offering, that issuer is counted twice (once under Tier 1 and once under Tier 2).
8Figure 1. Capital Reported Raised under Regulation A
Aggregate dollar amount Average dollar amount
reported raised Number of issuers reported raised
(millions) reporting proceeds (millions)
Tier 1
$230.4 Tier 1 Tier 1
39 $5.9
Tier 2 Tier 2 Tier 2
$2,215.6 144 $15.4
Turning to a comparison of different offering tiers, as illustrated in Figure 1, Tier 2
accounted for the majority of Regulation A offerings (70% of filed and 73% of qualified
offerings), amounts sought (90% of amounts sought in filed offerings and 92% of amounts
sought in qualified offerings), and reported proceeds (91%) during this period. The larger Tier 2
offering limit does not appear to be the sole factor for issuers’ decision between tiers, given that
approximately 43% of filed Tier 2 offerings and 41% of qualified Tier 2 offerings sought
amounts not exceeding the Tier 1 offering limit of $20 million. We estimate that 112 Tier 2
issuers reported raising up to $20 million in financing under Regulation A even though that
amount would have made them eligible to use Tier 1 as well. Blue sky law preemption,
facilitating nationwide solicitation and solicitation over the Internet, may have contributed to the
popularity of Tier 2 offerings among issuers seeking the lower amount. 19
19
See, e.g., Commentary at the 38th Annual SEC Government-Business Forum on Small Business Capital
Formation (Aug. 14, 2019), available at https://www.sec.gov/files/2019-sec-government-business-forum-small-
business-capital-formation-transcript.pdf, transcript at 132–135.
9Aggregate Regulation A financing levels were significantly higher relative to Regulation
A prior to the 2015 amendments, as a combination of the increase in the offering limit and in the
number of offerings. 20 As can be seen in Table 3 and Figure 2, issuer interest in Regulation A
has grown over the considered period.
Table 3. Trends in Financing under Regulation A since 2015 21
All Tier 1 Tier 2
Filed Aggregate Number Aggregate Number Aggregate Number
Jun. 2015 to amount sought of amount sought of amount sought of
(Dollar amounts offerings (Dollar amounts offerings (Dollar amounts offerings
in millions) in millions) in millions)
Dec. 2015 1,109.1 55 306.0 26 803.1 29
Dec. 2016 3,289.3 174 724.1 78 2,565.2 96
Change in 2016 2,180.2 119 418.1 52 1,762.1 67
Dec. 2017 5,909.7 265 856.8 93 5,053.0 172
Change in 2017 2,620.4 91 132.7 15 2,487.7 76
Dec. 2018 8,195.9 362 979.8 119 7,216.1 243
Change in 2018 2,286.2 97 123.0 26 2,163.1 71
Dec. 2019 11,170.2 487 1,101.5 145 10,068.6 342
Change in 2019 2,974.3 125 121.7 26 2,852.5 99
All Tier 1 Tier 2
Qualified Aggregate Number Aggregate Number Aggregate Number
Jun. 2015 to amount sought of amount sought of amount sought of
(Dollar amounts offerings (Dollar amounts offerings (Dollar amounts offerings
in millions) in millions) in millions)
Dec. 2015 181.9 15 68.8 10 113.1 5
Dec. 2016 1,892.1 100 305.7 42 1,586.4 58
Change in 2016 1,710.2 85 236.9 32 1,473.4 53
Dec. 2017 4,153.1 185 488.1 57 3,665.1 128
Change in 2017 2,261.0 85 182.4 15 2,078.6 70
Dec. 2018 6,332.1 280 724.5 86 5,607.6 194
Change in 2018 2,179.0 95 236.4 29 1,942.5 66
Dec. 2019 9,094.8 382 759.0 105 8,335.8 277
Change in 2019 2,762.7 102 34.5 19 2,728.2 83
20
Prior to June 19, 2015, Regulation A issuers could raise up to $5 million in a 12-month period. See supra note
3 and accompanying text. See also 2015 Regulation A Release, at text accompanying note 893 (noting that 26
offerings, excluding amendments, were qualified by the Commission in calendar years 2012 to 2014, which
amounts to an average of 8–9 qualified offerings per year).
21
See supra notes 17 and 18. Totals as of the end of the respective period reflect exclusion of abandoned or
withdrawn offerings. Changes over time in cumulative amounts reported raised may reflect the timing of
reporting by the company rather than the time at which the capital was raised, and therefore should not be used
to gauge trends in capital raising activity.
10All Tier 1 Tier 2
Reported Aggregate Number Aggregate Number Aggregate Number
Proceeds proceeds of issuers proceeds of issuers proceeds of issuers
Jun. 2015 to: (Dollar amounts (Dollar amounts (Dollar amounts
in millions) in millions) in millions)
Dec. 2015 9.6 2 2.0 1 7.6 1
Dec. 2016 238.7 27 55.6 7 183.1 20
Change in 2016 229.2 25 53.7 6 175.5 19
Dec. 2017 668.7 78 126.0 17 542.7 61
Change in 2017 430.0 51 70.3 10 359.6 41
Dec. 2018 1,404.4 132 186.5 27 1,218.0 105
Change in 2018 735.7 54 60.5 10 675.3 44
Dec. 2019 2,445.9 183 230.4 39 2,215.6 144
Change in 2019 1,041.5 51 43.9 12 997.6 39
Figure 2. Trends in Regulation A
Trends in Regulation A - Filed Offerings
$3,000 100
Aggregate Amount Sought (millions)
$2,853
$2,500 $2,488 80
$2,163
$2,000 $1,762
60
Number
$1,500
40
$1,000 $803
20
$500
$306 $418 $133 $123 $122
$0 0
Jun.-Dec. 2015 2016 2017 2018 2019
Tier 1 (aggregate amount sought) Tier 2 (aggregate amount sought)
Tier 1 (number) Tier 2 (number)
11Trends in Regulation A - Qualified Offerings
$3,000 100
Aggregate Amount Sought (millions)
$2,500 $2,728
80
$2,000 $2,079 $1,943
60
Number
$1,500 $1,473
40
$1,000
20
$500
$69 $237 $182 $236 $35
$0 $113 0
Jun.-Dec. 2015 2016 2017 2018 2019
Tier 1 (aggregate amount sought) Tier 2 (aggregate amount sought)
Tier 1 (number) Tier 2 (number)
Trends in Regulation A - Reported Proceeds
$1,200 50
Aggregate Reported Proceeds (millions)
$1,000
$998 40
$800
30
Number
$675
$600
20
$400
$360
10
$200
$8 $176
$2 $54 $70 $61 $44
$0 0
Jun.-Dec. 2015 2016 2017 2018 2019
Tier 1 (aggregate reported proceeds) Tier 2 (aggregate reported proceeds)
Tier 1 (number) Tier 2 (number)
Table 4 reports amounts of capital sought and reported raised per issuer (across all
offerings during the June 2015–December 2019 period). A typical Regulation A issuer sought to
offer amounts that were substantially below existing offering limits. Reported proceeds were
significantly smaller than the amounts sought and the existing offering limits, and only 10% of
12issuers reported proceeds that in the aggregate (across the entire June 2015–December 2019
period) reached the respective 12-month offering limit. Potential reasons are difficult to pinpoint
with certainty, but the findings are generally in line with the expectation that proceeds would be
lower than amounts sought due to many of these issuances being best-efforts, self-underwritten
offerings with limited institutional participation.
Table 4. Capital Sought and Raised under Regulation A during June 2015–December 2019
vs. Existing Offering Limits 22
Median Average % of issuers
per issuer per issuer with
(Dollar (Dollar proceeds
amounts in amounts in reaching the
millions) millions) existing limit
Amount sought per issuer across filed offerings
All issuers $15.0 $25.2 33%
Tier 1 $5.0 $8.5 15%
Tier 2 $26.0 $32.0 41%
Amount sought per issuer across qualified
offerings
All issuers $16.3 $26.1 34%
Tier 1 $5.0 $8.2 13%
Tier 2 $26.0 $32.3 41%
Reported proceeds per issuer
All issuers $5.0 $13.4 9%
Tier 1 $4.1 $5.9 3%
Tier 2 $5.5 $15.4 10%
2. Characteristics of Regulation A Issuers and Offerings
Below we summarize information on issuer and offering characteristics in qualified
Regulation A offerings during the considered period.
22
See supra notes 16, 17, and 18. However, all amounts shown in this table reflect totals of reported proceeds for
each issuer, across all offerings during the considered period. Thus, amounts of proceeds per issuer may exceed
the 12-month offering limits. For an issuer that reported proceeds on both Tier 1 and Tier 2 offerings, the
offerings are allocated between the two categories as reported. The threshold for an issuer reaching the limit is
set at 99.9% of the maximum to allow for rounding.
13Table 5. Regulation A Issuer and Offering Characteristics 23
Variable Mean Median
Total assets $32,582,700 $311,500
Employees 38.9 2.5
Age (years since incorporation) 6.6 3.0
Revenue $2,642,800 $0
% revenue >0 47%
Net income -$490,100 -$14,000
% net income >0 21%
Cash and cash equivalents $1,842,700 $31,200
Property, plants, and equipment $4,677,200 $0
Long-term debt $5,758,900 $0
% continuous offerings 80%
% testing the waters 27%
% offerings with affiliate selling security holders 6%
States of solicitation 38 51
% equity offerings 24 93%
Although there was considerable heterogeneity among issuers, Table 5 shows that the
pool of issuers in qualified Regulation A offerings has so far has been dominated by small
relatively young issuers. Among issuers for which revenue information was available, just under
half of the issuers have generated revenue. 25 Turning to offering characteristics, most offerings
(93%) involved equity securities, were conducted on a continuous basis (80%), and did not
report sales by affiliated security holders (94%). Offerings were generally conducted on a best-
efforts basis. 26 Over a quarter of qualified offerings used testing the waters, almost all of which
23
Statistics are based on qualified offering statements. The information is based on Part I of Form 1-A of
Regulation A offering statements or latest amendment qualified during the considered period. See supra note
17.
24
Certain security types characterized as “other” were reclassified as equity or debt based on description.
25
Revenue information was not available for approximately 5.5% of issuers.
26
Information in Part I of Form 1-A across qualified offerings (or latest amendment qualified during the
considered period) indicates that 93% of the offerings reported being best-efforts offerings. Some of the
remaining offerings were associated with mergers and dividend reinvestment plans, while some others may
reflect inaccuracies in tagging. We are not aware of firm commitment underwriting in this market segment.
14were Tier 2 offerings. The median offering involved national solicitation by the issuer or
intermediary, but solicitation was generally limited to a handful of states in Tier 1 offerings
(median of three among qualified Tier 1 offerings).
During the considered period, the majority of Regulation A issuers lacked a liquid
secondary trading market for their securities. Table 6 and Figure 3 summarize data on secondary
trading markets for Regulation A issuers. Some commenters have noted that state registration
requirements for secondary market transactions in Regulation A securities limit liquidity in the
Regulation A market. 27
Table 6. Secondary Trading Market of Regulation A Issuers 28
Market Issuers %
Exchange listing 29 11 3.2%
OTC quotation 30 75 21.7%
OTCQX/OTCQB 14 4.0%
OTC Pink 61 17.6%
No market identified 260 75.1%
27
See, e.g., Advisory Committee on Small and Emerging Companies: Recommendations Regarding Secondary
Market Liquidity for Regulation A, Tier 2 Securities (May 15, 2017), available at
https://www.sec.gov/info/smallbus/acsec/acsec-recommendation-051517-secondary-
liquidityrecommendation.pdf.
The 2019 Small Business Forum also recommended that the Commission provide for blue sky preemption for
secondary trading of securities issued in Tier 2 offerings. See 2019 Forum Report, at 10.
State registration requirements for secondary market transactions are not applicable to Regulation A securities
listed on a national securities exchange. See Concept Release, at Section V.B.2.
28
There were 346 issuers in offerings qualified during the considered period.
29
Information on exchange listing was based on searches of CERT submissions and news searches and excludes
issuers delisted as of December 31, 2019.
30
Information on OTC quotation was based on data from OTC Markets as of the end of December 2019. For
issuers with multiple classes of securities we cannot determine whether the class issued in a Regulation A
offering is quoted on the OTC market. Grey market issuers are excluded. Among securities quoted on the OTC
market, liquidity can vary significantly from issuer to issuer and is on average lower than the liquidity of
securities listed on major exchanges. Many filers mention a lack of a public market for their securities in their
disclosures.
15Market Issuers %
Total: 346 100%
Figure 3. Secondary Trading Market of Regulation A Issuers
No market identified 260
OTC quotation 75
OTC Pink 61
OTCQX/OTCQB 14
Exchange listing 11
There have been relatively few Exchange Act reporting company issuers relying on
Regulation A to date. 31 It remains unclear what impact such issuers’ reliance on Regulation A
will have on capital formation and investor protection. The potential economic effects of
reliance of reporting company issuers on Regulation A were discussed in the adopting release for
the 2018 amendments. 32
The industry distribution reflects a heavy concentration of offerings in the finance
sector. 33 Figure 4a summarizes the industry distribution of the amounts sought in qualified
31
The change to permit Exchange Act registrants to use Regulation A was adopted in December 2018 and
approximately 17 Exchange Act registrants sought to use Regulation A to conduct an offering in 2019, of which
11 of those offerings were qualified.
32
See 2018 Regulation A Release, at Section IV.
33
Issuers with primary SIC codes between 6000 and 6999 are classified as being in the finance sector.
16Regulation A offerings. Finance, insurance, and real estate accounted for 53% of financing
sought in qualified Regulation A offerings. Examining more granular SIC code data suggests
that financial issuers were frequently REITs and other real estate companies, other holding
companies, non-depository credit institutions, and commercial banks. The most common
industry among nonfinancial issuers in qualified offerings was business services (which includes
software), followed by chemicals.
Figure 4a. Capital Sought in Qualified Regulation A Offerings, by Issuer Industry 34
Figure 4b summarizes the industry distribution of the proceeds reported in Regulation A
offerings. The finance sector accounted for 79% of reported proceeds (with real estate issuers
accounting for 69% of all reported proceeds). The most common industry among nonfinancial
issuers was transportation equipment, followed by business services.
34
See supra notes 17 and 18. The industry is based on the primary SIC code as reported in Part I of Form 1-A or
the latest amendment to it.
17Figure 4b. Proceeds Reported in Regulation A Offerings, by Issuer Industry 35
Close to 50% of qualified offerings were by issuers incorporated in Delaware, with an
additional 13% by issuers incorporated in Nevada. As with reporting companies, headquarters
location often differs from the state of incorporation.
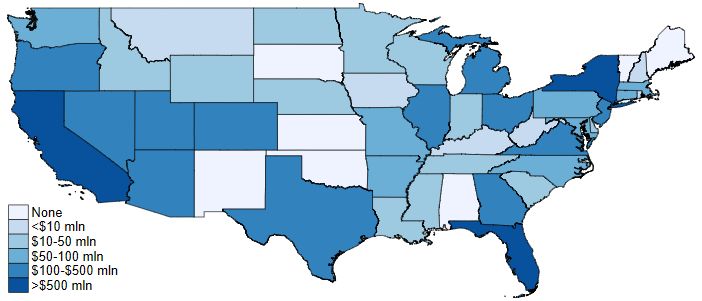
Figure 5a summarizes the geographic distribution of financing sought in qualified
Regulation A offerings, by state of issuers’ headquarters location. Issuers headquartered in
California accounted for 24% of the aggregate amounts sought, followed by Washington, DC
(16%) and Florida (9%). Figure 5b summarizes the geographic distribution of the proceeds
reported in Regulation A offerings, by state of issuer headquarters location. Issuers
headquartered in Washington, D.C. accounted for 36% of reported proceeds (due to one large
REIT sponsor headquartered in that area), followed by California (13%), and Utah (7%).
35
See supra note 18. The industry is based on the primary SIC code as reported in Part I of Form 1-A or the latest
amendment to it.
18Figure 5a. Capital Sought in Qualified Regulation A Offerings, by Issuer Location 36
Figure 5b. Proceeds Reported in Regulation A Offerings, by Issuer Location 37
D. Intermediaries in the Regulation A market
Below we discuss available information on the number of placement agents and brokers
facilitating Regulation A offerings. Intermediary involvement in Regulation A offerings has
been limited so far. This can pose hurdles for capital raising by small and first-time issuers,
36
See supra notes 16 and 17. The state of location is based on the state of headquarters location as reported in
Part I of Form 1-A or the latest amendment. The maps exclude Alaska, Hawaii, and U.S. territories. Those
areas did not have issuers with qualified Regulation A offerings during the considered period.
37
See supra notes 18 and 36.
19which tend to have potentially high information asymmetries and lower levels of investor
recognition. For approximately 32% of qualified offerings, Part I of Form 1-A reported the use
of an intermediary or fees to intermediaries, including approximately 26% of offerings in which
a registered intermediary was identified by name or CRD number. 38 Based on Form 1-A data for
those offering statements that identified a registered intermediary involved in the offering, close
to 40 registered intermediaries have participated in Regulation A offerings.
E. Investor Protection Considerations in the Regulation A Market
1. Federal, State, and Other Actions
Below we discuss available information on the number of Federal, State, or any other
actions taken against issuers, placement agents, or brokers with respect to both Tier 1 and Tier 2
offerings.
At the outset we note that our ability to quantify the severity of investor protection risks
in the Regulation A offering market is limited by several factors, including: a relatively small
sample size; latency of fraud (not all incidences may be detected or result in observable legal
actions); high business risk and failure rates of small and startup businesses under normal
conditions; and a lack of data on investor composition (e.g., we cannot observe the percentage of
investor money invested by accredited investors). Further, information gathered under the
existing offering limit and exemption structure may not be representative of investor risks and
magnitude of losses under a different regulatory structure (such as a different offering limit or
different investor protections for investors in Tier 1 versus Tier 2 offerings).
38
As a caveat, we observe variance in the completeness of information about intermediaries reported in Part I of
Form 1-A.
20During the considered period, there have been relatively few instances of legal
proceedings involving issuers or intermediaries relying on Regulation A, some of which remain
ongoing as of this writing. We have identified nine enforcement actions and administrative
proceedings undertaken by the Commission involving issuers or intermediaries involving or
relying on Regulation A, 39 and one group of actions by a state securities regulator against an
issuer and its intermediaries. 40 We have not identified any other state court actions or any
FINRA actions in the considered period, other than two FINRA actions resulting from the same
offerings that led to the above-referenced state court action. 41 Due to the small sample size and
differences in the circumstances associated with individual legal proceedings, some of which
39
See SEC v. Hologram USA Networks, Inc. and Alkiviades David, Civil Action No. 1:19-cv-09013 (S.D.N.Y.
filed Sep. 27, 2019) (“SEC V. Hologram”); BrixInvest, LLC (f/k/a Rich Uncles, LLC and Nexregen, LLC),
Release No. 33-10702 (Sep. 26, 2019); SEC v. Longfin Corp. and Venkata S. Meenavalli, No. 19-CV-5296
(S.D.N.Y. filed June 5, 2019); SEC v. Blockvest, LLC, 2019 U.S. Dist. LEXIS 24446 (Feb. 14, 2019); Punch TV
Studios, Inc., Release No. 33-10452 (Jan. 9, 2018); Strategic Global Investments, Inc., 34-81314 (Aug. 3,
2017); Web Debt Solutions, LLC, Release No. 33-10316 (Feb. 28, 2017); and Steven J. Muehler, Alternative
Securities Markets Group Corp., and Blue Coast Securities Corp., dba GlobalCrowdTV, Inc. and Blue Coast
Banc, Release No. 34-78118 (Jun. 21, 2016). See also Med-X, Inc., Release No. 33-10216 (Sept.16, 2016),
which temporarily suspended the exemption pursuant to Rule 258(a) and was subsequently vacated by In the
Matter of Med-X, Inc., Initial Decision Release No. 1130 (May 8, 2017).
Actions during the covered period involving issuer conduct that preceded the effectiveness of the 2015
amendments to Regulation A are excluded.
40
See Press Release, Colorado Division of Securities, Injunction granted and Receiver appointed in Division of
Securities case against Joseph David Ryan, Madyson Investments (Nov. 16, 2017), available at
https://www.colorado.gov/pacific/dora/securities-joseph-david-ryan-madyson-investments (“Colorado Division
of Securities Action”); Press Release, Colorado Division of Securities, David Joseph Ryan and Dennis Farrah of
Colorado Springs Arrested on Charges of Securities Fraud, available at
https://www.colorado.gov/pacific/dora/joseph-david-ryan-dennis-farrah-indicted-securities-fraud; and Press
Release, Colorado Division of Securities, Licenses Sanctioned for Two Representatives Who Sold Securities for
Madyson Capital Management, available at https://www.colorado.gov/pacific/dora/dennis-farrah-mark-raezer-
license-sanctions.
41
See Letter of Acceptance, Waiver and Consent from Mark Gregory Raezer to FINRA, FINRA Case ID
201805707500 (Jun. 25, 2018), available at
https://www.finra.org/sites/default/files/fda_documents/2018057075001%20Mark%20Gregory%20Raezer%20
CRD%206439772%20AWC%20jm%20%282019-1564186791168%29.pdf; and Letter of Acceptance, Waiver
and Consent from Dennis Mitchell Farrah to FINRA, FINRA Case ID 2018057111801 (Jun. 18, 2018),
available at
https://www.finra.org/sites/default/files/fda_documents/2018057111801%20Dennis%20Mitchell%20Farrah%2
0CRD%202703960%20AWC%20jm%20%282019-1563414570771%29.pdf.
21remain ongoing, we cannot infer a systematic relation between offer size and the incidence of
legal actions. 42
2. Issuer and Intermediary Characteristics
a. Regulation A issuer characteristics that may be correlated with risks to
investors
The staff continues to monitor the use of Regulation A and the potential investor risks in
connection with such offerings. For example, Regulation A offerings during the considered
period exhibited certain characteristics that have been discussed in the context of investor risks in
other markets, but we lack data to assess whether these characteristics will affect investor risks
and potential losses in the Regulation A market differently than in other markets.
Some of the characteristics associated with the typical Regulation A issuer to date may be
associated with higher risks to investors. Many of the issuers during the considered period were
development-stage or penny-stock companies without institutional ownership or research
coverage, characteristics that may be correlated with a higher level of risk. 43 Some of these
issuers do not provide ongoing reports, which can contribute to information asymmetries. 44
Most issuers do not have a liquid secondary market for their securities, which can make it
difficult for investors to sell their investment quickly without a loss of value.
42
Further, we recognize that larger offerings may result in larger potential aggregate losses in dollar terms.
However, very small offerings may draw issuers with a different risk profile and potentially result in higher
percentage losses of the invested capital.
43
See United States Securities and Exchange Commission Office of Investor Education and Advocacy, Investor
Bulletin: Microcap Stock Basics (Part 3 of 3: Risk) (Oct. 21, 2016), available at
https://www.investor.gov/additional-resources/news-alerts/alerts-bulletins/investor-bulletin-microcap-stock-
basics-part-3-3. Offering limits may discourage larger issuers from using Regulation A. Further, larger issuers
that seek a public market and are able to meet listing requirements may prefer a traditional registered offering
with an exchange listing that may achieve better recognition among analysts and institutional investors.
44
This consideration is applicable to Tier 1 issuers that are not required to provide periodic reports; Tier 2 issuers
that are eligible to terminate periodic reporting; and Tier 2 issuers that are not eligible to terminate periodic
reporting but that are not compliant with periodic reporting obligations.
22Recently, some concerns have emerged regarding Regulation A issuers that obtained an
exchange listing. 45 Nasdaq has amended listing eligibility requirements for Regulation A
companies seeking a Nasdaq listing to require issuers to have a minimum operating history of
two years at the time of approval of its initial listing application. 46 Nasdaq stated in its proposal
that “it has observed problems with certain companies listing on the Exchange in connection
with an offering under Regulation A” and also noted, among other things, that “Regulation A
offering statements have lighter disclosure requirements as compared to a traditional initial
public offering on Form S-1.” 47
Some Regulation A issuers have restated their financial statements. 48 Some issuers in
Tier 2 offerings appear to not have filed, or to not have timely filed, their periodic reports. We
lack the data to systematically assess the potential effects of these factors on Regulation A
investors.
45
See Tom Zanki, Reg A+ ‘Mini-IPOs’ Face Market Resistance, Law360 (Feb. 23, 2018), available at
https://www.law360.com/articles/1015536/reg-a-mini-ipos-face-market-resistance; and Tom Zanki, SEC
Approves Nasdaq Plan to Raise Reg A+ Standards, Law360 (Jul. 1, 2019), available at
https://www.law360.com/articles/1174572/sec-approves-nasdaq-plan-to-raise-reg-a-standards.
46
See Order Granting Approval of a Proposed Rule Change to Adopt Additional Requirements for Listings in
Connection with an Offering under Regulation A of the Securities Act, Release No. 34-86246 (Jun. 28, 2019)
[84 FR 32245 (Jul. 5, 2019)].
47
Id.
48
Based on a search of filings by issuers with Regulation A offering statements qualified and not withdrawn as of
December 2019, checked against Ives Group’s Audit Analytics restatements dataset (with disclosure dates
ending December 31, 2019), excluding restatements referencing fiscal periods ending prior to 2014, we
identified 21 issuers that restated their financials on or after the first Regulation A offering statement filing date,
of which 15 restated their financials after the initial qualification (i.e., after investment commitments could be
accepted). This amounts to 6% of issuers (21 / 346) issuing restatements or 4% (15 / 346) of issuers issuing
restatements after qualification. Of the issuers with restatements, the majority had a negative effect. By
comparison, during the considered period approximately 1,078 out of 14,325 (7.5%) unique issuers with
registration statements declared effective (identified from EDGAR filings) issued restatements. As a caveat for
interpreting these estimates, we cannot observe if the likelihood of issuing a restatement, conditional on having
irregularities in financial statements, is comparable for Regulation A issuers and for issuers in registered
offerings.
23Further, some Regulation A offerings have involved lines of business that may be
associated with higher risk. For example, a large share of proceeds reported raised in Regulation
A offerings during the considered period involved real estate issuers (69% of proceeds reported
in ongoing and completed offerings). 49
As an important caveat, if the issuers with the described risk profile did not rely on
Regulation A, it is plausible that they might have instead relied on other exemptions from
registration or a registered offering.
b. Regulation A intermediary characteristics that may be correlated with
risks to investors
Some of the intermediaries involved in Regulation A offerings are associated with
potential risks to individual investors. Regulation A offerings are not required to be conducted
via registered intermediaries, and various Regulation A issuers have solicited prospective
investors via unregistered entities, such as finders, promoters, marketing platforms, and other
third parties that are not registered with the Commission or FINRA. 50 The use of unregistered
intermediaries poses potential investor protection concerns because of the absence of regulatory
framework for such intermediaries’ practices and involvement in offerings. We lack data to
49
We cannot rule out the possibility that real estate issuers, most of which relied on Tier 2, provided timelier
updates of proceeds raised, relative to other issuers.
See also FINRA, Investor Alert: Public Non-Traded REITs—Perform a Careful Review Before Investing (last
updated Nov. 30, 2016), available at http://www.finra.org/investors/alerts/public-non-traded-reits-careful-
review. However, Regulation A real estate offerings, on a per-offering and aggregate basis, were significantly
smaller than nontraded registered real estate offerings. See infra note 74. Almost all Regulation A real estate
offerings relied on Tier 2, which subjects issuers to semi-annual (rather than quarterly) reporting and
nonaccredited investor investment limits (the higher of 10% of annual income or net worth per offering).
However, Tier 2 offerings are exempt from state registration requirements — including investor suitability
standards — that typically apply to nontraded registered offerings.
50
This observation relies on the advertising of Regulation A offerings, including offerings that are in the testing-
the-waters stage, on online platforms and such platforms’ disclosure that Regulation A offerings advertised on
them do not involve a registered broker-dealer or investment adviser. Because of variance in the completeness
of information on the participation of unregistered intermediaries and other third parties involved in advertising
the offering, we are unable to form a reliable estimate of their prevalence in the Regulation A market.
24evaluate whether the involvement of unregistered intermediaries has resulted in additional risks
to investors in Regulation A offerings during the considered period, compared to other offerings,
such as private placements in reliance on Section 4(a)(2) or Regulation D, that also may involve
unregistered intermediaries.
Some registered intermediaries engaged in Regulation A offerings make disclosures of
prior actions, including, in some instances, violations of FINRA or other rules. With the caveat
about data availability, 51 among offerings where the use of a registered intermediary was
disclosed, the intermediary had at least one disclosure 52 on FINRA’s BrokerCheck website in
approximately 36% of cases.
3. Consideration of Additional Investor Protections
Based on the few legal proceedings during the considered period, the staff’s experience
with reviews of offering materials, and feedback from market participants, it is not clear that
additional investor protections are necessary at this time. The staff has identified one
inconsistency in the treatment of Regulation A issuers that are Exchange Act reporting
companies compared to other Regulation A issuers. Specifically, Regulation A includes an
eligibility requirement that an issuer conducting a Regulation A offering must have filed with the
Commission all reports required to be filed, if any, pursuant to Rule 257 during the two years
before the filing of the offering statement (or for such shorter period that the issuer was required
to file such reports). 53 Because Exchange Act registrants are not required to file reports pursuant
51
See supra note 38 and accompanying text.
52
Disclosures are broadly defined to include “customer complaints or arbitrations, regulatory actions, employment
terminations, bankruptcy filings and any civil or criminal proceedings that they were a part of.” Larger broker-
dealers or broker-dealers that have been registered for a longer period of time may have more disclosures.
53
17 CFR 230.251(b)(7). Rule 257 requires issuers conducting Tier 2 offerings to comply with certain ongoing
and periodic reporting requirements.
25to Rule 257, the existing eligibility provision does not expressly require those registrants to have
filed their Exchange Act reports in order to rely on Regulation A.
The Commission could amend the eligibility restrictions of Regulation A with respect to
Exchange Act filers such that a delinquent Exchange Act filer would be ineligible to rely on the
exemption. Such a change would hold Exchange Act reporting company issuers to the same
standard as repeat Regulation A issuers. This requirement would benefit investors by ensuring
that they have access to historical financial and non-financial statement disclosure about
Exchange Act reporting companies that are conducting Regulation A offerings and may facilitate
the development of an efficient secondary market for the securities they purchase in Regulation
A offerings. Furthermore, because they are already required to file such reports, such a
requirement would not increase the burden of making a Regulation A offering for Exchange Act
reporting companies or companies that were Exchange Act reporting companies within the two
years prior to making a Regulation A offering.
F. Offering Limit Review Analysis
We believe that the general economic tradeoffs associated with setting an offering limit
for Tier 1 and/or Tier 2 offerings discussed in the economic analysis of the 2015 amendments
continue to apply. 54 Below we present information from public comment; updated data on the
use of Regulation A, inflation adjustment analysis, and an analysis of offerings relying on other
offering methods without an offering limit during this period.
1. Evidence from Public Comment
In the 2015 Regulation A Release, the Commission noted that some commenters
suggested that the Commission raise the proposed $50 million Tier 2 offering limit to an amount
54
See 2015 Regulation A Release.
26above the statutory limit set forth in Section 3(b)(2); however, the Commission did not believe
an increase was warranted at the time. 55 The Commission explained that, while Regulation A
had existed as an exemption from registration for some time, the 2015 amendments were
significant. Accordingly, the Commission believed that the 2015 amendments would provide for
a meaningful addition to the existing capital formation options of smaller issuers while
maintaining important investor protections.
Since adoption of the 2015 amendments, the 2017 and 2018 Small Business Forums have
recommended that the Commission increase the maximum offering amount under Tier 2 of
Regulation A from $50 million to $75 million.56 A 2017 report by the Department of the
Treasury also recommended that the Tier 2 offering limit be increased to $75 million. 57
In the Concept Release, the Commission requested comment on whether to increase the
Regulation A offering limit. Comments were mixed, with some commenters supporting an
increase in the offering limit and others opposing an increase. Several commenters expressed
support for raising the Tier 2 offering limit to either $75 million or $100 million.58 Others were
55
See 2015 Regulation A Release, at text accompanying note 93.
56
See Final Report of the 2018 SEC Government-Business Forum on Small Business Capital Formation (June
2019) (“2018 Forum Report”), available at https://www.sec.gov/info/smallbus/gbfor37.pdf; and Final Report of
the 2017 SEC Government-Business Forum on Small Business Capital Formation (March 2018) (“2017 Forum
Report”), available at https://www.sec.gov/files/gbfor36.pdf.
57
See A Financial System That Creates Economic Opportunities - Capital Markets (October 2017) (“2017
Treasury Report”), available at https://www.treasury.gov/press-center/press-releases/Documents/A-Financial-
System-Capital-Markets-FINAL-FINAL.pdf.
58
See, e.g., letter from Committee on Securities Regulation of the Business Law Section of the New York State
Bar Association dated October 16, 2019 (“NYSBA Letter”) (supporting raising the threshold to $75 million and
noting “[t]he Regulation A market would benefit from the participation of additional institutional investors and
many institutional investors do not want to participate in smaller offerings where their holdings will constitute a
disproportionately large percentage of the outstanding securities.”); letter from CrowdCheck, Inc. dated October
30, 2019 (“CrowdCheck Letter”) (supporting raising the threshold to $100 million); letter from Goodwin
Procter LLP dated September 24, 2019 (“Goodwin Letter”) (supporting raising the threshold to $100 million);
letter from OTC Markets dated September 24, 2019 (supporting raising the threshold and noting the 2017 and
2018 Small Business Forum and 2017 Treasury Report recommendations to raise the threshold to $75 million);
27opposed to any change in the offering limits, noting that the current thresholds are already high
and expressing the view that the Commission needs to gather more data on how the exemption
affects investors before making any changes. 59
2. Evidence from Regulation A Market
Data on Regulation A issuers that have made offerings under Regulation A provide the
most relevant point of reference in our analysis of offering limits. This data is presented in
Tables 1 through 4 above. For most issuers, proceeds reported in Regulation A offerings were
significantly below the amounts sought and the twelve-month offering limits. 60 As shown in
Table 4, approximately 9% of issuers have reached the limit based on proceeds reported across
completed and ongoing offerings during the considered period. By comparison, approximately
34% of issuers reached the limit based on the maximum amount sought across all qualified
offerings. As an important caveat, this inference is based on the pool of issuers attracted to
and letter from Institute for Portfolio Alternatives dated September 24, 2019 (supporting raising the threshold to
$100 million).
59
See, e.g., letter from Xavier Becerra, California Attorney General, et al., dated September 24, 2019; letter from
Davis Polk & Wardwell LLP dated September 24, 2019 (indicating that “since the current thresholds are high
and larger offerings should benefit from full SEC protection.”); letter from the Council of Institutional Investors
dated October 3, 2019 (expressing its belief that "the Commission should not take any action to broaden or
expand the Regulation A+ exemption without compelling evidence that such a change would benefit long term
investors and the capital markets”); letter from Consumer Federation of America dated October 1, 2019
(suggesting that expansion of Regulation A has been bad for investors and markets); letter from Healthy
Markets Association dated September 30, 2019 (suggesting Regulation A is a “disaster for investors” that
should be curtailed or eliminated); and letter from North American Securities Administrators Association dated
October 11, 2019 (“NASAA Letter”) (generally rejecting expansion of the availability of private offerings and
recommending more oversight by state regulators).
60
We do not observe how issuers choose offer amounts sought. Offer amounts could reflect a combination of
financing needs and market demand. Some issuers may set offer amounts equal to the amount they need to
raise, while others may select the highest amount they may require over time, treating it as a shelf offering (e.g.,
to preserve the flexibility to raise more capital in the future if their financing needs expand). Others may set
offer amounts below their financing needs to avoid an undersubscribed offering, with a plan to raise additional
capital in a follow-on offering. In the absence of a public market or an underwriter for the majority of offerings,
issuers may misjudge market demand or investor valuations of their company, causing proceeds to be
significantly below amounts sought. Since the majority of offerings are conducted on a continuous basis,
adverse changes in market conditions subsequent to offering qualification may also cause proceeds to be below
amounts sought.
28Regulation A with the provisions that are in place today. It is likely that issuers would forgo
Regulation A as a pathway to raising capital if the current offering limit is too low for their
financing needs.
An increase in the Tier 1 offering limit could draw more issuers to Tier 1, some of which
might be switching from Tier 2. However, they also might not choose to switch to Tier 1 if they
find Tier 2 to be more attractive (e.g., due to preemption of state review or greater confidence
and easier path to quotation on the upper tiers of the OTC market in the presence of periodic
reports required by Tier 2). For example, from June 2015 through December 2019, we estimate
that 112 Tier 2 issuers reported raising up to $20 million in financing under Regulation A even
though that amount would have made them eligible to use Tier 1 as well. Further, if the Tier 2
offering limit remains higher than the Tier 1 offering limit, some issuers might prefer Tier 2
because the higher maximum offering amount provides issuers with the flexibility to raise more
capital without having to undergo a re-qualification (e.g., if market conditions improve) even if
the typical issuer’s proceeds do not reach the amount sought.
Certain features of the data and the market limit our ability to draw definitive
conclusions. First, the number of Regulation A issuers during the considered period was
relatively small in absolute terms, 61 which can make statistics less reliable. As discussed above,
we estimate that during the considered period 442 issuers filed offering statements, of which 346
issuers had at least one offering qualified.
61
It is difficult to attribute this pattern to a single cause. Some possibilities include, but are not limited to, lack of
market familiarity with this offering method, adverse selection in the issuer pool, lack of underwriter interest,
difficulty in attracting investors in the presence of limited secondary market liquidity, costs to initiate an
offering in proportion to offering limits, eligibility requirements, and favorable conditions in the private
placement market.
29Second, information about offering proceeds, which indicates whether the offering limit
constrains existing issuers’ ability to raise financing, is incomplete, particularly for more recently
qualified offerings. 62 Among 346 issuers with qualified offering statements, we identified 183
(53%) that reported non-zero proceeds in completed or ongoing offerings as of December 2019.
We cannot conclusively determine from a review of filings whether the remaining offerings have
effectively ended or remain in progress. 63 Further, among the filers reporting positive proceeds,
for approximately 52% the proceeds information is partial because offerings remained ongoing
as of the time of the filing, thus proceeds for such issuers are likely to be revised upward in the
future.
Third, the considered period was characterized by a specific set of aggregate conditions
(including a favorable interest rate environment, strong equity market performance, a high rate of
private placement activity, and a comparatively low rate of registered initial public offerings),
62
Most offerings are conducted on a continuous basis, thus a period of time is likely to elapse between offering
initiation and initial or final closing or termination. Issuers are afforded a period of time for reporting offering
proceeds. Tier 1 issuers must provide information about sales and update certain issuer information by
electronically filing a Form 1-Z exit report with the Commission not later than 30 calendar days after
termination or completion of an offering. Tier 2 issuers must include in their first annual report after
termination or completion of a qualified Regulation A offering, or in their Form 1-Z exit report, information
about sales in the terminated or completed offering. Therefore, some issuers that have completed offerings
during the considered period might not have reported offering proceeds. For many filers of qualified Tier 1
offering statements, a report of proceeds is not available. For many filers of qualified Tier 2 offering
statements, information about proceeds is not discussed in periodic reports. Information collection is also
affected by variance across filers in disclosure and tagging practices with respect to proceeds reporting. For
Tier 2 filers that report proceeds in ongoing offerings, the amounts underestimate total proceeds likely to be
raised upon offering completion.
63
Some of these issuers may have ongoing offerings but not provide information on offering status in disclosures.
Tier 1 issuers are not required to file periodic reports or provide interim information on proceeds in an ongoing
offering. Tier 2 issuers are required to file periodic reports but interim offering progress updates are not
required. Reporting of proceeds in the XML portion of Form 1-K is generally incomplete. While some Tier 2
issuers describe Regulation A offering proceeds in the Management’s Discussion and Analysis (e.g., if it is
material for describing the issuer’s liquidity and capital resources), others may aggregate Regulation A offering
proceeds with proceeds from other sales of the issuer’s securities or may not file periodic reports.
Other issuers with no offering status information may have effectively ended the offering with no proceeds but
have not made a subsequent filing with that disclosure (e.g., a report of zero proceeds on Form 1-Z or a request
to terminate / withdraw the previously qualified offering).
30You can also read