Research - Universidade ...
←
→
Page content transcription
If your browser does not render page correctly, please read the page content below
Research

                                         Search for factors associated with evasion: a case
                                         study in UFC University Campus in Crateús

                                         Carlos Henrique Mendes de Oliveira¹        , Francisco Raul Teixeira Santos²   ,
                                         Janaina Lopes Leitinho³       , Luisa Gardênia Alves Tomé Farias4
                                         ¹ ² ³ 4 Universidade Federal do Ceará

                                         ABSTRACT
                                         Due to the low number of Brazilians with higher education and it is related
                                         to the country's lower development, school dropout becomes the epicenter
                                         of major problems: retention of national technological growth, continuity of
                                         social problems and economic waste. There are many explanatory models
                                         for evasion, however each locality has its own peculiarities as to the real
                                         causes of this event, and therefore such studies at the local level are
                                         essential for the creation of public coping policies. Therefore, a study was
                                         carried out with 63 students evaded from the Crateús campus of the Federal
                                         University of Ceará (UFC) in order to analyze the causes of evasion through
                                         an exploratory and confirmatory factorial analysis. After the analysis, it is
                                         possible to confirm the main reasons for this event, such as frustration due
                                         to academic performance, altered mental health, lack of willingness to
                                         attend the chosen graduation, lack of family support, lack of commitment to
                                         graduation etc. Therefore, there is an urgent need for a union between
                                         various public institutions, such as education, health and safety institutions,
Corresponding Author
                                         in order to face the roots of evasion.
¹ Carlos Henrique Mendes de Oliveira
E-mail: carlosh.m.oliveira@live.com
Universidade Federal do Ceará, Brasil
                                         KEYWORDS
CV Lattes
                                         Evasion. Exploratory factorial analysis. Confirmatory factorial analysis
http://lattes.cnpq.br/4294192074218940

Submmited: 9 jul. 2018
Accepted: 24 jul. 2018
Published: 10 out. 2018

      10.20396/riesup.v5i0.8652897
e-location: e019006
ISSN 2446-9424

        Anti-plagiarism check

           Distributed under

                                                                                                                            1
   © Rev. Inter. Educ. Sup.          Campinas, SP      v.5        1-23             e019006                   2019
Research

Busca dos fatores associados à evasão: um estudo de caso no Campus
Universitário da UFC em Crateús

RESUMO
Em razão do baixo número de brasileiros com ensino superior e isso estar relacionado com o menor
desenvolvimento do país, a evasão escolar se torna o epicentro de grandes problemas: retenção do crescimento
tecnológico nacional, continuidade dos problemas sociais e desperdício econômico. São muitos os modelos
explicativos para a evasão, no entanto cada localidade tem suas próprias peculiaridades quanto as reais causas
desse evento, e por isso tais estudos, no âmbito local, são essenciais para criação de políticas públicas de
enfrentamento. Diante disso, realizou-se uma pesquisa com 63 estudantes evadidos do campus Crateús da
Universidade Federal do Ceará (UFC) no intuito de analisar as causas da evasão por meio de uma análise fatorial
exploratória e de uma confirmatória. Após a análise é possível confirmar os principais motivos desse evento,
como a frustração pelo desempenho acadêmico, alteração da saúde mental, a falta de vontade de cursar a
graduação escolhida, a falta de apoio familiar, a falta de comprometimento com a graduação etc. Portanto, é
urgente a necessidade de união entre diversas instituições públicas, como instituições de ensino, de saúde e de
segurança, visando enfrentar as raízes da evasão.

PALAVRAS-CHAVE
Evasão. Análise fatorial exploratória. Análise fatorial confirmatória.

Busquedá de los factores asociados a la deserción escolar: un estudio de
caso em el Campus Universitario de la UFC em Crateús
RESUMEN
Debido al bajo número de brasileños con enseñanza superior y esto estar relacionado con el menor desarrollo del
país, la deserción escolar se convierte en el epicentro de grandes problemas: retención del crecimiento
tecnológico nacional, continuidad de los problemas sociales y desperdicio económico. Son muchos los modelos
explicativos para la deserción, sin embargo, cada localidad tiene sus propias peculiaridades en cuanto a las reales
causas de este evento, y por ello tales estudios, en el ámbito local, son esenciales para la creación de políticas
públicas de enfrentamiento. Ante esto, se realizó una investigación con 63 estudiantes desertores del campus
Crateús de la Universidad Federal de Ceará (UFC) con el objetivo de analizar las causas de la deserción por medio
de un análisis factorial exploratorio y de un confirmatorio. Después del análisis es posible confirmar los principales
motivos de este evento, como la frustración por el desempeño académico, alteración de la salud mental, la falta de
voluntad de cursar la graduación elegida, la falta de apoyo familiar, la falta de compromiso con la graduación, etc.
Por lo tanto, es urgente la necesidad de unión entre diversas instituciones públicas, como instituciones de
enseñanza, de salud y de seguridad, con vistas a hacer frente a las raíces de la deserción.

PALABRAS CLAVE
Evasión. Análisis factorial exploratorio. Análisis Factorial Confirmatorio.

                                                                                                                         2
   © Rev. Inter. Educ. Sup.        Campinas, SP       v.5        1-23           e019006                 2019
Research
Introdution
The system of expansion and internalization of public higher education in Brazil has
been providing the extension of access to the university by students of different social classes.
One of the policies used by the federal government in the last decades focuses on the
expansion of the Federal Higher Education Network through the internalization of education.
The "Expand" Program (2003) established by Decree 6096/2007 was one of the main
responsible for increasing the vacancies in the public higher education system and the number
of Federal Institutions of Higher Education (IFES) in the country.
The federal higher education system, with a view to increasing access to university,
promoting social inclusion and reducing regional inequalities, "has as main goals proposed by
the program the main objective of expanding the system in the period 2003 to 2014 consisting
of implanting 63 new Federal Universities, besides consolidating and / or installing 321
campuses, mainly in the interior of the Brazilian states. Only in the Northeast region 6 new
universities and 60 campuses were created or consolidated during this period (National
Institute of Educational Studies and Research Anísio Teixeira-INEP, 2014), which resulted in
the offer of 41,465 new vacancies in higher education in this region. It should be noted that
the expansion of enrollment and enrollment in the aforementioned region prioritized the
displacement of these institutions to the most economically disadvantaged places and with
less coverage in higher education (INEP, 2011).
As a result of the goals of the "Expand" Program, the advanced campus of the Federal
University of Ceará in Crateús was implemented, having its activities started in the second
half of 2014, with the Computer Science course, and, by 2015, courses in Civil Engineering,
Environmental Engineering and Information Systems. In 2016, the course of Mining
Engineering entered the hall of the courses offered by the campus. The implementation of
these five courses in the City of Crateús mitigated the needs created by postmodern society,
which demands a greater number of professionals of the exact sciences and technology with
good qualification.
For some authors (BRITTO et al., 2008, p.778; SILVA, 2011), the quantitative growth
of higher education presents itself as a possible access to the elucidation of the new university
reality. According to Britto et al. (2008), the process known as "massification of access"
incurs the massive abundance in higher education of a "new student", "from a social segment
that until recently had no access to Higher Education and which normally has conditions of
limited study and little coexistence with intellectual and artistic objects of the hegemonic
culture ". For the aforementioned authors, this process occurs too much in the peripheral
HEIs. The "new scholar" that arrives at HEIs is, according to these authors,
[...] largely belonging to the first generation of long schooling and coming from a
social segment whose first expectation is to graduate to the mid-level job market,
does not have the appropriate conditions to study, has primary school education and
insufficient average and little coexistence with the intellectual and artistic objects of 3
the hegemonic culture; in addition, he most often works during the day and attends
© Rev. Inter. Educ. Sup. Campinas, SP v.5 1-23 e019006 2019Research
night classes, with little time and resources to participate in academic activities that
transcend classroom space, rarely participating in cultural outreach activities,
research activities, scientific meetings, etc. These factors, although more often than
not are not supplied by school education, strongly influence the intellectual practices
and the evaluations that take place within them (BRITTO et al., 2008, p. 788).
According to data from the Higher Education Census, released by the Ministry of
Education (MEC) in October 2017, 34,366 undergraduate courses were offered in 2,407
institutions of higher education in Brazil, resulting in a quantitative of more than 10.6 million
vacancies in undergraduate courses, 73.8% new and 26.0%, remaining. Of the new offerings,
33.5% were filled, while only 12.0% of the last ones were filled in the same period (CENSO-
INEP, 2018).
Even with the policies to increase public vacancies in public higher education, the data
provided by CENSO indicate that there was a stagnation in the number of graduates in the
year in question when compared to the year 2015. In sum, according to CENSO, there are
more than 140 thousand vacancies in the federal education system, which makes it imperative
to plan policies to occupy these vacancies. In addition to this worrying issue, there is still the
issue of avoidance, which needs to be addressed, since the rate in the country is considered
extremely high (MENEZES FILHO, 2018).
According to data from the Higher Education Census, published by INEP, the dropout
rates of Brazilian higher education are worrying. The data showed that 49% of students who
entered higher education in 2010 dropped out of courses within a five-year cluster. In private
institutions, evasion reached 53%, and public institutions reached 47% in municipal, 38% in
state and 43% in federal ones (CENSO-INEP, 2018).
Undoubtedly, there are several motivations that contribute to this situation, with
multiple meanings depending on the region of the country, the type of institution (whether
public or private), the academic organization (university, university center, colleges, institute
or campuses). , of the modality of teaching (presence and distance) (BARDAGI & HUTZ,
2012).
Some elements are antecedent to academic life itself, such as the lack of basic
education and the circumstances involved in course selection, which are not always supported
by graduation. Other financial, socio-emotional and pedagogical factors also contribute to
avoidance, especially in the early periods.
Certain authors mention that the difficulties of setting up university life, of planning
academic routines and of identifying the chosen course, such as the social-emotional causes
that contribute to the abandonment, especially in the initial months. In addition, the aspects
related to inadequate pedagogical models, difficulties with the methodologies adopted in the
subjects and the low academic performance of the student respond as some of the pedagogical
factors for avoidance (PEREIRA, 2003; FEY, LUCENA; FOGAÇA, 2013).
In view of the foregoing, it is imperative to measure and discuss the phenomenon of
evasion in higher education, especially in the campuses implanted by the interiorization
4
© Rev. Inter. Educ. Sup. Campinas, SP v.5 1-23 e019006 2019Research
process of teaching. It should be emphasized that this level of education needs to be evaluated
on a case-by-case basis, since the motivation for leaving academic life may change according
to academic organization, courses, regions, age and so on.
In an attempt to determine the intracranial factors that are involved in the evasion
phenomenon at the campus of the UFC in Crateús, a survey was carried out, through the
Integrated System of Management of Academic Activities (SIGAA), with the purpose of
compiling some data regarding cancellation fees enrollment and failure in the subjects of the
first semester of the courses, in the period between the second half of 2014 to 2017. It is
pertinent to point out that this period coincides with the entry of the first groups and also the
process of implementation of this campus, that during this period different circumstances
were experienced, such as lack of professionals, basic didactic material and lacking
infrastructure.
Table 1 shows the main failure rates per year of the first semester courses. It is noticed
that the high retention rates in the subjects in question can be related to the avoidance in the
campus.
Table 1. Main failure rates in the first semester courses in the period from 2014 to 2017.
Discipline Failure Rate
Pre-Calculation 68,2%
Probability and Statistics 67,9%
Fundamentals of Programming 62,7%
Introduction to Computer Science and Information Systems 62,5%
Computational Programming and Introduction to Numerical 62,2%
Calculus
Basic Mathematics 61,8%
Fundamental Physics 60,4%
General Chemistry 54,9%
Fundamental Calculation 54%
Source: SIGAA
Table 2 shows the number of canceled enrollments per year for newly deployed
campuses in the interior of the State of Ceará.
Table 2. Percentage of canceled enrollments of incoming students in 2015.
Campus % of canceled enrollments
Crateús 46%
Russas 27%
Source: SIGAA
It is clear that the campus of Crateús is the one with the largest number of canceled
enrollments in the same period compared to that of Russas (JALLES, 2017).
5
© Rev. Inter. Educ. Sup. Campinas, SP v.5 1-23 e019006 2019Research
In addition, it is possible to see the number of canceled enrollments per course
between 2014 and 2017 in Table 3.
Table 3. Number of canceled enrollments, per course, in the period from 2014 to 2017.
Courses 2014 2015 2016 2017
Civil Engineering - 2 4 5
Environmental Engineering - 7 5 11
Mining Engineering - - 4 9
Information Systems - 7 7 11
Computer Science 7 8 9 3
Source: SIGAA
It should be noted that the canceled enrollments refer only to students who formally
drop out of their place in the HEI, and the small number of them is due to the fact that drop-
out is mainly due to abandonment, a phenomenon in which concrete data are not yet available
for the Campus Crateús. Despite the absence of abandonment data, it already reached high
levels, which made the site in question develop specialized projects to combat the
phenomenon of evasion. Thus, in the attempt to understand it on the campus of the UFC in
Crateús, through research, the theoretical and statistical approach, and the consistent
proposition of its causes, is that this work is justified.
Theoretical Reference
Evasion is undoubtedly one of the deadlocks that are worrying educational institutions
in general. The search for its causes has been an instrument of many studies and educational
research. This is a complex social phenomenon and is defined, according to the MEC / INEP,
with the following classification of the concepts:
Evasion of course: when the student disconnects from the upper course in various
situations such as: abandonment (no enrollment), withdrawal (official), transfer or
reopening (change of course), exclusion by institutional norm;
Evasion of the institution: when the student disconnects from the institution in
which he / she is enrolled;
Evasion of the system: when the student leaves permanent or temporary higher
education (BRASIL, 1997, p. 20).
This phenomenon is an international problem that affects the results of educational
systems, causing serious disruption to educational institutions, since students who are
paralyzed or dropping out of school are a huge loss to society, constituting a situation of
social, economic waste and academic, leaving teachers, employees, materials and physical
space in leisure (SILVA FILHO et al., 2007).
6
© Rev. Inter. Educ. Sup. Campinas, SP v.5 1-23 e019006 2019Research
It`s also relevant that the Brazilian HEIs that have a specialized institutional program
to combat evasion are unique. According to Silva Filho et al. (2007), avoidance must be
understood under two similar, but not congruent, aspects:
1. The average annual dropout measures the percentage of students enrolled in an
education system, an HEI, or a course which, having not graduated, did not enroll in
the following year (or the to follow what happens in semester courses). For
example, if an HEI had 100 students enrolled in a course that could renew their
enrollment in the following year, but only 80 did so, the average annual drop in
course would be 20 percent.
2. Total dropout measures the number of students who, having entered a particular
course, IES or education system, did not obtain the diploma after a certain number
of years. It is the complement of what is called titration index. For example, if 100
students entered a course in a given year and 54 graduated, the titration rate is 54%
and dropout in that course is 46%.
For Baggi (2011), the analysis of dropout is also associated with the debate on the
quality of teaching, emphasizing that this causes, in some cases, the permanent loss of the
student. According to Baggi (2011), the study of evasion is a vast and complex field, which
involves pedagogical, psychological, social, political, economic and administrative issues,
among others.
Other studies carried out on the subject, considering the lack of consonance, present
several interpretations. However, research indicates that the shorter stay in higher education
of the less favored classes is strongly intertwined with the absence of aids to the student's
permanence (KOWALSKI, 2012) and the very small "cultural capital" (GISI, 2006) acquired
in basic training, which is directly linked to academic performance. Other authors also
highlight the failure in disciplines considered difficult (FREGONEIS, 2002) and
disinformation about the course, job market and personal skills (ANDRIOLA, 2003) as being
highly relevant factors for avoidance.
These different conceptions of the evasion phenomenon increase the difficulties that
researchers face in investigating this theme, a virtue that the definitions used are capable of
compiling cases with different school destinations in the same mode of evasion. The factors
that lead a student to leave a particular course may lead him to enter another, so it is
imperative that in the research on the above phenomenon, there is a clarification of the
conception of analysis addressed, with the purpose of providing subsidies for the elaboration
of comparisons.
It should also be noted that, in addition to these various conceptual definitions, the
investigation of the evasion phenomenon must be based on the different mathematical
treatments of the object of study. For Lima (2018), there are interpretations or calculations in
which the retention data may be included in the avoidance indices.
As mentioned, this phenomenon worries institutions and researchers in the area. More
recent data (INEP, 2018) revealed that the evasion rate increased wildly as of 2010. In public
education, the total evasion rate is 19.18%, calculated by: 7
© Rev. Inter. Educ. Sup. Campinas, SP v.5 1-23 e019006 2019Research
This rate is worrying and reveals the unpreparedness of institutions with specialized
programs to combat this phenomenon. The number of enrollments in higher education in
2016 (most recent data) was 8,048,701 students, of which 1,990,078 were in public
institutions. Considering the average rate of evasion for public universities, about 381,673
public university students escaped from their entry course in 2016.
To analyze the seriousness of the situation, it is important to note that only 24.20% of
young people between the ages of 18 and 24 attend higher education, one of the lowest
among developing countries, according to the OECD (Organization for Economic Co-
operation and Development). In addition, only 14% of the Brazilian population has completed
higher education, while other countries have a higher percentage: Chile (21%), Colombia
(22%), Costa Rica (23%), Mexico), Canada (53%), Russia (54%), etc. (OECD, 2017). In
view of the aforementioned data, it is clear that the evasion of 381,000 students (only in
public universities) is a highly relevant problem for Brazilian society, and especially for
campis installed through internalization of higher education, since there is a forecast of
reductions in the number of enrollments from 2016, given the current economic situation, by
some institutions.
As shown, dropout in higher education reflects the ineffectiveness of IFES in coping
with this phenomenon. In the intention to collaborate with discussion about the subject is that
this work is objectified. The proposal is to elucidate the reasons for the evasion at the Campus
of the UFC in Crateús, through the exploratory factorial analysis, besides proposing public
policies to combat the phenomenon, since to detect the causes of the evasion in a determined
educational institution is the first step to combat it (SILVA FILHO et al., 2007).
Method
Elaboration of the Questionnaire and Data Collection Procedure
In order to meet the research purposes, a qualitative structured questionnaire
containing 24 questions was elaborated and applied to a study population of 63 students
evaded from the UFC Campus in Crateús. The questions proposed for the questionnaire are of
the type-likert type containing 5 options: totally disagree, disagree, neutral (neither disagree
nor agree), agree and totally agree. The elaboration of these questions was based on the
studies of the Integration Scale to Higher Education (POLYDORO et al., 2001), since the
methodology of construction and validation of the model has already been done by the same,
and is available in Appendix A.
It should be emphasized that the decision not to apply a multiple choice questionnaire
and simply to choose one or another reason for student avoidance was prudent, since applying
8
© Rev. Inter. Educ. Sup. Campinas, SP v.5 1-23 e019006 2019Research
a questionnaire that measures the intensity of several factors in the decision to evade,
(POLYDORO et al., 2001). In this paper, we present the results of the study of the students'.
The small sample size of the research (63 evaded students) is due to the fact that the
campus of Crateús was recently implemented (second half of 2014), a fact that does not
invalidate the application to the methods of analysis, once the sample has a portion
population. It is worth emphasizing that the analyzes carried out are independent of the
course.
Exploratory Factorial Analysis
As it was presented, evasion is a complex social phenomenon and in this sense,
elucidating the various factors that instigate a student's decision to abandon a higher
education is enigmatic. In this way, it is necessary to collect and interpret observations of
many different variables and for these cases, multivariate analysis is a widely used variable
(PEREIRA et al., 2004; HAIR JR. et al., 2006). Among these existing multivariate techniques
to model the independence of the data, the factorial analysis was selected for the one referring
to the data of this work.
Factor analysis describes, if possible, the covariance relationship of many variables in
terms of factors - item correlations and reduction of variables in common latent dimensions.
Among the applications of the technique of this analysis, we emphasize: to moderate the
number of variables and to identify the structure of the relationships between the variables,
that is, to classify the variables.
Suppose that the variables can be grouped by their correlations. Suppose, further,
that the variables within a particular group have a high correlation between them,
but have a small correlation with the variables in different groups. Each group of
variables represents a factor, which is responsible for the correlations observed
(JOHNSON & WICHERN, 1998, page 514).
Pasquali (2009) states that the reduction maximizes the explanatory power of the set
of all variables and makes it possible to identify subgroups of questions that evaluate the
same ability.
In order to verify the determinants that influence the evasion in the campus of Crateús,
we tried to understand how the factors are related to the personal characteristics of the
student, the institution and the market in the instrument of data collection.
Results
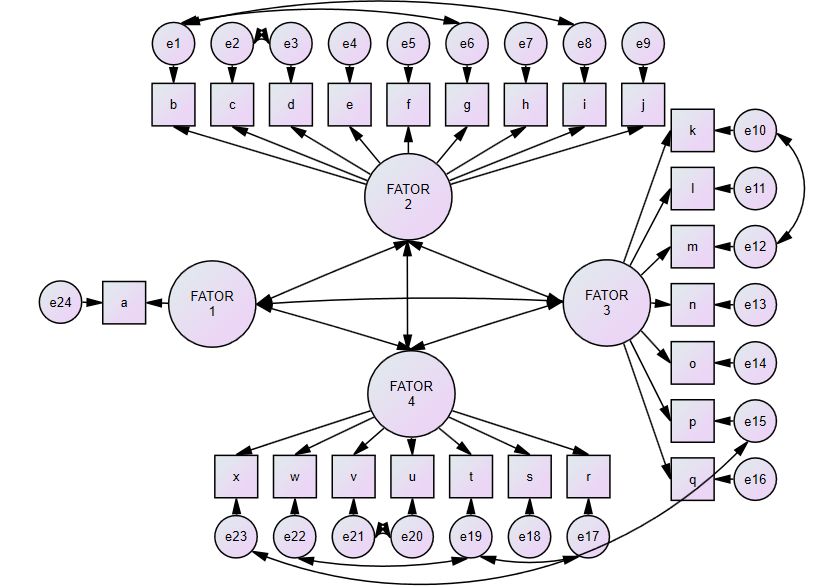
With the data of the questionnaires answered, an analysis of the descriptive statistics
of the data was performed, focusing on the means of the items surveyed, in order to
demonstrate the preliminary relationships between the items and the evasion phenomenon. In
order to simplify this result, the averages can be visualized in graph 1:
9
© Rev. Inter. Educ. Sup. Campinas, SP v.5 1-23 e019006 2019Research
Graph 1. Averages of responses to questionnaire items
Source: Prepared by the authors.
From the analysis of Graph 1 it is possible to notice that the items "a", "m", "o" and
"n" had a high mean, signaling that, in the answers, the evaded students considered that the
difficulty in understanding content (m), frustration with academic performance (o), and very
difficult assessments (n) are very impacting factors, and may even be preponderant at the
moment of deciding to leave the course. In similarly, items such as "q", "k", and "f" had a low
average, indicating a minor but still important impact on the decision to evade.
Already with a notion of the properties of variables and how they relate, it was
possible to idealize a factorial structure and test it from the Confirmatory Factor Analysis
(AFC), thus testing if the idealized factorial structure is adequate to the data, emphasizing that
the margin of error used was 5% and the 95% confidence interval.
To verify the reliability of the data collection instrument, Cronbach's alpha (α) was
calculated for the questions obtained through the Likert scale. The Cronbach alphas found for
the determining factors (Table 4), confirm that the questionnaire used is adequate to carry out
the research. For the analysis of the data collected, we used the software IBM SPSS Statistics
24 (IBM) and Factor 10.5.03 (Universitat Rovira i Virgili).
However, in order to maximize Cronbach's alpha of the first factors, and in an attempt
to fit them into the idealized model, Timmerman and Lorenzo-Seva (2011) it was decided to
add a fourth component.
10
© Rev. Inter. Educ. Sup. Campinas, SP v.5 1-23 e019006 2019Research
Table 4. Characteristics of factors
Factor Denomination Alpha of Cronbach (AC) Items
1 Additional Factor (ADI) - a
2 Psychological and Physical Factor (PISFIS) 0,863 b, c, d, e, f, g, h, i, j.
3 Academic Factor (ACA) 0,763 k, l, m, n, o, p, q.
4 Personal Structural Factor (ESPES) 0,817 r, s, t, u, v, w, x.
Source: Prepared by the authors
The factors that influence the decision of the scholar to abandon higher education are
summarized as follows, so that construct is synonymous with factor:
a) Factor 1- (ADI) - Construct (factor) created to contain the variable (a), which distorts
the others when placed in other factors (see the decrease of the Cronbach's Alpha
value of the other factors when (a) is inserted ourselves). By constructing this factor it
is possible to maximize the Alpha value of the others and thereby increase the
explanatory power of the factorial model.
b) Other Factors - Constructs created to group the variables that have a considerable correlation
between them, which by Cronbach's Alpha test indicate that they are measuring in the same
direction. By analyzing the variables themselves it is noticeable that they refer to specific
themes:
Factor 2 - variables that relate to students' health problems and displeasure with teachers,
infrastructure and university organization.
Factor 3 - variables that relate to the dislike of students with academic issues such as
curriculum matrix and teaching plan of course subjects.
Factor 4 - variables that relate to the structure that supports the student, such as financial,
family and labor issues.
It should be highlighted that the additional factor does not have Cronbach's alpha, since
it is measured by only one item of the questionnaire. Despite this, it is still possible, based on
the AC's of the other factors, to attest to the reliability of the factors by the internal
consistency method.
Resultados
The Kaiser Meyer-Olkin (KMO) and Bartlett's sphericity tests were performed to
verify the compliance of the data to the factorial analysis (PEREIRA, 1999). KMO is a
parameter to verify if a factorial analysis model being used is appropriately adjusted to the
data, and the Bartlett test evaluates the hypothesis that the correlation matrix can be the
identity matrix with determinant equal to 1: if the matrix of correlations is equal to the
identity matrix, this means that we should not use factor analysis.
11
© Rev. Inter. Educ. Sup. Campinas, SP v.5 1-23 e019006 2019Research
According to the Bartlett sphericity test [ and p less than 0,001],
the hypothesis that the correlations between the variables could be zero was disregarded at a
significance level of 5%, reinforcing the indication that the correlations between the items are
sufficient to carry out the analysis, even with a sample population so reduced. In addition, the
Kaiser Meyer-Olkin measure verified sample adequacy for the data analysis - KMO = 0.735.
With the obtained data it was possible to construct several models that could explain
the evasion in the campus of the UFC in Crateús, however the only model that adapted to the
indices of adjustment and the problem itself was the following idealized model, as shown in
Figure 1:
Figure 1. Built model
Source: Prepared by the authors
For the proper interpretation of the constructed model, it is necessary to consider that:
1º - small circles indicate the error associated with the observed variable;
2º - the squares indicate the whole set of variables;
3º - the larger circles indicate the latent dimensions (factors);
4º - the double arrows between the factors (bigger circles) indicate that there is
correlation between them;
5º - the double arrows in the smaller circles indicate a high correlation between the
variables to which the error belongs, since all the variables have correlation with all
the others, but they are negligible correlations for the construction of this model, so
we chose to only display significant correlations.
12
© Rev. Inter. Educ. Sup. Campinas, SP v.5 1-23 e019006 2019Research
The measurement and adequacy of the constructed model, through the various
statistical indicators, was confirmed, since in the Factorial Confirmatory Analysis (AFC),
adjustment indexes generally establish whether the model is acceptable. Adjustment indices
can be classified into several divisions, but Jaccard and Wan (1996) recommend the use of
indices from different divisions to overcome the limitations of each index. Table 5 presents
the indices of the constructed model.
Table 5. Values of the adjustment indices
Table of
Ideal value Value obtained
contents
CMIN/DF ≤5 1,17
RMSEA ≤0,06 0,06
CFI ≥0,9 0,9
IFI4 ≥0,9 0,91
TLI5 ≥0,9 0,88
SRMR6 ≤0,08 0,09
Source: Prepared by the authors
1. CMIN/DF: The chi-square value is divided by the number of degrees of freedom
to obtain an adjustment value to the model less sensitive to sample size (HOCEVAR,
1985; BYRNE, 2001).
2. RMSEA: is the root mean square of the approach errors. It has a known
distribution, and, therefore, represents more adequately how well the model fits the
population (THOMPSON, 2004).
3. CFI: comparative adjustment index, takes into account the complexity of the
model.
4. IFI: incremental adjustment index.
5. TLI: Tucker Lewis index, also known as Bentler-Bonett index not standardized.
6. SRMR: is the square root of the mean square of the standard residuals and
indicates the mean absolute value of the covariance residues (HAIR JR. et al., 2006)
The other indexes of adjustments (GFI, NFI, AIC, BIC, etc.) were discarded, since
they penalize too small samples (Research
and the same is recalculated, however, for our evaluation all loads are reported to ensure
sufficient information and full evaluation of the results.
To the data studied, the following standardized factor loads for factors 2 to 4,
according to Graphic 2:
Graph 2. Standardized factor loadings of each variable
Source: Prepared by the authors
It was observed, reiterating the equivalence of factor and construct, that the variable
referring to the initial desire for that course (a) has a standard factorial load of 1, because it is
the only variable of the ADI construct. Regarding the PISFIS construct, this one refers to
changes in mental health, such as anxiety, depression, among others (h), exerted the greatest
contribution in the formation of this construct, obtaining 0.87 of a standard factorial load,
followed by the variable referring to changes in physical health (j) that obtained a load of
0.72. For the ACA construct, the variable with the greatest contribution was related to
frustration due to academic performance (o), which obtained a standardized factorial load of
0.83, followed by the variable that refers to difficulties in understanding the content (m) with
a load of 0 , 77. Moreover, in the ESPES construct, the variable that contributed the most to
their training was the lack of commitment to graduation (u), followed by lack of family
support (v), obtaining standardized factor loads of 0.79 and 0, 78, respectively. It should be
emphasized that the ESPES Factor being represented mainly by the variables "u" and "v" is 14
© Rev. Inter. Educ. Sup. Campinas, SP v.5 1-23 e019006 2019Research
supported by the fact that 54.5% of campus students are not from Crateús (Jalles, 2017), thus
they need a financial, and greater structural.
The other data are organized ordinally and according to their standardized factorial
load and are presented in Table 6.
Table 6. Factor loads and magnitude of significance of each variable
Factor Variable Standard Factorial Load Variable Designation
1 a 1 Lack of desire for the course
h 0,8 Changes in mental health
j 0,72 Changes in health-physical
e 0,7 Difficulties sleeping
i 0,62 Lack of integration with university dynamics
Displeased with the organization of the
2 c 0,6
university
g 0,51 Lack of friendly interaction with teachers
f 0,48 Lack of university friendships
d 0,47 Displeased with university infrastructure
b 0,39 Displeased with teachers
o 0,83 Frustration for academic performance
m 0,77 Difficulty in understanding the content
n 0,68 Very difficult reviews
3 l 0,59 Amount of excessive academic assignments
Lack of relationship between content and
q 0,49
professional practice
p 0,41 Difficulty getting a job with graduation
k 0,31 Displeased with the disciplines
u 0,79 Lack of commitment to graduation
v 0,78 Lack of family support
t 0,76 Lack of study time
4 s 0,75 Lack of financial conditions
w 0,62 Lack of identification with course
r 0,52 Difficulties occasioned by the course shift
x 0,34 Inability to visualize a future in the profession
15
Source: Prepared by the authors
© Rev. Inter. Educ. Sup. Campinas, SP v.5 1-23 e019006 2019Research
Comparing the standardized factor loads with the averages of each item in Graph 1,
one can see similarities, such as the indication that items such as "a", "o", "m", "n", "l", "v ",
And" s "of factors 1, 3 and 4 are, in isolation, preponderant in the decision to evade.
However, the items "h", "j", and "e" have a low average, even though they are the main items
of construct 2, this is due to the fact that in isolation, the probability of a student evading due
to health changes is low mental, physical or even sleeping difficulties, these evasions occur
by combinations of these items with the others. It happens that these combinations, with other
items of the same factor or not, do not make construct 2 less important, because many items
have a high relation to each other, whether of causality or not.
Finally, since the objective is to analyze the evasion from variables not directly
observable, it is prudent to analyze it through observable variables, each with a level of
importance for the elaboration of the Construct / factors. The correlations between the
Constructs are presented in Table 7:
Table 7. Correlation between factors
Correlation
Items Correlation analysis
(r)
ADI e PISFIS -0,12 Predominantly negative
ADI e ACA -0,1 Predominantly negative
ADI e ESPES 0,13 Disappointingly positive
PISFIS e ACA 0,5 Moderately positive
PISFIS e ESPES 0,71 Strongly Positive
ACA e ESPES 0,46 Weakly positive
Source: Prepared by the authors
The correlations between the presented factors clarify that the ADI construct has a
very small correlation with the other constructs, as predicted by the initial idealized model.
This fact reinforces the decision that creating a separate construct for the variable relating to
the initial desire for the course was well taken. Given this, it is understood that the student
who normally enters a course that does not crave evades for this same reason, without much
relation with the other factors, since the other factors are well related. In short, students with
psychological or health problems may have a low academic performance, as the lack of
family support can lead to financial problems, which would result in a probable employment
dedication to studies, resulting in low academic performance, according to the model
presented.
16
© Rev. Inter. Educ. Sup. Campinas, SP v.5 1-23 e019006 2019Research
Final Considerations
This work presented the development, validation and investigation of the properties of a
representative model of the UFC campus evasion phenomenon in Crateús. In addition, this
work may guide, in the future, new research and interventions in the policies to help the
student stay.
This research pointed to the existence of three great factors related to avoidance:
academic, social and personal factors, which refer to the difficulties of academic life, the
social difficulties of the man, the financial difficulties of the youth, etc. In short, the model
showed good quality and it was possible to confirm the multifaces of the evasion, confirming
the initial hypothesis, being its solution pointed out by means of measures that attack the
presented factors simultaneously.
Since evasion is a phenomenon of multiple circumstances, the use of factorial analysis
was presented as an adequate resource by minimizing the number of variables involved,
making it possible to identify the causes and allowing preventive measures to be
implemented.
It is worth mentioning that the UFC has specialized programs to combat the
phenomenon of evasion, however the campus of Crateús is ridiculously contemplated with
these programs, which can be resulting in the high rates of the same, inside the campus. It is
understood that if the volume of scholarships for students with social vulnerability in this area
was higher, this would positively affect the item lack of family support (v), which often refers
to financial support, and eliminate the need for the student to work for its sustenance, so it
could commit itself to a greater degree with its graduation (u). The absence of health
professionals, leisure activities and especially adequate infrastructure ends up directly
influencing the student to evade.
In spite of this study, the future scenario is that the completion of the works and
contracting in the said campus will advance, in addition to the arrival of more investments, so
it is necessary studies of temporal consistency to verify to what extent the factors obtained
change over the course of the conditions lead to this change. Finally, it should be emphasized
that the model developed is the only reflection of the Campus Crateús of the Federal
University of Ceará, and, therefore, will not reproduce exactly what happens in other
institutions.
References
ANDRIOLA, WAGNER BANDEIRA. Evasão Discente na Universidade Federal do Ceará.
Ensaios: Avaliação e Políticas Públicas em Educação, Rio de Janeiro, v. 40, n. 11, p. 332-
347, 2003.
17
© Rev. Inter. Educ. Sup. Campinas, SP v.5 1-23 e019006 2019Research
ASSOCIAÇÃO NACIONAL DOS DIRIGENTES DAS INSTITUIÇÕES FEDERAIS DE
ENSINO SUPERIOR /ASSOCIAÇÃO BRASILEIRA DOS REITORES DAS
UNIVERSIDADES ESTADUAIS E MUNICIPAIS/SECRETARIA DE EDUCAÇÃO
SUPERIOR/MINISTÉRIO DA EDUCAÇÃO E CULTURA. Diplomação, retenção e
evasão nos cursos de graduação em instituições de ensino superior públicas. [s.l.]:
Comissão Especial de Estudos sobre a Evasão nas Universidades Públicas Brasileiras, 1996.
BAGGI, Cristiane Aparecida dos Santos; LOPES, Doraci Alves. Evasão e avaliação
institucional no ensino superior: uma discussão bibliográfica. Avaliação, v. 16, n. 2, p. 355-
374, 2011.
BARDAGI, Marucia Patta; HUTZ, Claudio Simon. Rotina acadêmica e relação com colegas
e professores: Impacto na evasão universitária. Psico, v. 43, n. 2, p. 174-184, 2012.
BRITTO, Luiz Percival Leme; SILVA, Edineuza Oliveira; DE CASTILHO, Katlin Cristina;
ABREU, Tatiane Maria. Conhecimento e Formação nas IES Periféricas perfil do aluno
“novo” da Educação Superior. Avaliação, v. 13, n. 3, p. 777-791, 2008.
BYRNE, Barbara M. Structural equation modeling with AMOS: basic concepts,
applications, and programming. Mahwah, N.J.: Lawrence Erlbaum Associates, 2001.
CHEUNG, Gordon W.; RENSVOLD, Roger B. Evaluating Goodness-of-Fit Indexes for
Testing Measurement Invariance. Structural Equation Modeling: A Multidisciplinary
Journal, v. 9, n. 2, p. 233-255, 2002.
COMREY, Andrew L.; LEE, Howard B. A first course in factor analysis. 2. ed. Hillsdale,
NJ: Psychology Press, 1992.
Decreto nº 6.096, de 24 de Abril de 2007. Brasil: Marina Barbosa Pinto, 2007.
Estatísticas - ABRE. Disponível em: . Acesso em: 8 nov. 2017.
FEY, Ademar Felipe; LUCENA, Karina de Castilhos; FOGAÇA, Valéria Nagali da Silva.
Evasão no Ensino Superior: uma pesquisa numa IES do ensino privado. Revista de
Humanidades, Tecnologia e Cultura, v. 1, n. 1, 2013.
FREGONEIS, Jucelia Geni Pereira. Estudo do desempenho acadêmico nos cursos de
graduação dos Centros de Ciências Exatas e de Tecnologia da Universidade Estadual de
Maringá: período 1995 - 2000. Mestrado – Universidade Estadual de Maringá, 2002.
GISI, Maria Lourdes. A educação superior no Brasil e o caráter de desigualdade do acesso e
da permanência. Revista Diálogo Educacional, v. 6, n. 17, p. 97-112, 2006.
HAIR, Joseph F; BLACK, William C.; BABIN, Barry J.; ANDERSON, Rolph E.;
TATHAM, Ronald L. Multivariate data analysis. 6. ed. Upper Saddle River, NJ: Prentice
Hall, 2006.
HORN, John L. A rationale and test for the number of factors in factor analysis.
Psychometrika, v. 30, n. 2, p. 179-185, 1965.
18
IBM SPSS Statistics. EUA: IBM, 2016.
© Rev. Inter. Educ. Sup. Campinas, SP v.5 1-23 e019006 2019Research
INSTITUTO NACIONAL DE ESTUDOS E PESQUISAS EDUCACIONAIS ANÍSIO
TEIXEIRA. Resumo técnico: censo da educação superior 2014. Brasília: Diretoria de
Estatísticas Educacionais, 2017.
INSTITUTO NACIONAL DE ESTUDOS E PESQUISAS EDUCACIONAIS ANÍSIO
TEIXEIRA. A democratização e expansão da educação superior no país 2003 – 2014.
Sistema Integrado de Monitoramento, Execução e Controle do Ministério da Educação, 2014.
INSTITUTO NACIONAL DE ESTUDOS E PESQUISAS EDUCACIONAIS ANÍSIO
TEIXEIRA. Sinopse Estatística da Educação Superior 2016. Brasília: INEP, 2018.
INSTITUTO NACIONAL DE ESTUDOS E PESQUISAS EDUCACIONAIS ANÍSIO
TEIXEIRA. Censo da Educação Superior (2010). Brasília: [s.n.], 2011.
INSTITUTO NACIONAL DE ESTUDOS E PESQUISAS EDUCACIONAIS. Planejando a
próxima Década: Conhecendo as 20 Metas do Plano Nacional de Educação. Brasília:
Ministério da Educação, 2014.
JACCARD, James; WAN, Choi K. Lisrel approaches to interaction effects in multiple
regression. [s.l.]: Thousand Oaks: Sage Publications, 1996.
JOHNSON, Richard A.; WICHERN, Dean W. Applied multivariate statistical analysis. 4.
ed. New Jersey: Prentice Hall-Pearson, 1998.
KOWALSKI, Aline Viero. Os (des)caminhos da política de assistência estudantil e o
desafio na garantia de direitos. Doutorado- Pontifícia Universidade Católica do Rio Grande
do Sul. Porto Alegre,2012.
LAROS, Jacob Arie. Análise fatorial para pesquisadores. Brasília: LabPAM Saber e
Tecnologia, 2012. p. 141-160.
LEÓN, Daniela Andrea Droguett. Análise Fatorial Confirmatória através dos Softwares R
e Mplus. Bacharelado – Universidade Federal do Rio Grande do Sul, 2011.
LIMA, Franciele Santos de; ZAGO, Nadir. Desafios conceituais e tendências da evasão no
ensino superior: a realidade de uma universidade comunitária. Revista Internacional de
Educação Superior, Campinas, SP, v. 4, n. 2, 2018. Disponível em:
. Acesso em:
13 jan. 2018.
LORENZO-SEVA, Urbano. Factor. Tarragona (Espanha): Universitat Rivira I Virgili, 2015.
LORENZO-SEVA, Urbano; FERRANDO, Pere J. FACTOR: A computer program to fit the
exploratory factor analysis model. Behavior Research Methods, v. 38, n. 1, p. 88-91, 2006.
MARSH, Herbert W.; HOCEVAR, Dennis. Applications of confirmatory factor analysis to
the study of self-concept: First- and higher order factor models and their invariance across
groups. Psychological Bulletin, v. 97, n. 3, p. 562-582, 1985.
19
© Rev. Inter. Educ. Sup. Campinas, SP v.5 1-23 e019006 2019Research MENEZES FILHO, Naercio. Evasão escolar no ensino superior. 2018. Disponível em: . Acesso em: 23 fev. 2018. MONTEIRO, André Jalles. Desafios na graduação. [s.l.: s.n.], 2017. O’CONNOR, Brian P. SPSS and SAS programs for determining the number of components using parallel analysis and Velicer’s MAP test. Behavior Research Methods, Instruments, & Computers, v. 32, n. 3, p. 396-402, 2000. ORGANIZAÇÃO PARA A COOPERAÇÃO E DESENVOLVIMENTO ECONÔMICO. Education at a Glance 2017. Paris: [s.n.] 2017. PASQUALI, Luiz. Psicometria: Teoria dos testes na psicologia e na educação. 3. ed. Petrópolis: Vozes, 2009. PATIL, Vivek H. et al. Efficient theory development and factor retention criteria: Abandon the ‘eigenvalue greater than one’ criterion. Journal of Business Research, v. 61, n. 2, p. 162- 170, 2008. PEREIRA, Fernanda Cristina Barbosa. Determinantes da evasão de alunos e os custos ocultos para as instituições de ensino superior: uma aplicação na Universidade do Extremo Sul Catarinense. Doutorado – Universidade Federal de Santa Catarina, 2003. PEREIRA, Fernanda Cristina Barbosa; BRASIL, Gutemberg Hespanha; SAMOHYL, Robert Wayne. ANALISE FATORIAL E A EVASÃO DE ALUNOS NO ENSINO SUPERIOR. In: SIMPÓSIO BRASILEIRO DE PESQUISA OPERACIONAL, 36., 2004, São João del-Rei. [Anais do...]. São João del-Rei: [s.n.], 2004. PEREIRA, Júlio Cesar Rodrigues. Análise de dados qualitativos. Estratégias Metodológicas Para as Ciências da Saúde, Humanas e Sociais. 3. ed. Campinas: Edusp, 2004. PINTO, José Marcelino de Rezende. O Acesso à Educação Superior no Brasil. Educação e Sociedade, Campinas, SP, v. 25, n. 88, 2004. POLYDORO, Soely A. J.; PRIMI, Ricardo; SERPA, Maria de Nazaré da F.; ZARONI, Margarida M. Hoeppner; Pombal, Kelly Cristina Pereira Pombal. Desenvolvimento de uma Escala de Integração ao Ensino Superior. Psico-USF, Bragança Paulista, v. 6, n. 1, p. 11-17, 2001. SASS, Daniel A.; SCHMITT, Thomas A. A Comparative Investigation of Rotation Criteria Within Exploratory Factor Analysis. Multivariate Behavioral Research, v. 45, n. 1, p. 73- 103, 2010. SHAPIRO, Alexander; TEN BERGE, Jos M. F. Statistical inference of minimum rank factor analysis. Psychometrika, v. 67, n. 1, p. 79-94, 2002. SILVA FILHO, Roberto Leal Lobo E; MOTEJUNAS, Paulo Roberto; HIPÓLITO, Oscar; MELO LOBO, Maria Beatriz de Carvalho. A Evasão no Ensino Superior Brasileiro. Cadernos de Pesquisa, São Paulo, v. 37, n. 132, p. 641-659, 2007. 20 © Rev. Inter. Educ. Sup. Campinas, SP v.5 1-23 e019006 2019
Research

SILVA, Vanessa Juliana da. O novo universitário no contexto da expansão e interiorização da
universidade pública no Brasil. 2011, Curitiba. CONGRESSO BRASILEIRO DE
SOCIOLOGIA, 15., 2011, Curitiba. [Anais do...]. Curitiba: [s.n.], 2011.

SINDICATO DAS MANTENEDORAS DE ENSINO SUPERIOR. Mapa do ensino
superior no brasil: 2016. São Paulo: [s.n.], 2018.

STEIGER, James H. Point Estimation, Hypothesis Testing, and Interval Estimation Using the
RMSEA: Some Comments and a Reply to Hayduk and Glaser. Structural Equation Modeling:
A Multidisciplinary Journal, v. 7, n. 2, p. 149-162, 2000.

TACHIBANA, Thiago Yudi; MENEZES FILHO, Naercio; KOMATSU, Bruno. Ensino
Superior no Brasil. São Paulo: Centro de Políticas Públicas - INSPER, 2015.

THOMPSON, Bruce. Exploratory and confirmatory factor analysis: Understanding
concepts and applications. Washington, DC: American Psychological Association, 2004.

TIMMERMAN, Marieke E.; LORENZO-SEVA, Urbano. Dimensionality assessment of
ordered polytomous items with parallel analysis. Psychological Methods, v. 16, n. 2, p. 209-
220, 2011.

TUCKER, Ledyard R; LEWIS, CHARLES. A reliability coefficient for maximum likelihood
factor analysis. Psychometrika, v. 38, n. 1, p. 1-10, 1973.

UFC-SIGAA. Disponível em: . Acesso em: 13 jan.
2018.

                                                                                               21
  © Rev. Inter. Educ. Sup.   Campinas, SP   v.5    1-23        e019006            2019
Research
APPENDIX A
UNIVERSITY LIVING QUESTIONNAIRE
Express your agreement on the following judgments concerning your circumvention.
Obs: NeutraL= neither disagree nor agree.
a- The course i was taking was not my intended course.
( ) Strongly Disagree ( ) Disagree ( ) Neutral ( ) Agree ( ) Strongly Agree
b- The teachers did not please me.
( ) Strongly Disagree ( ) Disagree ( ) Neutral ( ) Agree ( ) Strongly Agree
c- The organization of the university did not please me.
( ) Strongly Disagree ( ) Disagree ( ) Neutral ( ) Agree ( ) Strongly Agree
d- The infrastructure of university did not please me.
( ) Strongly Disagree ( ) Disagree ( ) Neutral ( ) Agree ( ) Strongly Agree
e- I began to suffer with difficulty sleeping (Insomnia, Anxiety etc.)
( ) Strongly Disagree ( ) Disagree ( ) Neutral ( ) Agree ( ) Strongly Agree
f- I did not have s many friends at university. I had no friendship at university
( ) Strongly Disagree ( ) Disagree ( ) Neutral ( ) Agree ( ) Strongly Agree
g- The teachers and I did not interact amicably.
( ) Strongly Disagree ( ) Disagree ( ) Neutral ( ) Agree ( ) Strongly Agree
h- I suffered from changes in mental health (anxiety, depression, etc.).
( ) Strongly Disagree ( ) Disagree ( ) Neutral ( ) Agree ( ) Strongly Agree
i- I did not integrate the dynamics of the university, did not know where to look for information
or how several services work.
( ) Strongly Disagree ( ) Disagree ( ) Neutral ( ) Agree ( ) Strongly Agree
j- I suffered from changes in physical health, acquired chronic diseases or symptoms such as
tiredness, headaches etc.
( ) Strongly Disagree ( ) Disagree ( ) Neutral ( ) Agree ( ) Strongly Agree
k- The subjects of the course did not please me.
( ) Strongly Disagree ( ) Disagree ( ) Neutral ( ) Agree ( ) Strongly Agree
l- The amount of academic tasks was excessive.
( ) Strongly Disagree ( ) Disagree ( ) Neutral ( ) Agree ( ) Strongly Agree 22
© Rev. Inter. Educ. Sup. Campinas, SP v.5 1-23 e019006 2019Research
m- I had a hard time understanding the content..
( ) Strongly Disagree ( ) Disagree ( ) Neutral ( ) Agree ( ) Strongly Agree
n- The evaluations were very difficult.
( ) Strongly Disagree ( ) Disagree ( ) Neutral ( ) Agree ( ) Strongly Agree
o- I was very frustrated by the academic performance I was having.
( ) Strongly Disagree ( ) Disagree ( ) Neutral ( ) Agree ( ) Strongly Agree
p- I realized that it would be very difficult to get a job with this degree.
( ) Strongly Disagree ( ) Disagree ( ) Neutral ( ) Agree ( ) Strongly Agree
q- I realized that what was being taught had nothing to do with the practice of professionals.
( ) Strongly Disagree ( ) Disagree ( ) Neutral ( ) Agree ( ) Strongly Agree
r- The turn of my course makes my study and commitment difficult.
( ) Strongly Disagree ( ) Disagree ( ) Neutral ( ) Agree ( ) Strongly Agree
s- I did not have the financial conditions to continue on my course.
( ) Strongly Disagree ( ) Disagree ( ) Neutral ( ) Agree ( ) Strongly Agree
t- I did not have time to study.
( ) Strongly Disagree ( ) Disagree ( ) Neutral ( ) Agree ( ) Strongly Agree
u- Faced with several factors, I could not commit to my graduation goal.
( ) Strongly Disagree ( ) Disagree ( ) Neutral ( ) Agree ( ) Strongly Agree
v- Had little or no family support.
( ) Strongly Disagree ( ) Disagree ( ) Neutral ( ) Agree ( ) Strongly Agree
w- I suffered because I did not have enough information about the course before enrollment, so I
did not identify myself with the course.
( ) Strongly Disagree ( ) Disagree ( ) Neutral ( ) Agree ( ) Strongly Agree
x- I did not visualize myself as a future professional in the area of the course I was studying.
( ) Strongly Disagree ( ) Disagree ( ) Neutral ( ) Agree ( ) Strongly Agree
23
© Rev. Inter. Educ. Sup. Campinas, SP v.5 1-23 e019006 2019You can also read