Responding to COVID-19 - Primer and Implications for Supply Chain and Banking March 13, 2020 UPDATE - TecnoHotel

Page created by Travis Jimenez
 
CONTINUE READING
Responding to COVID-19 - Primer and Implications for Supply Chain and Banking March 13, 2020 UPDATE - TecnoHotel
Responding to COVID-19
Primer and Implications for Supply Chain and Banking

March 13, 2020 UPDATE
© Oliver Wyman                                         1
Responding to COVID-19 - Primer and Implications for Supply Chain and Banking March 13, 2020 UPDATE - TecnoHotel
CONFIDENTIALITY
Our clients’ industries are extremely competitive, and the maintenance of confidentiality with respect to our clients’ plans and data is critical. Oliver Wyman rigorously
applies internal confidentiality practices to protect the confidentiality of all client information.
Similarly, our industry is very competitive. We view our approaches and insights as proprietary and therefore look to our clients to protect our interests in our proposals,
presentations, methodologies and analytical techniques. Under no circumstances should this material be shared with any third party without the prior written consent
of Oliver Wyman.
© Oliver Wyman
Responding to COVID-19 - Primer and Implications for Supply Chain and Banking March 13, 2020 UPDATE - TecnoHotel
RESPONDING TO COVID-19

 01              Epidemiologic perspectives

 02              Supply chain impact

 03              FS impacts: China case study

 04              FS impacts: US perspectives

© Oliver Wyman                                  3
Responding to COVID-19 - Primer and Implications for Supply Chain and Banking March 13, 2020 UPDATE - TecnoHotel
01
EPIDEMIOLOGIC PERSPECTIVES
Responding to COVID-19 - Primer and Implications for Supply Chain and Banking March 13, 2020 UPDATE - TecnoHotel
Information as of 3/10/20

SUMMARY

  Context                                                      What                                Are we
  and Purpose                                                  is it?                              overreacting?

Context and purpose                                        What is it?                             Are we overreacting?
COVID-19 has infected more than                            COVID-19 is the name for the illness    There’s no need to panic, but there are a few characteristics that
125K people globally and is taking its                     caused by the novel coronavirus that    are important to understand:
toll on individuals, families, and                         originated in Wuhan, China in           • Early data suggests that COVID-19 may be 2–3 times as
economies as productivity drops and                        December 2019                             contagious as the flu with a much higher case fatality rate
stock markets reflect increased
                                                           It is from the same family of viruses   • Approximately 19% of confirmed cases are considered “severe”
global uncertainty
                                                           that cause some common colds, as          or “critical”1
This document provides some                                well as Severe Acute Respiratory
                                                                                                   • The incubation period for COVID-19 appears to be longer than
baseline facts for business leaders                        Syndrome (SARS) and Middle East
                                                                                                     that of the flu, at ~5 days2 versus 2–4 days3; in addition,
and guidance as to critical questions                      Respiratory Syndrome (MERS)
                                                                                                     evidence suggests it can be transmitted asymptomatically,
to address in the immediate and
                                                           It is considered similar to other         making COVID-19 more complicated to contain
near-term to ensure the continuity
                                                           respiratory infections such as
of their business and the safety,                                                                  We don’t yet know if COVID-19 is seasonal like the flu; half of
                                                           influenzas; symptoms range from
health, and wellbeing of their                                                                     coronaviruses appear to be seasonable, and half do not; there is no
                                                           fever, cough, shortness of breath to
workforce and customers                                                                            direct evidence yet to suggest this is seasonal
                                                           more severe cases of pneumonia and
                                                           organ failure                           As more data is collected, we may come to understand that COVID’s
                                                                                                   spread and severity are more like the seasonal flu; and there is
                                                                                                   reason to believe that vaccine and treatment pathways will lead to
1. China CDC; 2. London School of Tropical Medicine; 3. CDC.                                       more effective responses for severe cases
© Oliver Wyman                                                                                                                                                           5
Responding to COVID-19 - Primer and Implications for Supply Chain and Banking March 13, 2020 UPDATE - TecnoHotel
COVID-19 WORLD-WIDE COVERAGE
The virus continues to spread

                                                                                                                                                          Number of
                                                                                                                                                     confirmed cases as
                                                                                                                                                      of March 10th for
                                                                                                                                                       select countries
                            ~80
                                                                  15k1
                               ~700
                                                          (incl. Italy: 11k)
                                                                                                                            80k
                                                                                                                            80k

 • First reported in Wuhan, China, on December 31, 2019                                               As of March 11th, 2020:
 • Declared a public health emergency of international concern                                        • >125k cases reported in 110 countries and territories
   by the World Heath Organization on January 30, 2020                                                • >4,500 reported deaths

1. Countries included: All Countries in “European Region” Sub-region in WHO Situation Report-50
Source: Map from CDC (link), Numbers from WHO National Health Commission of the People’s and Situation Report – 50 (link)

© Oliver Wyman                                                                                                                                                            6
Responding to COVID-19 - Primer and Implications for Supply Chain and Banking March 13, 2020 UPDATE - TecnoHotel
Information as of 3/10/20

COVID-19 TRENDS AND SPREAD OF THE DISEASE
The number of new cases in China has slowed – likely due to significant containment measures – as the outbreak
spreads to other countries

Confirmed Cases of COVID-19                                                                                   New Cases Per Day of COVID-19
Cumulative Number of Cases as of March 10                                                                     New Cases Per Day as of March 10, 2020

90,000                                                                                                        4,500
                                                                                          China                                                China                                         Rest of World
80,000                                                                                                        4,000

70,000                                                                                                        3,500
                            Updates to
60,000                    Measurement                                                                         3,000
                           Definitions*
50,000                                                                                                        2,500

40,000                                                                                                        2,000
                                                                          Rest of World
30,000                                                                                                        1,500

20,000                                                                                                        1,000

10,000                                                                                                           500

        0                                                                                                           0
                                              11-Feb

                                                          18-Feb

                                                                      25-Feb

                                                                                  3-Mar

                                                                                                                                                           11-Feb

                                                                                                                                                                        18-Feb

                                                                                                                                                                                    25-Feb

                                                                                                                                                                                                 3-Mar
            21-Jan

                      28-Jan

                                                                                                                        21-Jan

                                                                                                                                   28-Jan
                                  4-Feb

                                                                                              10-Mar

                                                                                                                                               4-Feb

                                                                                                                                                                                                            10-Mar
Source: WHO Situation Reports (link), the first report release date was Jan 21, 2020
Notes: Until February 17, the WHO situation reports included only laboratory confirmed cases causing a spike in total cases. Some sources include this update as of February 13. The jump due to inclusion of non
lab confirmed cases is not included in the new cases data in WHO situation reports. From January 21 through January 31, the WHO did not directly report new cases and values shown are extrapolated from totals.

© Oliver Wyman                                                                                                                                                                                                  7
Responding to COVID-19 - Primer and Implications for Supply Chain and Banking March 13, 2020 UPDATE - TecnoHotel
Information as of 3/10/20

 HOW DOES COVID-19 COMPARE TO DISEASE OUTBREAKS?
 COVID-19 is currently more deadly that the Flu, but the science on transmission and mortality continues to evolve

 Fatality rate 1                                                                                              Key:
                                                                                                                         Denotes                    Additional details
                                                                                                                         Coronaviruses
 Log scale

              100%                                                                                                                                  • R-naught (R0) represents the number
                             Bird Flu                                                                                                                 of cases an infected person will cause.
                                          Ebola
                                                                                                                                                      R0 for COVID-19 is currently estimated
                     MERS                                                                                                                             at between 2 and 3 (with edge of
                                                      Smallpox
                     2,494 infected                                                                                                                   range estimates closer to 1.4 and 3.5),
              10%    858 deaths
                                                  SARS                                                                                                which means each person infects 2-3
                        1918 Spanish Flu          8,096 infected                                                                                      others3; R0 for the seasonal flu is
                           ~500M infected         774 deaths
                                                                                                                                                      around 1.34
More deadly

                            ~50M deaths
                                                                                                                                                    • The case fatality rate for confirmed
               1%                     COVID-19 Fatality and Transmission Range                                                                        COVID-19 cases is currently 3.53%5
                                      Estimates: >113k infected, >4k deaths                                                                           according to the WHO versus 0.1% for
                                                                                                                                                      the seasonal flu
                               H1N1 Swine Flu
                               700M–1.4B infected                                                                           Measles                 • We expect case fatality rate to
                               284 deaths2
              0.1%                                                                                                                                    fluctuate as testing expands and more
                     Seasonal Flu                                                                                                                     cases are identified

                        Common cold                                            Chickenpox

                       1                    5                         10                                                               15
                               Average number of people infected by each sick person (R0)
                                                               More contagious
 1. New York Times (link) for fatality and R-naught comparisons, CDC timelines for case numbers (selected link: CDC SARS timeline), 2. Updated CDC estimates (link), 3. The R0 for the coronavirus was estimated by
 the WHO to be between 1.5 -2.5 (end of January estimate) (link), other organizations have estimated an R0 ranging between 2-3 or higher (link), 4. CDC Paper (link), 5. WHO 3/10/20 statement

 © Oliver Wyman                                                                                                                                                                                                  8
Responding to COVID-19 - Primer and Implications for Supply Chain and Banking March 13, 2020 UPDATE - TecnoHotel
Information as of 3/10/20

CASE FATALITY RATE (CFR) BY PATIENT CHARACTERISTIC
Significantly higher death rates occur among the elderly and those with underlying conditions

Case Fatality Rate by Specific Patient Characteristics
All confirmed cases in China as of February 11, 2020
by Age                                                                                                      by Comorbid Condition

16%                                                                                                         16%

14%                                                                                                         14%

12%                                                                                                         12%

10%                                                                                                         10%

  8%                                                                                                          8%

  6%                                                                                                          6%

  4%                                                                                                          4%

  2%                                                                                                          2%

  0%                                                                                                          0%
           ≥80 70–79 60–69 50–59 40–49 30–39 20–29 10–19 0–9                                                           Cardio- Diabetes Chronic     Hyper-            Cancer      None
                                                                                                                       vascular         respiratory tension
                                                                                                                       disease            disease

Source: China CDC Weekly. Vital Surveillances: The Epidemiological Characteristics of an Outbreak of 2019 Novel Coronavirus Diseases (COVID-19) — China, 2020.
Notes: Data includes 44,672 confirmed cases reported through February 11, 2020.

© Oliver Wyman                                                                                                                                                                               9
Responding to COVID-19 - Primer and Implications for Supply Chain and Banking March 13, 2020 UPDATE - TecnoHotel
Preliminary and evolving

  HOW CAN MITIGATION MEASURES LOWER THE BURDEN OF THE PANDEMIC?
  Proactive and swift mitigation measures (e.g., social distancing) are critical to control the spread and reduce the overall
  burden on the healthcare system, as ~15–20% of confirmed cases require hospitalization

  Illustrative COVID-19 transmission with and without mitigation measures
  Timing and width of peaks may vary between countries

                                           Uncontrolled
                                          transmission1
# of cases

                                                                                                                    Proactive mitigation efforts
                                                                                                                    reduce the intensity of the spread,
                                                                                                                    easing burden on health systems

             0            1                 2                 3                  4                  5                 6                 7                  8                  9           10
                                                                            Months since first transmission
  1. Assuming case-based isolation only
  Source: Adapted from “How will country-based mitigation measures influence the course of the COVID-19 epidemic”. Lancet. Mar 6 2020. https://doi.org/10.1016/S0140-6736(20)30567-5

  © Oliver Wyman                                                                                                                                                                                 10
Information as of 3/10/20

WHERE ARE WE IN THIS PANDEMIC?
SARS, while smaller and more contained than COVID-19, is one analog to understand how the pandemic could unfold
and how important public and public health response is to containment and mitigation

SARS1
6 months critical, 8,096 infected, 774 deaths
                                                                                     Toronto,        >5,000 cases,                                     WHO declares end
                                                                   Patient A         Singapore,      super spreader,   New cases drop                  of epidemic (though
First emerges                                                      brings SARS       Thailand        SARS clinically   dramatically, WHO               there are spot cases
in China                                                           to HK             outbreaks       identified        lifts travel bans               for next year)
NOV 2002                                                           FEB 2003          MAR 2003        APR 2003          MAY 2003                        JUN 2003

                                                                                     4 months      5 months            6 months
                                                                                     Global Spread Viral sequence      Source country
                                                                                                                       under control

COVID-192
3 months & counting, >125,000 infected, >4,500 deaths
                                                                           COVID-19 Public health response in China seems
                                                                           to contain, but threat spreads to new geographies
                                                                                                    Italy moves to national lockdown
                     WHO declares             >80,000 cases and China’s factories back              as death toll reaches; US           Norway announces national shuts
First emerges        state of                 community spread at 60–70% capacity as                announces restrictions on flights   down (schools) and quarantines
in China             emergency                outside of China  quarantines lifted                  from Europe for next 30 days        for asymptomatic travelers
DEC 2019             JAN 2020                 FEB 2020                     MAR 2020                 MAR 11, 2020                        MAR 12, 2020

                     1 month          2 months                             3 months
                     Viral sequencing Global Spread                        Source country
                                                                           possibly under control
Sources: SARS timeline (link),, COVID-19: CDC and WHO, and Asia Times (link)

© Oliver Wyman                                                                                                                                                            11
HOW LONG COULD THIS LAST? HOW MIGHT THIS PLAY OUT?
Two key questions, and a number of items to monitor, help define three potential scenarios

Q1: Will public health measures contain individual outbreaks?
China has demonstrated containment is feasible, but will containment be maintained, will other countries be willing and able to implement
the necessary containment tactics, and will the public comply?
Key items to watch
• New case rates as China lifts restrictions: some new cases (a ‘bump’) are to expected, but a spike could be concerning
• Case growth in Italy: Italy has shown some worrying signs of veering off the China containment curve, bending the trend in the next
  1–2 weeks is critical months; ongoing pandemic

             YES                                                                       NO

        SCENARIO 1                  Q2: Will a mitigating factor emerge to help dampen the effects of the virus?
      Serial outbreaks              If public health measures are insufficient in some or all countries, will we catch a break from a mutation
    lasting 3–4 months              that renders the virus less virulent, seasonality, or improvements in CFR?
                                    Key items to watch
                                    • Signs of seasonality: We will not know definitively if the virus is seasonal for 9-12 months, but
                                      diminishing outbreaks in the Northern Hemisphere as temperatures rise, and limited outbreaks in
                                      the Southern Hemisphere could be indicative
                                    • Data on mutations and their impact: Very limited data is available on the impact of identified
                                      mutations of the virus on prevalence, transmission, or severity of disease

                                                        YES                                                         NO

                                                   SCENARIO 2                                                  SCENARIO 3
                                                6–12 months to rein                                            12+ months;
                                                   in pandemic                                               ongoing epidemic
© Oliver Wyman                                                                                                                              12
Preliminary and evolving

HOW LONG COULD THIS LAST? HOW MIGHT THIS PLAY OUT?
Scenario 1: Serial outbreaks lasting 3–4 months

What you’d have to believe                       What we know so far                          Anticipated business impacts

• New case rates spike with initial outbreak     • Aggressive containment measures in         • Supply chain shocks reverberate into Q2
  in a region and increased testing, but level     China (100M under quarantine in              in some sectors; Chinese manufacturing
  off within ~8 weeks                              February 2020, 59M remain so as of early     shutdown in part tempered by inventories
                                                   March) contained spread within 8 weeks       stockpiled in advance of Lunar New Year
• Public health officials enact aggressive
                                                   of identification
  containment measures to contain                                                             • Corporate and government-mandated
  localized outbreaks (e.g., Italy, Seattle      • New case rates in China have declined;       (e.g., US restriction on European travel
  (USA), New Rochelle (USA)), learning from        similar compliance would be necessary in     announced 3/11) travel restrictions in
  the “playbook” set by China, Singapore           rest of world to contain                     affected regions lead to drop-off in
  and refined by the next regions to                                                            demand in airlines, hotels and impact
                                                 • China has not yet returned to “normal”
  experience outbreak                                                                           retail supply and demand
                                                   (e.g., schools are still closed with
• Population largely complies with public          staggered re-opening planned for           • Earnings dented post outbreak in a
  health directives, slowing human-to-             Mar–May)                                     particular region, but swift recovery and
  human transmission; health systems are                                                        rebounding consumer confidence allows
  not overwhelmed, CFR does not rise                                                            companies to return to normal one to
                                                                                                two quarters later
• New case rates in China do not increase
  after quarantines and travel restrictions                                                   • Complete global recovery takes until
  are relaxed and schools reopen                                                                Q4 or longer, given serial pattern of
                                                                                                outbreaks and containment;
                                                                                                recovery more rapid if virus proves
                                                                                                to be seasonal

© Oliver Wyman                                                                                                                             13
Preliminary and evolving

HOW LONG COULD THIS LAST? HOW MIGHT THIS PLAY OUT?
Scenario 2: 6–12 months to rein in pandemic

What you’d have to believe                     What we know so far                               Anticipated business impacts

• While some countries move rapidly to         • Other countries may be unable (e.g., lack       • Employers reluctant to relax travel and
  replicate aggressive containment               of resources to rapidly erect hospitals, lack     WFH mandates without guidance from
  measures, others either do not or are          of infrastructure and surveillance                public health officials
  unable to drive compliance                     capabilities to track and isolate cases) or
                                                                                                 • Vulnerable industries experience a
                                                 unwilling to mount the same public health
• Countries with slower, less aggressive                                                           continued drop in demand as consumer
                                                 response as China
  response and/or poor compliance are not                                                          confidence wavers into Q2 and Q3 and
  able to contain the virus with case rates    • Compliance with public health                     take measures to stabilize balance sheets
  continuing to increase beyond expected         recommendations is more difficult to enforce      and ensure liquidity
  6–8 week window                                in many countries (e.g., broken quarantine of
                                                                                                 • Supply chain shocks play out over a six
                                                 patient in New Hampshire, USA)
• Some countries with initial containment                                                          month period, after which momentum
  see spike of cases after lifting             • Virulence-lowering viral mutations have           could begin to stabilize and recover
  containment measures                           been observed previously (e.g., SARS) and
                                                                                                 • Pace of growth slows in impacted
                                                 there is emerging evidence of at least two
• Despite continued rise of cases, case                                                            countries; larger, more diversified
                                                 strains of COVID-19, one less virulent than
  fatality rate decreases because mitigating                                                       economies with less dependence on
                                                 the other
  factor emerges (e.g., viral mutation                                                             international trade and/or foreign income
  affecting virulence, seasonality, early      • While ~50% of coronavirus family have             than other economies prove better able
  identification and improved treatment)         proved to be seasonal, no direct evidence         to weather slowing growth
                                                 yet indicates COVID-19 is seasonal
• As case fatality rate decreases, public
  begins to calm down despite ongoing          • Aggressive testing and documentation of
  outbreaks of disease                           effective treatment protocols has
                                                 contributed to a dramatically reduced CFR
                                                 in South Korea (0.8% as of 3/12) compared
                                                 to that of other regions

© Oliver Wyman                                                                                                                               14
Preliminary and evolving

HOW LONG COULD THIS LAST? HOW MIGHT THIS PLAY OUT?
Scenario 3: 12+ months; ongoing pandemic

What you’d have to believe                  What we know so far                       Anticipated business impacts

• Virus proves to either not be seasonal,   • Insufficient data to support scenario   • Drops in demand (consumer
  or seasonal and endemic (rising,            as of yet                                 confidence, access to supply,
  falling and returning seasonally          • Multiple vaccines under development       part-time/gig economy workers with
  by Hemisphere)                              but at least 1 year out                   less discretionary income) cause
• Regions are unable to contain                                                         growth to slow into Q4
                                            • Unless “spike” of cases in a region
  outbreaks; virus spreads widely,            can be smoothed over a longer           • Companies in particularly vulnerable
  affecting ~20–60%1 of adult                                                           industries (travel, energy, hospitality)
                                              period of time, health systems
  population in next 2 years                                                            require additional liquidity, and
                                              become overtaxed and cannot
                                                                                        may trigger complications for
• Mortality rates do not decline,             adequately meet all patients’ needs
                                                                                        related industries
  placing significant strain on or            (e.g., Wuhan, Italy)
  overwhelming health systems and                                                     • Government stimulus injected to
                                            • As health systems become
  further increasing fatalities                                                         protect vulnerable workers and, for
                                              overwhelmed, transmission and case
                                                                                        instance, directly support SMEs (e.g.
• Vaccine is required to halt progress        fatality increases
                                                                                        credit provision), perhaps on a scale of
  of disease
                                                                                        TARP or larger

© Oliver Wyman                                                                                                                   15
Information as of 3/10/20

WHAT SHOULD COMPANIES BE THINKING ABOUT RIGHT NOW?

                 Confirm        All companies should be implementing business continuity plans to reassure employees and ensure readiness
                 Business       for supply chain constraints, demand shocks, and impacts to business partners, prioritizing critical business
                 Resiliency     activities and creating contingency plans for disruption

                 Model          Companies should be evaluating their financial outlook, modelling supply and demand across a number of
                 Financial      scenarios, identifying potential interventions and contingency plans for subsequent impacts and/or sustained
                 scenarios      challenges (e.g. strategies for managing variable costs, cash flow, liquidity)

                 Reassure       Consumer concerns need to be understood, mapped, and incorporated into the business continuity plan such
                 Customers      that consumer needs are addressed and trust is maintained

                 Move to        Some industries are likely to see a massive acceleration in the use of digital channels. Retail, Financial
                 Digitization   Services, and Healthcare companies have experienced 100–900% growth in key digital channels in China during
                 Rapidly        the outbreak. Customers with positive digital experiences are unlikely to return to analog channels

                                Pandemic business continuity plans will get companies through the next 2–4 weeks, but strategies may be
                 Prepare for
                                required to get through 6–12 months (or more) of disruption if subsequent demand shocks exist. Companies
                 Long Haul
                                should consider the nature and required timing associated with more structural changes to their operations

                 Convene        Companies should consider which industry and government collaborations are necessary to address safety
                 Industry       concerns, share best practices, stimulate demand, and rebuild consumer trust

© Oliver Wyman                                                                                                                                  16
02
SUPPLY CHAIN IMPACT
AIRLINE INDUSTRY: COMPARISON OF EVENT IMPACT
9/11 and the global economic crisis/H1N1 had similar recovery periods whereas the more regionally focused SARS
outbreak had a more compact cycle

Overview of the current situation1
Global capacity growth of 4% has swung to an +8% decline, initially driven by reductions to/in China, but now spreading to US and EU
domestic traffic as well

What to expect as the situation evolves
• The industry has historically reacted quickly to immediate and pronounced drops in demand but has taken a more cautious approach to
  slower evolving events, often reducing capacity at a slower rate than demand
• Large-scale events not contained to specific geography typically evolve asymmetrically at the market-level
• In the past, recovery periods have ranged from 12–18 months

Industry capacity change from base period
Monthly ASM (Available Seat Miles) index vs same month in baseline pre-event period; M0=month prior to event

120%

100%

 80%

 60%

 40%

 20%
                0        1   2    3       4      5       6       7       8      9       10         11   12      13    14        15         16
1. As of March 5, 2020                                                                   9/11/01         SARS           Global economic crisis/H1N1

© Oliver Wyman                                                                                                                                  18
AIRLINE INDUSTRY: CASH CONSERVATION HAS BECOME PARAMOUNT
With significant fixed costs, airlines are already considering temporary reductions in pay, staff furloughs, and
suspension of discretionary projects and initiatives

• Latest forecasts suggest that global passenger airlines will lose $63 BN to $113 BN in 2020; ~$100 BN swing from earlier forecasts of
  $29.3 BN in profits1
• Recent reduction in fuel costs may be a mitigating factor, but prices may quickly rebound if OPEC+ reaches an agreement on supply

  Airline                                      Capacity reduction2    Other financial response actions2

                                               7.5%                   None announced

                                                                      Company-wide hiring freeze, offering voluntary leave options, parking aircraft,
                                               15%
                                                                      and evaluating early retirements of older aircraft
                                                                      Reducing hiring of frontline and support center staff and limiting
                                               5%
                                                                      non-essential spending
                                                                      Freeze hiring on non-frontline positions, and looking at freezing all hiring and
                                               None yet
                                                                      voluntary leaves, an early out program, etc.
                                                                      Voluntary unpaid leave, suspending hiring through June 30, postponing pending
                                               10%                    salary increases for management and administrative personnel and offering pilots
                                                                      a month off at reduced pay

                                               30%                    Asked all its staff to take three weeks of unpaid leave

                                               50%                    Offering staff voluntary, unpaid leave

1. Forecast from the International Air Transport Association (IATA)
2. Airline public announcements through March 5, 2020

© Oliver Wyman                                                                                                                                           19
MANUFACTURING INDUSTRY: OBSERVED IMPACT
Auto and Industrial companies have been buffeted in two waves: global supply chain disruption (in-process) and
internal operational regional disruptions (potential)

     Raw material                 n-Tier suppliers               Module or                        System integrator (“OEM”)                  Distribution/
       supplier                                               component supplier                                                                 retail

                                                                                        Plants outside of affected areas are impacted by
                                                                                                                                           Demand reduction
                                                                                        shortages of few crucial parts and have to
 Critical raw materials                                                                                                                    due to short term
                                                                                        completely shut down
 with limited global          n-tier supplier of critical   Supplier of components or                                                      supply constraints,
 availability are affected,   component is affected and     modules suffers from        As virus spreads to different regions,             containment
 leading to long period       cannot ramp-up                undetected broken supply    in-region production losses due to partial plant   measures, macro-
 of capacity shortage         production fast enough        chain on n-tier level       closures from worker shortages                     economic factors, etc.

© Oliver Wyman                                                                                                                                                 20
MANUFACTURING INDUSTRY: OBSERVED RESPONSE
Firms are developing a Response framework and associated measures in real-time

Response framework                           Response measures

                                             Operational
                                             • Organized COVID-19 Response Management: formalize PMO activities, secure
                 Outside/inside                inventory, monitor internal facility status, proactive response planning, etc.
                 the four walls              • Supply chain/vendor diversification
                                               (at the regional concentration level)
                                             • Social distancing for virtualizable activities
                                             • Non-virtualizable asset intensive activities
                 Virtual/non-virtualizable     – Call centers: non-essential visitors bans, worker monitoring
                 activities
                                               – Warehouse/Manufacturing sites: non-essential visitors bans, worker monitoring,
                                                 increased work-in-process and finished goods buffer inventory
                                               – ...
                                             Financial
                 Near term vs. mid-term      • Furloughs and shutdowns
                 demand impact
                                             • OEMs providing supplier liquidity assistance via expedited payments, advances, etc.
                                             • Customer incentives (rebates, financing, etc.) to bolster demand

© Oliver Wyman                                                                                                                       21
03
FS IMPACTS: CHINA CASE STUDY
SUMMARY OF WHERE WE ARE IN CHINA

          Short term impact on mainland China                            Layered impact on Hong Kong

China is returning to work                                       COVID-19 has ‘layered’ additional stress on an already
                                                                 challenged Hong Kong economy
• Unprecedented government action has brought new cases
  down rapidly; numbers remain small outside of Hubei            • Geopolitical tension since mid-2019 has a strong negative
                                                                   impact on HK’s economy, already leading it into a recession
• Over 60% of production has resumed and 30% of migrants have
  returned to tier-1 cities                                      • Although the number of confirmed cases in HK is still small,
                                                                   near-closure of the border with mainland has materially
Q1 GDP growth will be dampened, but it has always been a slow      impacted retail sector; HK SMEs and retailers are now facing
quarter; Q2 and beyond will depend on government action            a far greater liquidity pressure than ever
• Short term hit on the Chinese economy is inevitable with Q1
                                                                 Path forward more uncertain for HK
  GDP ~4%; Government has introduced a series of stimulus
  policies to support growth                                     • Creative & targeted government support will be essential for
                                                                   HK’s speedy recovery, however there is limited scope given
• We expect China GDP growth between 5.5%–6.0% in 2020,
                                                                   currency peg for monetary policy
  based on further expected expected stimulus Our downside
  estimate is 4.6%–5.5%                                          • Transmission from real economy to financial sector only now
                                                                   starting to happen, with uncertain future
China will be heavily impacted by global slowdown
• Risk of pandemic-induced global slowdown, further escalation
  in trade war, and challenging US political narrative still
  present headwinds

© Oliver Wyman                                                                                                                    23
IMPACT ON FINANCIAL SERVICES: RISKS
Failures in SMEs and a slower income growth may pose a deeper impact on the economy; at the same time, it is often
difficult to target precisely with stimulus – defaults from those 2 sectors may pose significant further risks

SMEs facing survival crisis in the outbreak                                                                               China commercial bank NPL Ratio (%)

• SMEs are forced to shut down during the outbreak, and                                                                   9
                                                                                                                                      • COVID-19 may have larger impact on
  are hard to survive for more than 3 months due to cash

                                                                                                  SME loan default
                                                                                                                                        SMEs and individuals as large corp.
  flow constraints                                                                                                        8
                                                                                                                                        usually have better capability to cope
  – >90% postponed their business re-open date                                                                                          with uncertainties and can get more
  – >50% delayed for 2+ weeks and have no clear re-open                                                                   7             government support
     till now                                                                                                                         • Considering current credit cycle,
                                                                                                                          6
• According to PBOC, MSMEs contribute                                                                                                   increasing NPL is inevitable
                                                                                                                                                                                         5.5
  – >60% GDP and >50% tax                                                                                                 5           • However, if excessive credit easing
  – >80% employment in China now                                                                                                        policy is applied (e.g. extension for
                                                                                                                                        individuals and SMEs), NPL might be
                                                                                                                          4             even higher in the following cycles
Higher unemployment and lower personal disposable                                                                         3
income due to corporate layoff and SME failure                                                                                                                                           2.5
Disposable income growth rate (%)                                                                                         2

                                                                                                  Personal loan default
                                                                                                                                                                                 1.4
                                                       Oliver Wyman                                                       1
8
                                                          estimate
6                                                                                                                         0
                                                                                                                              07 08 09 10 11 12 13 14 15 16 17 18 19                20
4
2                                                                                                                               Basic case (Defaults naturally caused by epidemic
                                                                                                                                and the credit cycle)
0
     18 18 18 18 19 19 19 19 20 20 20 20                                                                                        Pessimistic case (Credit cycle overly suppressed caused
     Q1 Q2 Q3 Q4 Q1 Q2 Q3 Q4 Q1 Q2 Q3 Q4                                                                                        by excessive counter-cyclical easing policy)
Source: WIND, National Statistical Bureau, PBOC, Economy Daily, Postal Savings Bank of China, and Oliver Wyman analysis

© Oliver Wyman                                                                                                                                                                            24
IMPACT ON FINANCIAL SERVICES: OPPORTUNITIES AND CHALLENGES
While offline economy is hit hard by the outbreak, an opportunity window has opened for online businesses; it is also a
key takeaway for financial institutions

Online booming in retail space                                                                                Increasing usage of online financial services

                              • Ping’An Doctor daily consultation is                                            Online financial service to fulfil daily demand
                                9 times the average number before
                                the outbreak: total visitors reach 1.1BN                                        • Online banking & wealth management
            Online
                                                                                                                  – Alipay daily mutual fund purchase increased by 400% in
            healthcare        • 30% of consultation on DingXiangYuan is                                             first 2 weeks in Feb
                                about COVID-19, and visitors reading
                                                                                                                  – China Merchants Bank online wealth management
                                COVID-19 info reaches 28MM
                                                                                                                    customer interactions reached 240K in Feb
                              • Customers will be better educated for                                           • Online insurance brokerage
                                online fresh purchase after the outbreak
                                                                                                                  – Ant Financial insurance premium income in Feb is
            O2O        • For major players (incl. Miss Fresh, JDDJ,                                                 expected to grow by 30%
            E-commerce   Hema, Dingdong, Yonghui), transactions                                                   – Zhong’An has realized up to 100% daily premium income
                         during Spring Festival increased by 200%–                                                  growth since Jan 2th
                         350% compared to Spring Festival last year
                              • Daily active uesrs increased by 20%-100%
            Online              for major online education applications                                         Payment/instalment service support for increasing
            education           after launching online courses during                                           online service transaction
                                the outbreak

                                                                                                                To-B financial service
                              • New users drive increased growth rate1                                          • 2B SaaS platform
                                for remote office applications/software;
            Remote                                                                                                – a 2B turnkey asset management platform signed a
                                growth rate reaches 580%+ during 2020
            office                                                                                                  dozen new service contracts with FIs, including third-
                                Spring Festival; Dingding, Zoom and
            software                                                                                                party wealth management, insurance, trust companies
                                corporate WeChat reaches 703%, 662%
                                and 299% growth respectively                                                    • ERP system and cash flow management to support
                                                                                                                  business continuity

1. New user increase growth rate = (new user increase during 2020 Spring Festival – new user increase in 2019 Spring Festival)/new user increase during 2020 Spring Festival
Source: Questmobile, expert interview, internet data, Oliver Wyman analysis

© Oliver Wyman                                                                                                                                                                 25
KEY AGENDAS FOR CHINESE FINANCIAL INSTITUTIONS GOING FORWARDS
 We observe 7 key agendas to capture new growth opportunities and defend positions

                  Key Agenda             Rationale

            1
Offensive

                                         The outbreak future boosts online usage of financial services; traditional FS players should
                  Digital acceleration
                                         consider where to compete in the value chain as tech players further flourishing

            2     Health insurance
                  growth strategy
                                         With the promotion of insurance awareness by the outbreak, opportunities for health insurers
                                         are unprecedented and can be captured with well developed growth strategy

            3     Healthcare sector
                  holistic solution
                                         Develop sector specific solutions to ride with the potential healthcare boom after the outbreak
                                         will help banks generate substantial growth

            4
                  Supply chain
Agenda

                                         As the outbreak accelerates global supply chain to diversify production and sourcing lines out of
                  migration
                                         China, Chinese banks’ role along the shift should be redefined for new business opportunities
                  opportunities

            5     NPL Management
                                         NPL management will be essential for Chinese banks to deal with increasing bad loans after the
                                         outbreak and retain long-term creditworthiness

            6     Business continuity
                  management
                                         The outbreak put extensive pressure on business continuity management (BCM), which should
                                         have been developed and tested periodically during normal time

            7
Defensive

                                         As the global pandemic spreads, financial institutions and regulators should be prepared for a
                  Recession readiness
                                         potential global recession

 © Oliver Wyman                                                                                                                              26
04
FS IMPACTS: US PERSPECTIVES
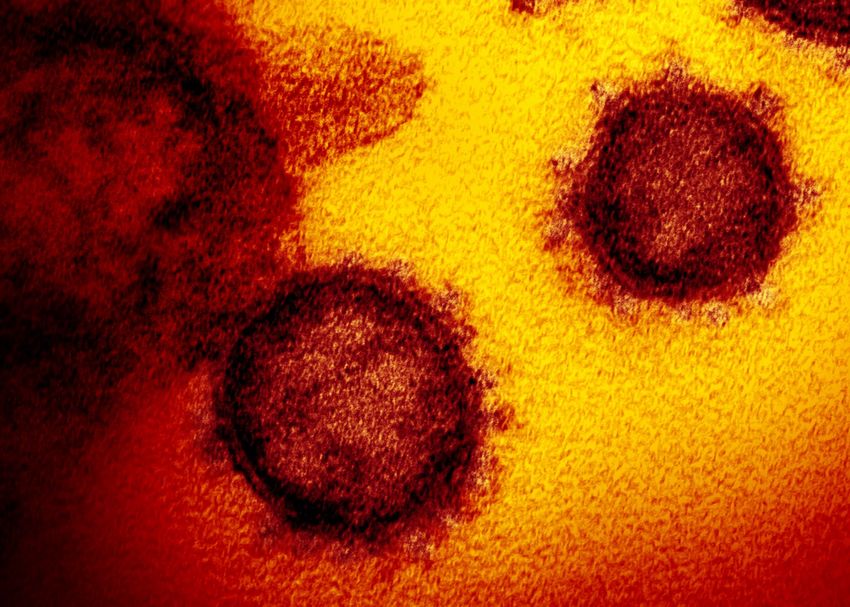
CCAR STRESS TESTING GDP DECLINE COMPARED TO 1918-20 GLOBAL
PANDEMIC ESTIMATE

US GDP Indexed to P0 (CCAR 20201) and 4Q07 (Financial Crisis)

100

  99

  98

  97

  96
                                                                                                                                                      “Spanish Flu” 1918-20
  95
                                                                                                                                                            (4.25% - 5.5%)2
  94

  93

  92

  91

  90
     P0                   P1                    P2                   P3                   P4                P5                P6               P7            P8           P9
   (4Q07)               (1Q08)                (2Q08)               (3Q08)               (4Q08)            (1Q09)            (2Q09)           (3Q09)        (4Q09)       (1Q10)
                                                                                                            PX CCAR projected quarter
                                                                  CCAR 2020            Financial Crisis
                                                                                                          (XXXX) Actual historical quarter

1. “CCAR 2020 data release” - Federal Reserve
2. “Economic Impact of an Influenza Pandemic on the United States” – Federal Reserve Bank of St Louis

© Oliver Wyman                                                                                                                                                                28
Actuals as of 03/12/2020

PEAK-TO-TROUGH EQUITY PRICES COMPARED TO CCAR MARKET SHOCKS

Dow Jones Total Stock Market Index (Relative to peak on Feb-19)
As of March 12, 2020
105
                                                                              100
100
  95
  90
  85
  80
                                                                                  74
  75                                                                                                                             72
  70
                                                                                                                                                                           67
  65
  60
                                                                                                                                                                           57
  55
  50
    Jan-                                Jan-                                 Peak                 Feb-                     March-                                    3m
     15                                  31                                  (Feb-                 28                       12                                      from
                                                                              19)                                                                                   peak

              Actual (Feb 19 peak = 100)             Global Market Shock (1 day) and Severely Adverse scenario (90 days) (CCAR-2020)    Financial crisis (worst 30 days)

Sources: FRB CCAR 2020 scenario disclosures (https://www.federalreserve.gov/supervisionreg/ccar-2020.htm); Thomson Reuters Datastream

© Oliver Wyman                                                                                                                                                             29
Actuals as of 03/12/2020

CURRENT MARKET VOLATILITY COMPARED TO FINANCIAL CRISIS AND CCAR 2020

CBOE Volatility Index (VIX)
As of March 12, 2020
90
                                                                                                                                                               81
80
                                                                                                                                                                  75
70                                                                                                                                                                  70

60

50

40

30

20

10

 0
 12-Jan               19-Jan               26-Jan               2-Feb                9-Feb               16-Feb              23-Feb        1-Mar    8-Mar            15-Mar

                                                                       Financial crisis (Q4 2018)          Actual VIX          CCAR 2020

Sources: FRB CCAR 2020 scenario disclosures (https://www.federalreserve.gov/supervisionreg/ccar-2020.htm); Thomson Reuters Datastream

© Oliver Wyman                                                                                                                                                            30
Actuals as of 03/12/2020

RATES: 10-YEAR TREASURY YIELD AND BBB YIELD

Historical 10-year Treasury yield                                                                       Most recent 10-year Treasury yield (Jan 15-March 12)

 6                                                                                                       6
                       5.2
 5                                                                                                       5

 4                                                                                                       4

 3                                                                                                       3
                                                                                         2.2
 2                                                                                                       2
                                                                       1.8
          Historical actuals                                                                                                                                       0.9
 1                                                                                                       1
          CCAR-2020
                                                                              1.0
 0                                                                                                      0
     2002 2004 2006 2008 2010 2012 2014 2016 2018 2020 2022                                             12-Jan 19-Jan 26-Jan 2-Feb 9-Feb 16-Feb 23-Feb 1-Mar 8-Mar 15-Mar

Historical BBB Corporate Yield                                                                          Most recent BBB Corporate Yield (Jan 15-March 11)

10                               9.4                                                                   10

 8                                                                                                       8
                                                                               6.5
 6                                                                                                       6

 4                                                                           3.3                         4                                                        3.4
          Historical actuals
 2                                                                                                       2
          CCAR-2020
 0                                                                                                      0
     2002 2004 2006 2008 2010 2012 2014 2016 2018 2020 2022                                             12-Jan 19-Jan 26-Jan 2-Feb 9-Feb 16-Feb 23-Feb 1-Mar 8-Mar 15-Mar
Sources: FRB CCAR 2020 scenario disclosures (https://www.federalreserve.gov/supervisionreg/ccar-2020.htm); Thomson Reuters Datastream

© Oliver Wyman                                                                                                                                                            31
KEY ELEMENTS OF PANDEMIC BUSINESS CONTINUITY PLANS
Every company should have a business resiliency team fully activated and focused on these key elements:

Protect your people first                    Look after your business interests        Secure your supply chain

      Ensure that your staff understand          Know which business processes             Clients need to develop an end-to-
      what to do (personal actions) to           and activities are critical and           end supply chain x-ray
      protect themselves, and to stop            require protection                        Identify your critical suppliers and
      the spread                                 Pay special attention to customers;       their locations, especially if in
      Ensure your staff know to stay away        determine how best to protect and         heavily impacted areas or with less
      from work if unwell and seek               assure them                               support resources available
      medical help; promote use of               Plan for how to continue operations       Confirm the status and location of
      telehealth                                 if you experience significant             expected deliveries/shipments
      Stay up to date on the latest travel       staff absences
                                                                                           Understand what your suppliers'
      advice as it could change quickly          Prepare for reductions (especially        plans are and work together to
      Be conscious that your staff may           consumer confidence) or increases         protect both of your interests,
      have caregiving responsibilities for       in demand (i.e., cleaning services,       particularly if a smaller business
      ill family                                 e-commerce)
      Listen to and respond to staff             Review your relevant insurance
      concerns – anxiety can be more             policies, coverage, and
      disruptive than the virus itself           claims processes
      Institute work from home policies
      if warranted

Source: Marsh Risk Consulting

© Oliver Wyman                                                                                                                    32
COVID-19 RESOURCES

          WHO COVID-19                    CDC Resources                    Oliver Wyman
         Situation Reports                                                  Perspectives

https://www.who.int/emergencies    https://www.cdc.gov/coronavirus/   https://www.oliverwyman.com/
/diseases/novel-coronavirus-2019           2019ncov/index.html                 coronavirus

© Oliver Wyman                                                                                   33
QUALIFICATIONS, ASSUMPTIONS AND LIMITING CONDITIONS
This report is for the exclusive use of the Oliver Wyman client named herein. This report is not intended for general circulation or publication, nor is it to be reproduced,
quoted or distributed for any purpose without the prior written permission of Oliver Wyman. There are no third party beneficiaries with respect to this report, and
Oliver Wyman does not accept any liability to any third party.
Information furnished by others, upon which all or portions of this report are based, is believed to be reliable but has not been independently verified, unless otherwise
expressly indicated. Public information and industry and statistical data are from sources we deem to be reliable; however, we make no representation as to the
accuracy or completeness of such information. The findings contained in this report may contain predictions based on current data and historical trends. Any such
predictions are subject to inherent risks and uncertainties. Oliver Wyman accepts no responsibility for actual results or future events.
The opinions expressed in this report are valid only for the purpose stated herein and as of the date of this report. No obligation is assumed to revise this report to
reflect changes, events or conditions, which occur subsequent to the date hereof.
All decisions in connection with the implementation or use of advice or recommendations contained in this report are the sole responsibility of the client. This report
does not represent investment advice nor does it provide an opinion regarding the fairness of any transaction to any and all parties.
You can also read