Retail Sourcing Report - Facts & Insights - Q1 2021 - CBX Software
←
→
Page content transcription
If your browser does not render page correctly, please read the page content below

Q1
                     2021

Retail Sourcing Report
Facts & Insights

Sponsored By
1

    FORWARD

    RETAIL SOURCING REPORT

    CBX S of t ware’s Retail S ourcing Repor t provides
    research and analysis aimed at informing global
    sourcing and buying decisions for retailers, brands
    and other sourcing and supply chain professionals.
    Each issue includes a snapshot of key information and
    trends impacting global sourcing, such as economic
    conditions in sourcing countries, container shipping
    trends, currency exchange and commodity rates. We
    also cover hot topics ourselves and include insight
    from analysts and other experts.

    If you like this content, please share:                           The Number 1 Collaborative Sourcing
    LinkedIn                                                             App for Retailers and Suppliers!

    Americas +1.858.264.1133                                                 www.tradebeyond.com
    Asia +852.2378.6300
    EMEA +49.89.9040.5110
    www.cbxsoftware.com

    Statement of Indemnity: CBX Software recommends that any information provided in this report be
    weighed against other sources and experts on the individual topics covered. As such, CBX Software
    bears no legal or fiscal responsibility for any potential harm or outcome which may result directly or
    indirectly from information provided in this report.
2

CONTENT

RETAIL SOURCING REPORT                               0
FORWARD                                              1
MANUFACTURING OUTLOOK (PMI)                          3
LOW COST COUNTRY SOURCING (LCCS) HIGHLIGHTS          4
     SOUTH EAST ASIA                                 4
     SOUTH AND WEST ASIA                             5
CHINA MINIMUM WAGE TRENDS                            6
LOW-COST COUNTRY SOURCING WAGE TRENDS                7
CONTAINER FREIGHT RATES & TRENDS                     8
TRADE CURRENCY RATES & TRENDS                        9
GLOBAL COMMODITY RATES & TRENDS                      10
     CRUDE OIL                                       10
     RUBBER                                          10
     METALS                                          10
     COTTON                                          11
     PLASTICS AND SYNTHETIC FIBERS                   11
QUALITY CONTROL INDICATORS                           12
FOCUS TOPICS                                         13
     COVID-19, E-COMMERCE ACCELERATOR                13
     THE OUTLOOK FOR GLOBAL TRADE IN Q4 AND BEYOND   14
ABOUT CBX SOFTWARE & TRADEBEYOND                     15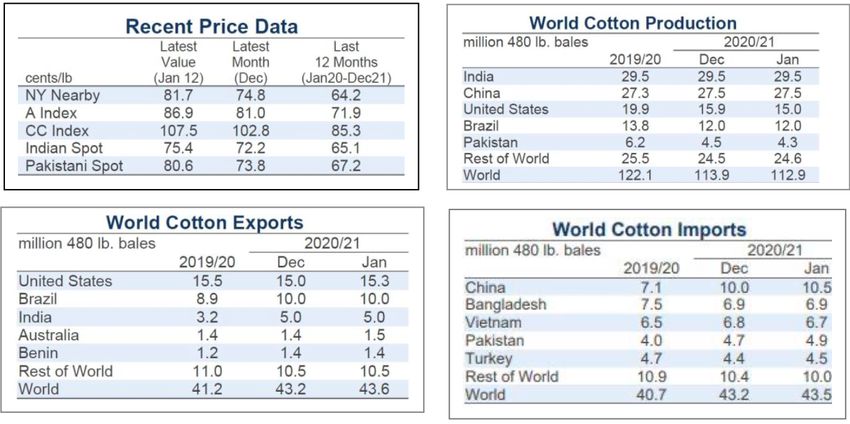
3       Purchasing Manager’s Index (PMI)

        To help understand industry and economic conditions in a country, the Purchasing Manager’s Index (PMI)
        tracks variables such as output, new orders, stock levels, employment, and prices across private companies
        in the manufacturing, construction, retail, and service sectors. A reading below 50 indicates contraction
        from the previous month, while a reading above 50 indicates growth. While over 40 countries and economic
        regions participate in various PMI surveys, this update looks at a short-list of emerging economies and key
        sourcing countries to provide indicative trends. (Data Source: IHS Markit)

Q1 2021 News and Analysis:

Global economies continued to recover into 2021 with most manufacturing economies seeing growth into the
first quarter of 2021. Output was limited in some cases by capacity constraints and raw material shortages as
the pandemic continued to impact supply chains. Mexico and Myanmar were two standouts that continue to
experience contraction due to a combination of political and pandemic related issues. Countries that managed
the pandemic especially well, such as China and Vietnam, have seen rapid recovery and look to have a strong
2021.

    © 1995-2021 Copyright by CBX Software. All rights reserved.
Low Cost Country Sourcing (LCCS) Highlights                                                                     4

This section looks at selected issues impacting sourcing from key LCCS destinations based on data available at the
time of printing the report, alongside official import/export numbers highlighting global sourcing trends.

Q1 2021 Summary: Asian economies continue to be heavily impacted by pandemic lockdowns, given they rely on trade
with each other as much as they do on consumer product exports to Western countries. Garment producing countries
such as Bangladesh and Cambodia continue to be hard hit by cancelled orders and factory shutdowns which have
resulted in mass unemployment and social unrest. The only Asian countries who are seeing growth, now and into
2021, are China and Vietnam.

South-East Asia

Cambodia – Cambodia acted firmly to contain the COVID outbreak by implementing strict lockdowns and limiting
the impact of the virus. The World Bank predicts that Cambodia’s economy will grow by 4% in 2021 compared to
contraction of 2% in 2020. Exports were strongest to the US, with European exports falling off due to withdrawal of
duty-free preferences.

Indonesia – While the Indonesian economy showed signs of recovery in Q4, the impact of COVID has lingered into
2021, with increased unemployment. Exports grew by almost 10% in 2020 based on stronger demand and healthy
prices for major commodities. The IT-CEPA trade agreement between with Turkey should be finalized in 2021 and is
expected to boost trade to $10 billion.

Philippines – The Philippines continued to struggle from the pandemic, with over 1500 cases a day and a general
quarantine still in effect. The Philippine economy was one of the hardest hit in Southeast Asia and is expected
to contract by at least 8% in 2020, Garment exports fell by 40%, with around 600.000 workers unemployed, but is
expected to recover in 2021.

Thailand – With Tourism heavily impacted by Covid-19, Thailand’s economy contracted by 6.5% in 2020, with the
second wave slowing recovery in Q1 of the new year. Industrial products account for 80% of the country’s exports and
should drive economic recovery in 2021.

Vietnam – Vietnam was one of few countries to see positive economic growth in 2020, with GDP growth of 2.9%.
Exports grew by 6.5% to $281.5 billion. The Vietnamese government is targeting growth of 6% in 2021 and has signed
new preferential trade agreements with the UK and South Korea. Additionally, more US firms are shifting production
and sourcing to Vietnam. While the US has accused Vietnam of intentionally devaluing their currency against the USD,
the US has not imposed sanctions on Vietnam’s exports.

                                                 Q1 2021 Retail Sourcing Report
5
        South and West Asia

        Bangladesh – Bangladesh exports increased marginally in the second half of 2020, signaling optimism for
        recovery in 2021. Minimum wage last increased in 2018 are still significantly lower than other countries in
        the region. The UK is growing their exports from Bangladesh, now ranking as the third largest apparel export
        market. The UK is also investing in Bangladesh and has established 100 special economic zones.

        India – India’s economy appeared to be in recovery mode as of Q4 and into 2021, with Covid numbers
        dropping, however lockdown measures continue to restrain the economy. The Indian government recently
        approved the extension of the Production-Linked Incentive (PLI) scheme to ten more sectors, including
        automotive components and textiles, which should encourage manufacturing investment in India.

        Pakistan – Pakistan’s exports improved through Q4, but concerns remain as Covid numbers began to pick
        up in November as the second wave hit. China has continued to invest in the China-Pakistan Economic
        Corridor which accounts for large amount of FDI. The government has also continued to offer incentives to
        support the textile and garment sector which accounted for 60% of exports during Covid.

        Turkey – While Turkey’s economy recovered through Q3 and Q4, they were hit by a second wave of Covid in
        late Q4 which could stall recovery in 2021. Turkey continues to suffer from inflation and weakness against
        the USD, however government intervention has kept employment numbers steady. Turkey’s positioning as a
        near-sourcing option for European retailers and brands should help their recovery in 2021.

        Sri Lanka – Sri Lanka is a small but strategic sourcing location, with China, the US and India all vying for
        influence. The US withdrew $500 million in economic aid in December, which was conditional on Sri Lanka
        containing China’s influence. According to Sri Lanka’s Export Development Board, 2020 was a successful
        year for exports, despite Covid, with merchandise exports reaching almost $10 billion.

                       Sources: News Reports, Statistical Bureaus, Li & Fung Group (charts)

    © 1995-2021 Copyright by CBX Software. All rights reserved.
China Minimum Wage Trends                                                                                                                               6

  Q1 2021 News & Analysis:

  By December 1, 2020, only three provinces in China had increased their minimum wage in the past year: Fujian,
  Qinghai, and Guangxi. These increases all happened early in Q1, prior to the widespread impact of COVID.

7 China’s economy went back into pre-pandemic growth mode during Q4 2020 mostly on demand for exports,
 pushing GDP into growth territory of 2.3% for the year. While China’s quick recovery is impressive, it does come
 China    Minimum
 with concerns,           Wage
                including the       Trends
                              gap between  production in consumption, as Chinese consumers focused more on
 saving than spending and wage growth slowed.
 Q4 2020 News & Analysis: It is almost redundant to still look at individual Chinese provinces and regions for the purpose of finding
  With
 an edge GDP
          in laborgrowth     for 2021
                   cost. For more         expected
                                  than a decade        to be
                                                the Chinese   above
                                                            central      8%, the
                                                                    government  hasInternational      Monetary
                                                                                    pushed their economy  away fromFund      forecasts
                                                                                                                      labor intensive    that China could
  overtake
 industry       thehigher
          towards    US value
                           as the   world’s
                                production andlargest
                                               focused oneconomy       by 2028,
                                                          growing domestic         aheadversus
                                                                              consumption    of earlier
                                                                                                  exports.predictions.
                                                                                                          Despite this policy exports
 grew strongly in Q3 and should continue to grow through Q2, 2022 assuming the pandemic recovery trend continues.

 Since 2005, the Chinese economy has grown from $2.3 trillion in GDP to $14.4 trillion in 2019, with average annual income increasing
 by at a similar ratio from $1750 to over $10,000. As China’s leaders sit down for their next five-year plan, we can be sure that similar
  Note: ofThese
 policies   managing  are   official
                         growth        wage
                                will mean      guidelines
                                          steadily              mandated
                                                   increasing minimum          by each
                                                                       wages across   China’sprovince
                                                                                               provinces andorregions.
                                                                                                                region based on information     publicly
  available    as  of   Oct   1, 2020.     As   such   these   numbers       serve   as   an   indicator.    Actual     wages
 Note: These are official wage guidelines mandated by each province or region based on information publicly available as of Oct 1,
                                                                                                                                   may include benefits,
  food,
 2020. Ashousing      etc. Minimum
          such these numbers   serve as anwage     isActual
                                           indicator. typically
                                                            wages40-60%
                                                                 may includeofbenefits,
                                                                                average food,total  wage.
                                                                                              housing etc. Minimum wage is typically
 40-60% of average total wage.

                                           2020 Minimum Wage Updates (official)
                                   Monthly Min Avg Wage
  City/Region/Province                                             Increase %                      Official Update
                                   (RMB)
  Anhui                            1,550                           20.6%                           Nov 1, 2019
  Beijing                          2,200                           3.8%                            Jul 1, 2019
  Fujian                           1,800                           7.4%                            Jan 1, 2020
  Chongqing                        1,800                           20.0%                           Jan 1, 2019
  Gansu                            1,620                           10.2%                           Jun 1, 2019
  Guangxi                          1,680                           16.7%                           Jan 1, 2020
  Guangdong                        2,200                           12.3%                           Jul 1, 2019
  Guizhou                          1,790                           6.6%                            Dec 1, 2019
  Hainan                           1,670                           12.6%                           Feb 1, 2019
  Heilongjiang                     1,680                           15.4%                           Oct 1, 2019
  Henan                            1,900                           8.2%                            Oct 1, 2018
  Hebei                            1,900                           14.8%                           Nov 1, 2019
  Hubei                            1,750                           13.1%                           Nov 1, 2019
  Hunan                            1,700                           13.6%                           Oct 1, 2019
  Inner Mongolia                   1,760                           8.0%                            Aug 1, 2019
  Jiangsu                          2,020                           8.1%                            Aug 1, 2018
  Jiangxi                          1,680                           15.1%                           Jan 1, 2019
  Jilin                            1,780                           22.5%                           Oct 1, 2019
  Liaoning                         1,810                           7.6%                            Nov 1, 2019
  Ningxia                          1,660                           12.4%                           Jan 1, 2019
  Qinghai                          1,700                           15.2%                           Jan 1, 2020
  Shaanxi                          1,800                           7.0%                            May 1, 2019
  Shandong                         1,910                           6.7%                            Jun 1, 2018
  Shanghai                         2,480                           2.5%                            Apr 1, 2019
  Shenzhen                         2,200                           4.9%                            Jul 1, 2018
  Sichuan                          1,780                           7.1%                            Jul 1, 2019
  Tianjin                          2,050                           5.1%                            Jul 1, 2019
  Tibet                            1,650                           17.8%                           Jan 1, 2019
  Xinjiang Uyghur                  1,820                           12.9%                           Jan 1, 2019
  Yunnan                           1,670                           10.6%                           May 1, 2019
  Zhejiang                         2,010                           8.4%                            Jan 1, 2019

                                                                    Q1 2021 Retail Sourcing Report
 © 1995-2020 Copyright by CBX Software. All rights reserved.
7       Low-Cost Country Sourcing Wage Trends

        Below is a snapshot of minimum wages in selected Asian sourcing locations, with the addition of Egypt,
        Ethiopia, and Turkey to give a comparative view. Wages vary by region or province and indicate either
        an estimated or actual/official rate. In cases with a distinct variance, we provide an average. Currency
        fluctuations mean that these figures are approximate at the time of finalizing this report.

Q1 2021 News & Analysis:

Despite some recovery from the worst impact of the pandemic, many workers across developing countries are
still unemployed, while wages have dropped across garment producing countries. Bangladesh factory owners
voted to suspend a 5% mandated wage hike for garment workers due to the ongoing pandemic impact. Over
350,000 workers in Bangladesh’s ready-made garment sector have lost jobs during the pandemic.

        Note: Figures are provided in USD/month based on currency exchange as of Jan 1, 2021. Minimum wage
        policies are updated as per data available at the time of finalizing this report and are based primarily on
        unskilled wages. Consult sources such as Fair Wage Guide or Wageindicator.org to assess and calculate
        benchmarks for wages in particular countries and regions not covered here.

         Sources: WageIndicator.org, SAFSA, Local News Reports

    © 1995-2021 Copyright by CBX Software. All rights reserved.
Container Freight Rates & Trends                                                                               8

  Q1 2021 News and Analysis:

  Rates on Asia-Europe and Asia-North America trade lanes have increased and held strong based on tight
  capacity control by the carriers. While carriers did add some capacity pre-Chinese New Year, factories face
  backlogs of orders and containers awaiting shipment sit stacked in dockyards as shippers wait for space and
  lower prices. While Beijing has tried to step in to stabilize rates, many importers on Asia-Europe routes with
  lower valued goods have had to abandon Asian exports due to the high rates. While rates to North America have
  remained steady, importers still face delays in getting shipments due to pandemic related constraints such as
  port congestion and delays at every step in the supply chain.

Asia - North Europe Trade Lanes

Asia - North Europe container shipping rates reached
record levels early in Q1 due to limited capacity ahead
of the Chinese New Year. Some factories with lower
cost products have extended their New Year Holiday as
some importers were unwilling to pay the higher costs.

The higher prices of shipments are creating a backlog
of containers at factories and dockyards, much of
which will be shipped after the holiday. European
retailers, especially the smaller importers are also
facing goods shortages as they cannot compete as
well for container space.

Asia – North America Trade Lanes

Container shipping pricing on trans-pacific routers
has held steady through Q4 and into 2021 due to tight
control of capacity by the carriers. On the backhaul,
reports indicate that 3 in 4 containers travelling back to
Asia are empyty compared to the usual 50%.

With annual contract negotiations underway, reports
indicate that market rates are at least 15% higher than
expected based on spot rates.

 Sources: IHS Markit, Joc.com, Alphaliner, SeaIntel

                                                     Q1 2021 Retail Sourcing Report
9       Trading Currency Rates & Trends

       Following are exchange rates and indicators for major currencies commonly factored into global sourcing
       costing estimations. China’s robust performance through the pandemic has pushed up the timeline to where
       China is expected to overtake the US as the largest economy to 2028. Currency reserves, mostly held in
       USD have fell to the lowest levels since 1996, with the yuan increasingly used as a reserve currency. Most
       forecasts are that the yuan will continue to strengthen against the USD through 2021. The euro is expected
       to continue to appreciate modestly against the dollar through 2021. Asia is expected to continue a strong
       recovery trend through 2021 which should put upward pressure on regional exchange rates.

          CBX Software helps you stay up to date with changing trading
                                                                                                          Learn More
          policies and new tariffs rule with our AI sourcing solution.

       EUR / USD (Feb 2020 - Feb 2021)
       Most analysts forecast the euro to continue a trend of appreciation against the dollar through 2021. The euro is
       expected to trade in the range of 1.20 to the dollar by the end of 2021. Factors which could influence the valuation
       include recovery from the coronavirus and the outcome of Brexit.

       EUR / CNY (Feb 2020 - Feb 2021)
       The euro and Chinese yuan have remained flat against each other, while the euro had gained around 10% against
       the dollar. Through 2021, the euro to yuan dynamic is expected to remain unchanged, however by late 2021 the
       yuan is likely to appreciate further.

       USD / CNY (Feb 2020 - Feb 2021)
       The Chinese yuan is expected to continue gaining strength against the USD through 2021 to between 6 and 6.5
       yuan to the dollar. Forecasts also indicated that the Chinese yuan will increasingly be used as a reserve currency,
       behind only the dollar and the euro.

                                                                      Sources: XE.com, News/Analyst Reports
    © 1995-2021 Copyright by CBX Software. All rights reserved.
Global Commodity Rates & Trends 10
Q1 2021 News and Analysis:
Commodity prices rebounded strongly through Q4 and into Q1 of 2021, driven by surging production demand
in China and recovering economies. Oil prices hit year-on-year highs as producers kept tight controls on supply.
The expectation for 2021 is that commodity prices will continue to move higher as the vaccine rollout drives
economic recovery and further stimulus measures are implemented. Some analysts are also talking about a
commodities super cycle, like the early 2000’s where China’s rapid growth drove oil and other commodities to
record prices. The next year or two will be interesting for commodities, but at minimum we can expect price
growth as global economies recover.
Crude Oil
Oil prices have surged through Q4 and into
Q1 towards $55 a barrel based on falling
inventories and tightly controlled capacity
by OPEC.
Optimism for the US economy over
new stimulus measures from the Trump
administration and the coming rollout of
the Covid vaccine have also driven oil prices
higher.
Rubber
Natural rubber prices have fallen off a
6-year recent high due to the pick-u of the
Chinese economy and a shortfall in supply
from key producing countries due to
covid-19 disruptions.
The forecast for rubber demand and prices
is positive assuming continued economic
recovery, ongoing economic stimulus, and
the successful rollout of a Covid vaccine.
Metal
Expectations are that metal prices will be
more stable in 2021 following volatility
in 2020. Supply shortages due to Covid
should be resolved and more predictable
demand from China should drive greater
stability.
While stimulus measures from the Biden
administration should drive demand, as
idle mills have restarted and demand from
China is expected to be lower.
Q1 2021 Retail Sourcing Report2000
10000 the pandemic recovery which
8000 1873
has fueled an industrial and
6000 1000
4000
manufacturing rebound. Going
2000 124
forward, waning stimulus
0 0 measures and the potential of
11 Cotton over-supply might impact pricing.
Metals are expected to see a
Tin Aluminum Copper Nickel
modest gain in prices in the
Zinc Lead Iron range of 2% for 2021.
Global cotton prices continued to rise through Q4 and into 2021 as production fell and demand increased from
Cotton
China, Pakistan, Mexico, Turkey, Vietnam, and Indonesia. Exports increased for the US, Australia, Mexico, and
LatestMali.
reports indicate a
Demand isdecrease in global cotton
much stronger (-934,000
production given
than expected thebales to 116.3
impact million)
of Covid, along
with Chinese and Indian textile mills
with an increase in global mill-use (+1.5 million bales to 114.2 million) through Q3/Q4. This has led to
operating at full capacity. While US exports are at historic highs, increasing oil prices
2.7 million bale reduction for 2020/2021 forecasts, which still leaves stockpiles at the one of the highest
should make synthetic
fibers more expensive but this is unlikely to immediately effect cotton prices.
on record. Both China and India reported higher than predicted mill-use and China imported more than Global cotton production is
expected
forecast. to fall
Prices have by 8%
increase in thesince
steadily coming season
pandemic to 24lows
induced million tons.
in early April and have held steady
partly due to Hurricane Delta which impacted the US cotton belt. While indicators are that cotton prices
should continue to rise into 2021, volatility could come from the outcome of the US election, ongoing
US/China (and US/Vietnam) trade tension and how long recovery from COVID-19 takes.
Speed
Scale
Simplicity
Source: Cotton Inc, News Reports
Sources: Cotton Inc, News Reports
Plastics and Synthetic Fibers
Q1 2021 Snapshot:
© 1995-2020 Copyright by CBX Software. All rights reserved.
Oil prices have climbed higher in recent months which should push synthetic fiber prices higher. The
market for synthetic fibers is expected to decline this year given the impact from Covid and with
concerns over the environmental impact of synthetic fibers.
© 1995-2021 Copyright by CBX Software. All rights reserved.12
Quality Control Indicator
This report frequently covers quality control and quality assurance issues. Audit and inspection data, provided by QIMA, which
tend to mirror sourcing activity, provide an indicator of activity and trends in various sourcing regions. Demand for inspections
mirrored the flow of economic recovery in the wake of Covid. Southeast Asia saw double digit increases in inspections through
the second half of 2020 which reflects the push towards alternative sourcing locations to China. Another trend was the shift
towards more electronic and virtual compliance as the pandemic limited in-person checks on quality control.
Sources: QIMA Data, News Reports
Q1 2021 Retail Sourcing Report13 Focus Topics: The Case for Nearshoring
Given the heavy impact of the pandemic on supply chains, many companies have turned to sourcing closer to
home or nearshoring to expand their sourcing options. A recent study by Blue Yonder and Coresight Research
found that 65% of retailers plan to expand their local and domestic manufacturing. Some of the reasons include
improved quality control, shorter lead times, better inventory management and adaptability to market demand.
One of the big issues many retailers are facing now is unsold inventory – in many cases, double the usual volumes.
The case for near-shoring is like the case for e-commerce – where products are available in real-time versus a
3-6-month cycle to source product from China.
One of the big challenges of a model that sources from Asia is the long lead times and advance planning. This was
a key factor in the success of UK based online retailers, Asos and Boohoo who did not have the scale to source from
Asia when they started. This gave them an advantage in their ability to launch innovative designs faster. In only a
few years, these online retailers have surpassed traditional retailers acquired long established brands such as Top
Shop.
Apparel shipments from China to
the US dropped by 39.16% to $15.16
billion. This drop is attributed to
Covid, but also to the US trade war
and shifting of apparel manufacturing
to other locations. China will still be
one of top two sources for apparel or
apparel inputs for the coming years
given their large capacity.
The trend of nearshoring, which was
picking up in recent years appears
different for US and European buyers.
Some reports indicate that US brands
were more likely to buy from factories
reopening in South Asia than from
Latin or South America, whereas
European brands continued to
increase their sourcing from countries
such as Morocco, Egypt and Tunisia,
which all saw double digit growth.
For the Americas, nearshore sourcing options might include South
and Central America and Mexico, whereas Eastern Europe and Turkey
would be closer to home than Asia. According to the Coresight survey,
Honduras, Mexico and El Salvador all saw import declines of around 30%,
despite enjoying duty-free status to the US, which suggest that a lot of
work needs to be done to shift sourcing closer to home. Other locations
such as Nicaragua and the Dominican Republic and countries that are
part of the Central America Free Trade Agreement also show promise.
Part of the challenge in shifting to sourcing closer to home is most of
the inputs are still made in China. If sources for parts materials can be
found closer to home, companies can then take advantage of shorter
lead times, smaller production runs and responds faster to the ups and
downs of market demand.
© 1995-2021 Copyright by CBX Software. All rights reserved.Retail Trends for 2021 14
There is no question that bricks and mortar retail, which faced challenges prior to the pandemic, is now facing an accelerated
threat to evolve or become irrelevant. Where and how people shop has changed and will keep changing. These are some of
the trends we expect to see in retail over the next year and beyond.
From Bricks to Clicks
Store closures was a trend even before the pandemic but will continue through 2021. Retailers such as Gap, Macy’s, Nordstrom,
Victoria’s Secret, Lord and Taylor and other have permanently closed numerous stores. Others have filed for bankruptcy/
restructuring over the past year including J.C. Penney, Neiman Marcus, and J. Crew. The likelihood is that Bricks and Mortar
retail will stay relevant by serving multiple functions, for example as a showroom to provide a touch and feel experience for
consumers.
Big Box Gets Bigger
Retailers that have done well through the pandemic were well positioned with e-commerce and omnichannel platforms and
had a wide product offering at cost-effective pricing backed by good customer service. This includes Amazon, Walmart, Costco,
and Target which offer a general assortment of products at a low cost with fast shipping and easy returns. The big box stores
have also done well with fulfillment trends such as Buy-Online-Pick-up in Store (or elsewhere) that have thrived through the
pandemic.
Buy Now, Pay Later
Another evolving trend which was growing
pre-pandemic but has accelerated with
increased online shopping is more flexible
payment options for consumers. Payment
providers such as Sezzle, Paybright, Afterpay
and others allow consumers to buy products
and split the payments over several weeks
or months, but the merchant gets paid right
away. Such solutions have helped retailers,
especially those selling bigger ticket items
to convert browsers into buyers.
Direct to Consumer
Direct to consumer brands will continue to grow as consumers shift loyalties to products that meet their functional
requirements, new brands launch direct and brand owners look to bypass wholesalers and retailers. Under Armour is the
latest consumer brand to announce bigger plans to sell direct through their own online channels and physical stores, l much
like Nike has done successfully. Coach owner Tapestry and Levi Strauss have gone the same route. The pandemic has only
accelerated this trend.
Digital Localism
Another trend that we have seen thrive through the pandemic and is likely to stick is digital localism, which covers consumers
buying closing to home, but also the option of picking up closer to home. In some cases, retailers have converted retail
locations to fulfillment centers. What we have also seen are e-commerce marketplaces that cater to consumers seeking
alternatives to Amazon, linking consumers with local stores. Also the trend of “second-life” products, where brands facilitate
the sale of used goods.
Q1 2021 Retail Sourcing Report16
About
CBX Software is the world’s leading Total Sourcing TradeBeyond is an exclusive community of retailers,
Management solution provider, from concept, to suppliers, and brands coming together to streamline
delivery – combining people, process and solutions. assortment planning, sourcing, quotations, and
CBX helps retailers and brands streamline product buying. TradeBeyond is not a marketplace; it’s a
development and sourcing, all the way through order & network and an app used by retailers to discover
production. CBX empowers the supply chain network new exclusive products and by suppliers to get
by driving collaboration to over 15,000 retail & supplier discovered and win more business! Visit www.
partners and 30,000 users in more than 50 countries. tradebeyond.com
For more information, visit www.cbxsoftware.com.
Americas +1.858.264.1133
Asia +852.2378.6300
EMEA +49.89.9040.5110
Click below to learn more about
how CBX Software can help!
Request a Callback Request a Demo
© 1995-2020 Copyright by CBX Software. All rights reserved.You can also read