Royal Bank of Canada Investor Presentation - RBC

 
CONTINUE READING
Royal Bank of Canada Investor Presentation - RBC
Royal Bank of Canada
Investor Presentation
Q3/2021

All amounts are in Canadian dollars unless otherw ise indicated and are based on financial statements prepared
in compliance w ith International Accounting Standard 34 Interim Financial Reporting, unless otherw ise noted.
Our Q3 2021 Report to Shareholders and Supplementary Financial Information are available on our w ebsite at:
http://w ww.rbc.com/investorrelations.
Royal Bank of Canada Investor Presentation - RBC
Caution regarding forward-looking statements

From time to time, we make written or oral forward-looking statements within the meaning of certain securities laws, including the “safe harbour” provisions of the
United States Private Securities Litigation Reform Act of 1995 and any applicable Canadian securities legislation. We may make forward-looking statements in this
presentation, in other filings with Canadian regulators or the SEC, in reports to shareholders, and in other communications. Forward-looking statements in this
presentation include, but are not limited to, statements relating to our financial performance objectives, vision and strategic goals, and the potential continued
impacts of the coronavirus (COVID-19) pandemic on our business operations, financial results and financial condition, and on the global economy and financial
market conditions, including projected economic indicators for 2020 with respect to Canada, the United States and the Euro Area. The forward-looking information
contained in this presentation is presented for the purpose of assisting the holders of our securities and financial analysts in understanding our financial position and
results of operations as at and for the periods ended on the dates presented, as well as our financial performance objectives, vision and strategic goals, and may not
be appropriate for other purposes. Forward-looking statements are typically identified by words such as “believe”, “expect”, “foresee”, “forecast”, “anticipate”,
“intend”, “estimate”, “goal”, “plan” and “project” and similar expressions of future or conditional verbs such as “will”, “may”, “should”, “could” or “would”.
By their very nature, forward-looking statements require us to make assumptions and are subject to inherent risks and uncertainties, which give rise to the possibility
that our predictions, forecasts, projections, expectations or conclusions will not prove to be accurate, that our assumptions may not be correct and that our financial
performance objectives, vision and strategic goals will not be achieved. We caution readers not to place undue reliance on these statements as a number of risk
factors could cause our actual results to differ materially from the expectations expressed in such forward-looking statements. These factors – many of which are
beyond our control and the effects of which can be difficult to predict – include: credit, market, liquidity and funding, insurance, operational, regulatory compliance
(which could lead to us being subject to various legal and regulatory proceedings, the potential outcome of which could include regulatory restrictions, penalties and
fines), strategic, reputation, legal and regulatory environment, competitive and systemic risks and other risks discussed in the risk sections and Significant
developments: COVID-19 section of our annual report for the fiscal year ended October 31, 2020 (the 2020 Annual Report) and the Risk management and Impact of
COVID-19 pandemic sections of our Q3 2021 Report to Shareholders; including business and economic conditions, information technology and cyber risks,
Canadian housing and household indebtedness, geopolitical uncertainty, privacy, data and third party related risks, regulatory changes, environmental and social
risk (including climate change), and digital disruption and innovation, culture and conduct , the business and economic conditions in the geographic regions in which
we operate, the effects of changes in government fiscal, monetary and other policies, tax risk and transparency, environmental and social risk, and the emergence of
widespread health emergencies or public health crises such as pandemics and epidemics, including the COVID-19 pandemic and its impact on the global economy
and financial market conditions and our business operations, and financial results, condition and objectives.
We caution that the foregoing list of risk factors is not exhaustive and other factors could also adversely affect our results. When relying on our forward-looking
statements to make decisions with respect to us, investors and others should carefully consider the foregoing factors and other uncertainties and potential events.
Material economic assumptions underlying the forward looking-statements contained in this presentation are set out in the Economic, market and regulatory review
and outlook section and for each business segment under the Strategic priorities and Outlook headings in our 2020 Annual Report, as updated by the Economic,
market and regulatory review and outlook and Impact of COVID-19 pandemic sections of our Q3 2021 Report to Shareholders. Except as required by law, we do not
undertake to update any forward-looking statement, whether written or oral, that may be made from time to time by us or on our behalf.
Additional information about these and other factors can be found in the risk sections and Significant developments: COVID-19 section of our 2020 Annual Report
and the Risk management and Impact of COVID-19 pandemic sections of our Q3 2021 Report to Shareholders.
Information contained in or otherwise accessible through the websites mentioned does not form part of this presentation. All references in this presentation to
websites are inactive textual references and are for your information only.

1                                                                                                                                                                   RBC
Royal Bank of Canada Investor Presentation - RBC
About RBC
Royal Bank of Canada Investor Presentation - RBC
The RBC story
          Diversified business  Well-diversified across businesses, geographies and client segments
          model, scale and      Able to capitalize on opportunities created by changing market dynamics and economic conditions
          leading client        Wide breadth of products and capabilities to meet our clients’ financial needs and build deep, long-term
          franchises             relationships
          Market leader with a
                                Market leader in Canada and one of the largest financial institutions globally(1)
          focused growth
                                Clear strategy for continued long-term growth in Canada, the U.S. and select global markets
          strategy
          Financial strength                          Track record of earnings and dividend growth while maintaining a disciplined approach to risk and cost
          underpinned by                               management
          prudent risk and                            Credit ratings amongst the highest globally
          cost management                             Strong capital position and a high-quality liquid balance sheet
                                                      Long history of innovation and proven ability to adapt to industry trends
          Innovation is in our                        Investments in technology allow us to drive efficiencies and deliver an exceptional client experience
          DNA                                         Focused on simplifying, digitizing and personalizing our products to make it easier for clients and employees to do
                                                       business, and to lower costs

                                                      Delivering signature programs with measurable social and environmental outcomes
                                                      Committed to accelerating clean economic growth – contributed $73.3 billion in 2020 towards our $500 billion
                                                       sustainable financing target by 2025 to help support the net-zero transition
                                                      Expanded ESG reporting suite: RBC’s 2020 Enterprise D&I Statement of Performance, second stand-alone TCFD(2)
                                                       Report, our first Human Rights Position Statement and updated our SASB(3) Index (found as an Appendix in the
                                                       2020 ESG Performance Report, page 70-76).
                                                      Powered by our technology partner, FutureFit AI, RBC Upskill is assisting youth in self-discovering their career
                                                       possibilities and potential by providing tailored advice on an ongoing basis, aligned to their confidentially-inputted
                                                       skills, interests, and experiences
          Leading corporate
                                                      $142 million given globally in 2020 through cash donations and community investments, including support to
          citizen
                                                       mitigate the economic impact of COVID-19
                                                      Our annual Employee Giving campaign went virtual in 2020 with 82% of employees participating in raising $23
                                                       million for over 5,000 charities across Canada
                                                      Continued to invest in skills development and mentoring programs through RBC Future Launch to create
                                                       meaningful opportunities for 25,000 Black, Indigenous and People of Colour (BIPOC) youth, and partnered with
                                                       Black Professionals in Tech Network (BPTN) to create the largest pipeline of young, early-career Black tech talent
                                                       in Canadian history
                                                      Committing up to $10 million annually through RBC Tech for Nature, in support of universities and charities that are
                                                       developing technology solutions to address climate change and related environmental issues
(1) Based on market capitalization as of July 31, 2021. (2) Task Force on Climate-related Financial Disclosures. (3) Sustainability Accounting Standards Board.

3 | ABOUT RBC                                                                                                                                                        RBC
Royal Bank of Canada Investor Presentation - RBC
Market leader with a focused strategy for growth

      Largest in Canada(1)                                Top 10 Globally(1)                   17 Million Clients
       A market leader across all key                     One of the 10 largest global banks   Served by 88,000+ employees
       businesses                                         by market capitalization with        worldwide
                                                          operations in 29 countries

        Purpose
        Help clients thrive and communities prosper

        Vision
        To be among the world’s most trusted and successful financial institutions
        Strategic Goals

                              In Canada: To be the undisputed leader in financial services

                              In the United States: To be the preferred partner to corporate, institutional and high
                              net worth clients and their businesses

                              In Select Global Financial Centres: To be a leading financial services partner
                              valued for our expertise

(1) Based on market capitalization as at July 31, 2021.

4 | ABOUT RBC                                                                                                                RBC
Royal Bank of Canada Investor Presentation - RBC
Diversified business and geographic model with client-leading franchises

Earnings by Business Segment(1)                                                                                 Revenue by Geography
Latest twelve months ended July 31, 2021                                                                        Latest twelve months ended July 31, 2021

                         Investor &
                          Treasury
                          Services
                             2%
                                   Insurance
                                       6%

                                                                                                                                            International
                         Wealth                                                                                                                  16%
                                                                Personal &
                       Management                               Commercial
                          17%
                                                                 Banking
                                                                    Personal &
                                                                       Commercial                                                       U.S.
                                                                        Banking
                                Capital                                   48%                                                        U.S.                                        Canada
                                                                                                                                                                                 Canada
                                Markets                                                                                              26%                                          58%

                                  Capital
                                  Markets
                                   27%

(1) Amounts exclude Corporate Support. These are non-GAAP measures. For more information, refer to Results by business segment section of our 2020 Annual Report and slide 59.

5 | ABOUT RBC                                                                                                                                                                             RBC
Royal Bank of Canada Investor Presentation - RBC
Strong financial profile
                                                  Maintaining a strong capital position with a disciplined approach to risk

Resilient Earnings                                                                                                     Premium Return on Equity(1)
Net income ($ billions)                                                                                           PCL (2) 0.23%                 0.31%             0.63%                             0.77%              (0.09)%
                                                                                                                  NIM (3) 1.64%                 1.61%             1.55%                             1.56%               1.50%
                       12.9                                                                                                                                                                                              19.2%
      12.4                                                                                    12.2
                                         11.4                                                                                   17.6%
                                                                                                                                                  16.8%

                                                                             8.2                                                                                    14.2%
                                                                                                                                                                                                       13.6%

     2018              2019              2020                            YTD 2020         YTD 2021                               2018              2019              2020                            YTD 2020          YTD 2021

Strong Capital Position                                                                                                Strong Leverage and Liquidity Ratios
                                                                                                                                Leverage Ratio                                                                        5.0%
                                                                                            16.7%
      15.3%                 15.5%                15.5%                 15.8%                                                    Liquidity Coverage Ratio                                                             125%
                                                                                            13.6%
                            12.5%                12.5%                 12.8%
      12.0%                                                                                                            Credit Ratings Amongst the Highest Globally

                                                                                                                                                           Moody’s                S&P                DBRS                Fitch
                                                                                                                        Legacy senior
                                                                                                                                                               Aa2                 AA-            AA (high)               AA
                                                                                                                        long-term debt(4)
                                                                                                                        Senior long-term
                                                                                                                                                                A2                   A                 AA                 AA-
                                                                                                                        debt(5)
      Q3/20                 Q4/20                Q1/21                 Q2/21                Q3/21
                                                                                                                        Outlook                              Stable              Stable             Stable              Stable
                    Total Capital                  Common Equity Tier 1 (CET1)

(1) Return on Equity (ROE). This measure does not have a standardized meaning under GAAP. For further information, refer to the Key performance and non-GAAP measures section of Q3 2021 Report to Shareholders. (2) Provision
for credit losses (PCL) on loans as a % of average net loans and acceptances. (3) Net interest margin (NIM) (average earning assets, net). (4) Ratings (as at August 24, 2021) for senior long-term debt issued prior to September 23,
2018 and senior long-term debt issued on or after September 23, 2018, which is excluded from the Canadian Bank Recapitalization (Bail-in) regime. (5) Ratings (as at August 24, 2021) for senior long-term debt issued on or after
September 23, 2018 which is subject to conversion under the Bail-in regime.

6 | ABOUT RBC                                                                                                                                                                                                                   RBC
Royal Bank of Canada Investor Presentation - RBC
Track-record of delivering value to our shareholders
          Financial performance objectives measure our performance against our goal of maximizing total shareholder returns
                                                                                                                                                                                                                   Average as of F2020(1)
                                                          Medium-Term Objectives
                                                                                                                                                                                                                   3-Year        5-Year

    Profitability
                                                       Diluted EPS growth                                                                 7%+                                                                         1%                           3%

                                                                    ROE(2)                                                               16%+                                                                      16.2%                        16.4%

     Capital                                     Capital ratios (CET1 ratio)                                                           Strong                                                                      12.0%                         11.6%
   Management                                         Dividend payout ratio                                                        40% – 50%                                                                         49%                          48%

Dividend(3) and Earnings(4) per Share ($): 2010-20 CAGR ↑8%                                                                           Tangible Book Value & Book Value Per Share ($)(4)
                                                                                            8.36        8.75
                                                                                 7.56                             7.82
                                                          6.73       6.78
                                               6.00
                                   5.49                                                                                                                                                                                                        43.3        45.5
                        4.91                                        2010-20 Average Dividend                                                                                                                                        40.1
             4.19                                                                                                                                                                                            32.7        35.8
                                                                    Payout ratio of 47%                                                                                                           31.1
  3.46
                                                                                                                                                                                      25.8
                                                                                                       4.07       4.29                                         19.5        22.2
                                                                                 3.48       3.77                                        18.1        17.5
                                                          3.08       3.24                                                                                                                                                           51.1       54.4        56.8
                                   2.53        2.84                                                                                                                                               39.5       43.3        46.4
  2.00       2.08       2.28                                                                                                            24.0        24.3       26.5        29.9       33.7

 2010 2011 2012 2013 2014 2015 2016 2017 2018 2019 2020                                                                                 2010 2011 2012 2013 2014 2015 2016 2017 2018 2019 2020
                      Earnings per share (diluted)                         Dividend per share                                                           Book value per share                   Tangible book value per share

                                            Achieved Solid TSR(5) Performance

                                                                                                          3-Year                    5-Year                               10-Year                         20-Year
                                             RBC                                                            12%                             14%                             14%                             12%
                                             Peer Average                                                    8%                             12%                             12%                             10%
(1) Diluted EPS growth is calculated using a Compound Annual Growth Rate (CAGR). ROE, CET1 and dividend payout ratio are calculated using an average. (2) ROE. This measure does not have a standardized meaning under GAAP. For further information, refer to the
Key performance and non-GAAP measures section of Q3 2021 Report to Shareholders. (3) Dividends declared per common share. Our current quarterly dividendis $1.08. (4) EPS, TBVPS and BVPS for 2010 were determined under Canadian Generally Accepted
Accounting Policies (CGAAP) framework. TBVPS is calculated as common equity excluding goodwill and other intangibles divided by common shares outstanding. (5) Annualized TSR is calculated based on the TSX common share price appreciation plus reinvested
dividend income. Source: Bloomberg, as at July 31, 2021. RBC is compared to our global peer group. The peer group average excludes RBC; for the list of peers, please refer to our 2020 Annual Report.

7 | ABOUT RBC                                                                                                                                                                                                                                                 RBC
Royal Bank of Canada Investor Presentation - RBC
Business Segments
Royal Bank of Canada Investor Presentation - RBC
Personal & Commercial Banking
 The financial services leader in Canada                                                                           Q3/2021 Highlights
      #1 or #2 market share in all key product categories
                                                                                                                    Clients (MM)                                                                                             14+
      Most branches and one of the largest mobile sales networks
       across Canada                                                                                                Branches                                                                                              1,228
      Superior cross-sell ability                                                                                  ATMs                                                                                                  4,298
 In 9 countries and territories in the Caribbean                                                                   Active Digital (Online and Mobile) Users(2) (MM)                                                          7.9
      3 largest bank by assets in English Caribbean
           rd                                      (1)
                                                                                                                    Employees (FTE)                                                                                     36,775
 Innovative direct banking to U.S. cross-border clients                                                            Net Loans & Acceptances(1) ($BN)                                                                      509.3
 Ongoing investments to digitize our banking channels
                                                                                                                    Deposits(1) ($BN)                                                                                     507.6
                                                                                                                    AUA(3) ($BN)                                                                                          356.1

Net Income ($ millions)                                                                                             Revenue by Business Line (4)

                        6,402                                                                                                    Canadian
      6,028                     234                                                                                              Banking
                168                                                                                                                96%
                       6,168           5,087
      5,860                                       10
                                       5,077                                                                                                 Personal
                                                                                                                                             Banking
                                                                                                                                               73%
                                                                                                                                                                                       Business
                                                                                                                                                                                       Banking
                                                                                                                                                                                         23%
                                                                                        2,113
                                                                                                 89
                                                                       1,367            2,024
                                                                                 37

                                                                        1,330                                                                                                               Caribbean
                                                                                                                                                                                              & U.S.
                                                                                                                                                                                             Banking
      2018             2019            2020                            Q3/20           Q3/21                                                                                                    4%
                  Canadian Banking                 Caribbean & U.S. Banking

(1) Based on average Balances. (2) This figure represents the 90-day active customers in Canadian Banking only. (3) AUA represents period-end spot balances and includes securitized residential mortgages and credit card loans as
    at July 31, 2021 of $14.6 billion and $2.9 billion, respectively (April 30, 2021 of $15.0 billion and $2.9 billion; July 31, 2020 of $16.2 billion and $6.7 billion). (4) For the quarter ended July 31, 2021.

9 | BUSINESS SEGMENTS                                                                                                                                                                                                         RBC
Personal & Commercial Banking
Strategic Priorities – Building A Digitally-Enabled Relationship Bank™
                                                 Make it easier for clients to access products and services digitally
 Transform How We
                                                 Create capacity and capability to focus on advice, complex servicing and sales, and problem resolution
 Serve Our Clients
                                                 Focus on innovating our branch network

                                                 Grow commercial market share through industry-specific credit strategies
 Accelerate Client                               Target high-growth retirement segment and business succession planning
 Growth                                          Continue to increase client acquisitions including key segments: high net worth, newcomers and students
                                                  and young adults while deepening existing client relationships

                                                 Continue to deliver leading digital capabilities and functionality through our award-winning mobile app
 Rapidly Deliver Digital
                                                 Create partnerships to innovate, making it easier to bank with RBC
 Solutions
                                                 Invest in research and development to understand and meet rapidly changing client expectations

 Innovate to Become                              Accelerate investments to simplify, digitize and automate for clients and employees
 a More Agile and                                Change or eliminate products and processes that do not add economic or client value
 Efficient Bank                                  Invest in employees to enhance digital, agile and change capabilities

Recent Awards

  North American Retail Bank of the                           Highest in Customer Satisfaction                 RBC won 10 out of 11 Ipsos    RBC received multiple awards from
  year for the 3rd consecutive year;                          Among the Big Five Retail Banks                 Financial Service Excellence   Celent for our leadership in digitally
  Best Latin/Caribbean Bank of the                            for a second consecutive year, a               Awards among the Big 5 Banks,         onboarding clients and
   Year; Best Loyalty and Rewards                             position RBC has now held for 5                 including Customer Service      transforming business payments;
   Strategy for the 2nd consecutive                                out of the past 6 years(2)                        Excellence(3)            the awards follow our 2020 global
                year(1)                                                                                                                       recognition as Celent Model Bank
                                                                                                                                                         of the Year(4)
(1) Retail Banker International, 2020. (2) J.D. Power, 2021. (3) Ipsos, 2020. (4) Celent Model Bank, 2021.

10 | BUSINESS SEGMENTS                                                                                                                                                        RBC
Personal & Commercial Banking – Canadian Banking
Solid Volume Growth ($ millions)(1)                                                                                                   Superior Cross-Sell Ability
                                                                                                                                       Percent of clients with transaction accounts, investments,
                                                                                                                                       borrowing and Credit Card products(2)

                                                                                                              489
                                                    429                                    446                                                                          19%
                                 375
              343

                                                                                                                                                                                                                             13%

                                 440                467                                    467                504
              417

             2018               2019               2020                                  Q3/20              Q3/21
                                                                                                                                                                        RBC                                         Peer Average (9)
                                Loans and Acceptances                                  Deposits
#1 or #2 Market Share in All Key Categories(3)                                                                                        Continued Efficiency Improvements While Investing For Growth

                                                                                       Market                                                                      NIE CAGR (10)                                FTE CAGR(11)
   Product                                                                                                      Rank                                             RBC Peer Average                             RBC Peer Average
                                                                                       share
                                                                                                                                                                 3%        2%                                 1%       -1%
   Personal Lending(4)                                                                  24.5%                       1
                                                                                                                                                                                                                                                     Peer
   Personal Core Deposits + GICs                                                        20.4%                       2
                                                                                                                                                                             47.7%                     47.4%                                       Average(9)
   Credit Cards(5)                                                                      28.3%                       1                              46.4%

   Long-Term Mutual Funds (6)                                                           32.1%                       1
                                                                                                                                                                                                       43.2%
                                                                                                                                                   42.5%
   Business Loans ($0-$25MM)(7)                                                         26.2%                       1                                                        41.8%                                                41.4%
   Business Deposits(8)                                                                 24.9%                       1
                                                                                                                                                    2018                       2019                      2020                  YTD 2021
(1) Based on average balances. (2) Canadian Financial Monitor by Ipsos – 18,000 Canadian individuals – data based on Financial Group results for the 12-month period ending July 2021; Cross-sell calculation methodology has been updated from previous quarters since
Q2/19.TFSA is considered an Investment. Peers include BMO, BNS, CIBC and TD. (3) Market share is calculated using most current data available from OSFI (M4), Investment Funds Institute of Canada (IFIC) and Canadian Bankers Association (CBA), and is at April 2021
and February 2021 except where noted. Market share is of total Chartered Banks except where noted. (4) Personal Lending market share of 6 banks (RBC, BMO, BNS, CIBC, TD and NA) and includes residential mortgages (excl. acquired portfolios) and personal loans as
at February 2021, excludes Credit Cards. (5) Credit cards market share is based on 6 banks (RBC, BMO, BNS, CIBC, TD and NA) as at February 2021. (6) Long-term mutual fund market share is compared to 7 banks (RBC, BMO, BNS, CIBC, TD, NA, and HSBC) and is at
April 2021. (7) Business Loans market share is of 6 Chartered Banks (RBC, BMO, BNS, CIBC, TD and NA) on a quarterly basis and is as of December 2020. (8) Business Deposits market share excludes Fixed Term, Government and Deposit Taking Institution balances. (9)
Peers include BMO, BNS, CIBC and TD; 2018 through 2020 reflects annual numbers. (10) Non-interest expense representing 2.5 year CAGR. (11) Number of employees (full-time equivalent) representing 2.5 year CAGR.

11 | BUSINESS SEGMENTS                                                                                                                                                                                                                                          RBC
Canadian Banking – Increasing client flows into mutual funds
 Increasing portion of net retail inflows have been invested into                                                                  % of total client net flows(1) into mutual funds
  mutual funds                                                                                                                      (Based on cumulative net flows since Q3/2020)
  o Inflows into mutual funds largely from savings accounts,
     chequing accounts and GICs
 Canadian Banking’s diversified fee-based revenue streams and
  improving credit quality have helped to offset the impact of lower
  net interest margin
  o Higher mutual fund distribution fees have driven higher non-                                                                                                                                                           25%
    interest income in Canadian Banking                                                                                                                                                              22%
  o Higher securities brokerage commissions, service charges,
                                                                                                                                                                                12%
    foreign exchange revenue and card service revenue reflecting
    increased client activity have also benefitted overall Canadian                                                                                        4%
    Banking revenue yields
                                                                                                                                        -2%

                                                                                                                                      Q3/2020          Q4/2020               Q1/2021               Q2/2021              Q3/2021

  Stable revenue yield despite lower interest rates                                                                                 Higher risk-adjusted NIM and revenue
       3.63%                                       3.65%                3.74%                 3.63%                                                                                                 3.57%                                3.60 %

                             3.59%                                                                           Flat
                                                                                                             YoY
                                                                                                                           3.20 %
                                                                                                                                                                                                                         3.50%
                                                                                                                                                                               3.47%                                              +10 bps3.50 %

                                                                                                                                                         3.45%                                                                     YoY
       1.06%                 1.03%                 1.12%                1.19%                 1.12%        +6 bps          3.00 %      3.40%
                                                                                                            YoY                                                                                                                          3.40 %

                                                                                                                           2.80 %

                                                                                                                                                                                                                                         3.30 %

                                                                                                                                       2.58%             2.56%
                                                                                                           (7) bps                                                             2.54%                2.55%                          (7) bps
       2.58%                 2.56%                 2.54%                2.55%                 2.51%
                                                                                                                           2.60 %
                                                                                                                                                                                                                         2.51%           3.20 %

                                                                                                             YoY                                                                                                                     YoY
                                                                                                                           2.40 %

                                                                                                                                                                                                                              +4 bps     3.10 %

                                                                                                                                                         2.42%
                                                                                                                                                                               2.35%                2.38%                2.38% YoY
                                                                                                                                       2.34%
                                                                                                                           2.20 %                                                                                                        3.00 %

       Q3/20                 Q4/20                 Q1/21                Q2/21                 Q3/21
                                                                                                                                       Q3/20             Q4/20                 Q1/21                Q2/21                Q3/21
                                                                       (2)
             Canadian Banking NIM                     CB NIR yield                CB revenue yield (3)                                                                                (4)                                                (5)
                                                                                                                                         CB NIM           CB risk-adjusted NIM                   CB risk-adjusted revenue yield

(1) Total client net flows include chequing, savings, and GIC deposits as well as net flows into Direct Investing and mutual funds. (2) CB NIR Yield is defined as Canadian Banking non-interest income divided by average earning assets.
(3) CB Revenue Yield is defined as Canadian Banking total revenue divided by average earning assets. (4) CB Risk -adjusted NIM is defined as Canadian Banking net interest income less PCL on impaired loans divided by average
earning assets. (5) CB Risk-adjusted revenue yield is defined as Canadian Banking revenue less PCL on impaired loans divided by average earning assets. (2-5) These metrics do not have a standardized meaning and may not be
comparable to similar measures disclosed by other financial institutions. For more information, see slide 59.

12 | BUSINESS SEGMENTS                                                                                                                                                                                                             RBC
Wealth Management
Strategic Priorities                                                                                                                        Recent Awards
 Global Asset Management: Deliver investment performance and                                                                                Best Private Bank for Digital Marketing & Communications –
  extend leadership position in Canada, while continuing to build and                                                                        North America
  grow in the US and EMEA/APAC                                                                                                               (PWM’s Global Wealth Tech Awards, 2021)
 Canadian Wealth Management: Continue to deepen client                                                                                      Best Private Bank for Digitally Empowering Relationship
  relationships and deliver a differentiated client experience that is                                                                       Managers – North America
  increasingly digitally-enabled and supported by data-driven                                                                                (PWM’s Global Wealth Tech Awards, 2021)
  insights                                                                                                                                   Corporate Social Responsibility / Diversity Award
 U.S. Wealth Management: Leverage the combined strengths of                                                                                 (WealthBriefing Europe Awards 2021)
  City National Bank, RBC Wealth Management U.S. and Capital                                                                                 Wealth Planning and CSR Awards
  Markets to accelerate growth in the U.S.
                                                                                                                                             (WealthBriefing Asia Awards 2021)
 International Wealth Management: In the British Isles,                                                                                     Innovative Client Solution
  accelerate organic market share growth to be a top-tier wealth
                                                                                                                                             (Family Wealth Report Awards, 2021)
  manager, providing solutions and insight to successful wealth
  creators. In Asia, continue to drive growth in Asia’s global families                                                                      Best Private Banking Services Overall – North America and
  by leveraging the global strengths and capabilities of RBC                                                                                 Canada
                                                                                                                                             (Euromoney Private Banking and WM Survey, 2021)
                                                                                                                                             Best in Serving Business Owners – North America and Canada
                                                                                                                                             (Euromoney Private Banking and WM Survey, 2021)
Cash Earnings ($ millions)(1)                                (2)                                                                            AUA and AUM ($ billions)                                (3)

                            2,736
         2,458               186
                                                                                                                                                                                                                                                                  1,293
          193                                  2,327
                                                172
                                                                                                                                                                      1,062                  1,100                                         1,097
                                                                                                                                                971                                                                                                                          976

                                                                                                                                                                                                       836                                            834
                            2,550                                                                                                                                               756
         2,265
                                               2,155                                                                                                     665
                                                                                                        776
                                                                                      606                         38
                                                                                               44       738
                                                                                      562

         2018               2019               2020                                Q3/20              Q3/21
                                                                                                                                                   2018                   2019                   2020                                         Q3/20                  Q3/21
                                   Net income                              Amortization                                                                                                              AUA            AUM
(1) Cash earnings exclude the after-tax effect of amortization of intangibles. This is a non-GAAP measure. For more information see slide 59. (2) 2019 net income includes the gain on sale of the private debt business of BlueBay ($134 million after -tax). (3) Spot Balances.

13 | BUSINESS SEGMENTS                                                                                                                                                                                                                                                      RBC
Wealth Management – Global Asset Management
                                                          Building a high-performing global asset management business
  Driving top-tier profitability in our largest Wealth Management business
    $586.8BN in client assets
    Investor asset mix of 53% Retail / 47% Institutional client assets
  Extending our lead in Canada
    Largest retail fund company in Canada, ranked #1 in market share capturing 32.2% amongst banks and 16.1% all-in(1)
    Strategic alliance between RBC Global Asset Management and BlackRock Canada connects clients to the largest and broadest
     ETF lineup in Canada
    3rd largest institutional manager of Canadian pension assets(2)
  Delivering strong investment capabilities to support growth
    Top performing investment firm with ~88% of AUM outperforming the benchmark on a 3-year basis(3)
    Continued growth of investment capabilities and innovative solutions for both institutional clients and retail investors

Canadian Retail Mutual Fund AUM ($ billions)                                                                            Diversified Asset Mix
       15.8%      16.1%        16.1%         16.1%        16.1%         16.2%        16.1%         16.1%
 380
                                                                                                                                  Q3/2021 AUM by Client Segment ($ billions) (4)
 360

                                                                                                               15. 0%
 340

                                                                                                    319.2
 320

 300                                                       286.5         288.0        302.9
 280

       258.1                    257.6         268.3
                                                                                                                                           17%
                                                                                                               12. 0%

                   232.5
 260

 240

 220
                                                                                                                                                                                      Canadian Retail
                                                                                                               9. 0%
 200

                                                                                                                                                                                      Canadian Institutional
 180

 160                                                                                                                               11%
 140                                                                                                           6. 0%
                                                                                                                                               $586.8BN              53%
                                                                                                                                                                                      U.S. Institutional
 120

 100

  80

                                                                                                               3. 0%

                                                                                                                                                                                      International Institutional
  60

  40

  20
                                                                                                                                       19%
   0                                                                                                           0. 0%

       Dec-19     Mar-20       Jun-20       Sep-20 Dec-20               Jan-21       Apr-21        Jul-21

               Canadian Mutual Fund Balance(1)                        All-In Market Share(1)

(1) Investment Funds Institute of Canada (IFIC) in July 2021 and RBC reporting. Comprised of long-term funds and money market prospectus-qualified mutual funds sold to Retail and Institutional clients.(2) Benefits Canada as at May
2021. (3) As at June 2021, gross of fees. (4) RBC GAM, based on period-end spot balances.

14 | BUSINESS SEGMENTS                                                                                                                                                                                                          RBC
Wealth Management
Canadian Wealth Management
                                                                                                                                                 Fee-based Assets per Advisor(1)
   Maintain profitable growth with strong pre-tax margin                                                                                                 ($ millions)
   #1 High Net Worth and Ultra High Net Worth market share in Canada(1)
                                                                                                                                                       1.80x the Peer
   Canadian leader in fee-based assets per advisor (1)                                                                                                   Average
   Consistently driving revenue per advisor of over $1.6MM per year, 23% above
    Canadian industry average(1)                                                                                                               137
   Strong asset growth complemented by favourable market conditions
   Leveraging enterprise linkages to extend market share gains
                                                                                                                                                                        76

U.S. Wealth Management (including City National)
                                                                                                                                               RBC             Cdn Peer Average
 RBC Wealth Management-U.S.
  7th largest full-service wealth advisory firm in the U.S. as measured by number of financial advisors and 6 th largest by assets under
   administration (2)
  Enhancing the client-advisor experience through a digitally-enabled, goals-based planning approach, and strengthening the range of advisory
   solutions and product offerings
  Continuing to attract and onboard new advisors, and clearing relationships while improving advisory productivity and operational efficiency
 City National
  A premier U.S. private and commercial bank that creates a platform for long-term growth in the U.S.
  Operates with a high-touch, branch-light client service model in selected high-growth markets, including: Los Angeles, the San Francisco Bay
   area, Orange County, San Diego, New York, Boston, and Washington DC
  Expanding the CNB business model to selected high-growth markets
  CNB recently launched a National Corporate Banking division that will specialize in meeting the complex banking and corporate finance needs of
   larger commercial and mid-corporate-sized companies across the country

International Wealth Management
  Growing market share in target markets
  Enhancing “One RBC” cross-platform connectivity
  Focusing on client service excellence
  Increasing business effectiveness and talent capabilities

(1) Strategic Insight (formerly Investor Economics), March 2021. (2) Source: U.S. wealth advisory firms quarterly earnings releases (10 -Q).

15 | BUSINESS SEGMENTS                                                                                                                                                             RBC
Insurance
Strategic Priorities                                                                                               Highlights
 Grow the Canadian insurance business: By focusing on
  providing innovative and competitive products, and leveraging                                                     Among the largest Canadian bank-owned insurance organizations,
  partnerships to expand value added client services such as virtual                                                serving more than five million clients globally
  health and wellness
 Maintain our leadership position in the creditor business: By                                                     #1 in individual disability (inforce business) with 32% (1) market share
  investing in new digital tools, delivering new pricing and product
                                                                                                                    #1 in individual disability net new sales with 41%(1) market share
  benefits, and developing new marketing programs to improve
  acquisition and retention through tighter integration with bank
  partners                                                                                                          #2 in Segregated fund net sales (2)
 Grow the longevity business in Canada and the UK: By                                                              RBC Guaranteed Investment Funds continue to be one of the
  enabling client base growth, long term investment returns, and risk                                               fastest growing segregated fund providers in Canada with YoY
  diversification strategies                                                                                        growth of 34%(2)
 Deepen client relationships across RBCI and RBC: By focusing
  on new client acquisition utilizing RBCI’s growing channels at
  lower acquisition cost

Net Income ($ millions)                                                                                            Premiums and Deposits ($ millions)

                                                                                                                                                4,950
                       806             831                                                                                      4,647   4,604
       775

                                                                                                                                2,063           2,457
                                                                                                                                        2,189

                                                                                                                                                                     1,131     1,321
                                                                                      234                                       2,584   2,415   2,493
                                                                      216                                                                                                        676
                                                                                                                                                                       595
                                                                                                                                                                       536       645
      2018            2019            2020                           Q3/20           Q3/21                                      2018    2019     2020                  Q3/20    Q3/21
                                                                                                                                            Canadian         International

(1) LIMRA Canadian Insurance Survey, 2nd Quarter, 2021. (2) Strategic Insights, Insurance Advisory Service Report, July 2021.

16 | BUSINESS SEGMENTS                                                                                                                                                                   RBC
Investor & Treasury Services
   Specialist provider of asset and treasury                                      Strategic Priorities
    services to institutional clients worldwide and
    a leader in Canadian cash management and                                       Grow income and market share among Canadian asset managers, investment counsellors,
    transaction banking services                                                   pension funds, insurance companies, and transaction banking clients

       Ranked #1 Fund Administrator Overall(1)                                    Compete in segments and markets which offer the highest risk-adjusted returns
       Ranked #3 Asset Servicer - Overall
        Globally(2)
                                                                                   Provide our clients seamless digital journeys and secure, robust and continuous service
       Named Best Trade Finance Bank in
        Canada for the ninth consecutive year(3)
                                                                                   Design and re-engineer our services to improve client satisfaction, efficiency and risk controls
   Short-term funding and liquidity management
    for RBC
                                                                                   Use technology and data insights to solve our clients’ current and future challenges

Net Income ($ millions)                                                   Average Deposits ($ billions)(4)                                               Efficiency Ratio
                                                                                                                                          215
                                                                                                     188                                                              74%
  741                                                                                     175                                 188                                                     73%
                                                                              161
                                                                                                                                                                             69%
                         536                                                                                                              151
             475                                                                         116         125                      126                             62%
                                               445                           103
                                                          331

                                                                             59           59          63                      63           64

 2018        2019       2020                  YTD        YTD                2018        2019        2020                     YTD         YTD                  2018    2019   2020   YTD 2021
                                              2020       2021                                                                2020        2021
                                                                                   Client deposits           Wholesale funding deposits

(1) R&M Fund Accounting & Administration Survey, 2020. (2) R&M Investor Services Survey, 2021. (3) Global Finance, 2021. (4) Totals may not add up due to rounding.

17 | BUSINESS SEGMENTS                                                                                                                                                                      RBC
Capital Markets
 A premier global investment bank with core operations across Canada, the U.S., the U.K./Europe, and APAC
     12th largest global investment bank by fees (1)

 Strategically positioned in the largest financial centres, focused on the world’s largest and most mature capital markets enc ompassing ~84% of the
  global investment banking fee pool(1)

 Recognized by the most significant corporations, institutional investors, asset managers, private equity firms, and governments around t he globe
  as an innovative, trusted partner with in-depth expertise in capital markets, banking and finance

Revenue by Business ($ millions)(2)                                         Revenue by Geography(3)                                         Net Income ($ millions)
                                                                                                                                                                                           3,267
                            1,403
                                                                                          5%                        Canada
   1,136       1,166        1,605                                                                                                             2,777             2,776
                                                                1,235             14%                                                                  2,666
                                                    1,048                                             27%
   1,238       1,347                                                                                                U.S.
                            2,275                   1,283        868
   2,006       2,120                                            1,688
                                                    1,669                                                                                                                         1,936
                            1,756                                                                                   U.K. & Europe
   2,107       1,672                                1,274       1,910

                            3,243                                                                                   Australia, Asia &
   2,122       2,150                                2,587       2,317
                                                                                        54%                         Other
   2018        2019         2020                 YTD 2020 YTD 2021

    Global Equities                      Repo & Secured Financing
    Lending & Other                      Investment Banking                                                                                   2018     2019     2020              YTD      YTD
    FICC                                                                                                                                                                          2020     2021

(1) Dealogic – August 2021. (2) Global Markets segment revenue has been restated to align select portfolios previously disclosed in Repo and Secured Financ ing to FICC and Global Equities. Revenue by
business only includes Corporate & Investment Banking and Global Markets, excluding CM Other. (3) For three months ended July 31, 2021.

18 | BUSINESS SEGMENTS                                                                                                                                                                             RBC
Capital Markets
Strategic Priorities

Drive Deeper, Multi-Product                Gain market share across all businesses and expand number of multi-product relationships
Client Relationships                       Expand client coverage in underpenetrated sectors and products

Lead with Advice, Empowered by  Grow Advisory & Origination and accelerate Sustainable Finance across all business areas
Ideas, Insights and Innovation  Enhance Sales & Trading client value and insights from scaled electronic and digital strategy

Leverage Cross Platform
                                           Foster cross-platform and geography collaboration across businesses and asset classes
Collaboration and Convergence

Invest in and Engage our Talent            Renew focus on talent development programs and accelerate Diversity & Inclusion strategy

Optimize our Business and
                                           Optimize balance sheet utilization and strategically reallocate resources
Efficiently Leverage Scale

Evolve our Brand as an
                                           Be recognized by our clients as an innovative, trusted partner with best-in-class capabilities
Innovative, Trusted Partner

Recent Awards                               Notable Deal Highlights

Received numerous points of recognition
in the 2021 Greenwich awards, based on
        peer interviews, including:          Lead Left Bookrunner on    Lead Left Bookrunner on     Lead Structuring Agent
                                                                                                                               Financial Advisor to
 #1 in Canadian      #1 in Canadian          Pet Valu’s C$316MM IPO     Alexandria Real Estate’s   and Joint Bookrunner on
                                                                                                                             Vattenfall on the Sale of
  Cash Equities     Equity Research /                                   US$1.3Bn Equity Follow-        Telus’ C$750MM
                                                                                                                              a 49.5% Stake in their
     Trading            Advisory                                        On; Largest REIT Equity      Sustainability Linked
                                                                                                                             HKZ Offshore Wind Farm
                                                                          Offering Since 2013       Bond; First SLB in the
          #1 in Canadian                                                                                                             to BASF
                                                                                                       Canadian Market
         Corporate Access

19 | BUSINESS SEGMENTS                                                                                                                            RBC
Capital Markets
Capital Markets Total Average Assets                                                                               Geographic Diversification Across Loan Book
($ billions)                                                                                                       Average Loans Outstanding by Region ($ billions) (1)

                                                                                                                            78                    65                    (23)                 (127)                 (337)
        777                                         743
                              709                                         695                   686                        101
                                                                                                                                                  87                     81
                                                                                                                            20                                                                 80                    80
                                                                                                                                                  19                     17                                          18
                                                                                                                                                                                               19
                                                                                                                            51
                                                                                                                                                  42                     38                    35                    35

                                                                                                                            30                    26                     26                    26                    27

     Q3/2020               Q4/2020               Q1/2021               Q2/2021               Q3/2021                    Q3/2020               Q4/2020               Q1/2021               Q2/2021               Q3/2021
                                                                                                                            Canada             U.S.          Other International             Total          PCL ($ millions)

                                                                                                                   Earnings Volatility vs. Canadian and U.S. Peers (Standard
Risk-Weighted Assets, Spot ($ billions)                                                                            Deviation / Avg Earnings)(2)

                                                                                                                                                                                                         30.8%

        217                                                                                                                                                          25.5%
                              209                   212                   209                   201
                                                                                                                                 20.3%

     Q3/2020               Q4/2020               Q1/2021               Q2/2021               Q3/2021                             RBC                          Canadian Peers                          U.S. Peers
(1) Average loans outstanding includes wholesale loans, acceptances, and off balance sheet letters of credit and guarantees f or our Capital Markets portfolio, on single name basis. Excludes mortgage investments, securitized
mortgages and other non-core items. This chart has been restated to exclude certain intergroup exposures that are not part of the corporate lending business. This is a non-GAAP measure. For more information see slide 59. (2)
Reflects pre-provision, pre-tax earnings, which is revenue net of PBCAE and non-interest expenses. This is a non-GAAP measure. For more information, please refer to slide 59. Canadian peers include BMO, TD, CIBC, BNS and NA,
US peers include JPM, GS, BAC, Citi and MS.

20 | BUSINESS SEGMENTS                                                                                                                                                                                                     RBC
Risk Review
Prudent risk management
                                          A disciplined approach and diversification have underpinned credit quality

Loan Book Diversified by Portfolio(1)                                                                    PCL Ratio on Impaired Loans (bps)

              Credit Cards                                Sm all
                  2%                                    Business                                             45
                                                           2%                                                40                                                                                37
                                                                                                                                                                                                                       Average historical actual
                                                                                                             35                                                                                                        loss rate (2) = 31 bps
                                                                                                                                 28           29
                                                                                                             30                                                       27
                                                                                                                                                          25
                                                                                                                                                                                                           23
                                                                                                             25     20                                                            21
                            Wholesale                                                                        20
                              32%                                                                                                                                                                                         15
                                                     Residential                                                                                                                                                                       13
                                                                                                             15                                                                                                                                    11
                                                     Mortgages
                                                                                                                    PCL ratio on                                                                                                                               8
                                                        51%                                                  10
                                                                                                                    impaired loans
                                                                                                              5

                                                                                                                                              Q2 /20 19

                                                                                                                                                                      Q4 /20 19

                                                                                                                                                                                                                                                               Q3 /20 21
                                                                                                                    Q4 /20 18

                                                                                                                                  Q1 /20 19

                                                                                                                                                          Q3 /20 19

                                                                                                                                                                                  Q1 /20 20

                                                                                                                                                                                               Q2 /20 20

                                                                                                                                                                                                           Q3 /20 20

                                                                                                                                                                                                                           Q4 /20 20

                                                                                                                                                                                                                                       Q1 /20 21

                                                                                                                                                                                                                                                   Q2 /20 21
                                 Personal
                                  Loans
                                   13%

Breakdown by Region of Total Loans and Acceptances(1)                                                    Breakdown of Canadian Total Loans and Acceptances(1)
                  Other                                                                                                                                                                       Atlantic
              International                                                                                                                                                                     5%
                                                                                                                                Manitoba/
                   6%
                                                                                                                                 Sask.
                                 U.S.                                                                                             6%
                                 16%
                                                                                                                                                  Quebec
                                                                                                                                                   12%
                                                                                                                                                                                              Ontario
                                                                                                                                                                                               47%
                                                    Canada                                                                                      Alberta
                                                     78%                                                                                          13%

                                                                                                                                                           B.C. and
                                                                                                                                                          Territories
                                                                                                                                                             17%

(1) Loans and acceptances outstanding as at July 31, 2021. Does not include letters of credit or guarantees. (2) Average annual actual loss rate from fiscal 2003 through to the most recent full year. The
information is updated on an annual basis and is based on consolidated results. The Average historical actual loss rate on a continuing operations basis is 0.31%.

22 | RISK REVIEW                                                                                                                                                                                                                                                           RBC
ACL declining with improvements in macroeconomic and credit quality outlook

Movement in Allowance for Credit Losses on Loans ($ millions)
                          ACL to L&A
                            0.89%
                                                       -
                                               ACL to L&A                                                                -
                                                 0.79%
                                                                       146
                                                                                           (638)                                 ACL to L&A
                                                                                                                                   0.67%
                                                                                                                 (166)

                             6,115
                                                  5,525
                                                                                           5,033                 4,867               4,867
     ACL to L&A
       0.53%

         3,471

     ACL (Q1/20)           Peak ACL            ACL (Q2/21)       PCL on Impaired     PCL on Performing    Net write-offs, FX &   ACL (Q3/21)
                            (Q4/20)                                  Loans                Loans                  Other

  ACL on loans of $4.9 billion was down $658 million QoQ, and ACL as a percentage of loans and acceptances of 0.67% was down 12 bps QoQ
    We continue to release reserves, which are down from a peak of 0.89% of loans and acceptances in Q4/20, in line with the economic
     recovery. During the quarter, we saw pandemic-related government restrictions easing and significant progress on vaccine distribution
    Our ACL remains above pre-pandemic levels of 0.53% of loans and acceptances. Uncertainty remains around the impact of the COVID-19
     Delta variant, and defaults continue to be mitigated by government support programs
  In Q3/21, we released $638 million of reserves on performing loans, which was ~2.5x our release last quarter, and reflects continued
   improvements in our macroeconomic outlook and the credit quality of our portfolios during the quarter
    The release of reserves on performing loans is primarily driven by Capital Markets ($284 million) and Canadian Banking ($281 million),
     primarily in the Cards and Personal Lending portfolios
  Our year-to-date release of reserves on performing loans of $995 million represents ~40% of provisions built during Q2 -Q4/2020

23 | RISK REVIEW                                                                                                                               RBC
GIL below pre-pandemic levels with new formations at 9-year lows
Gross Impaired Loans (GIL) ($ millions, bps)                                                                      Key Drivers of GIL (QoQ)
            57                                                                                                       Total GIL decreased $216 million (down 5 bps QoQ)
                                                                                                                    Canadian Banking
                                 47
                                                                                                                     GIL decreased $112 million, as muted new formations were more than
                                                      41                   40                                         offset by relatively stable write-offs, in both our retail and commercial
                                                                                                35                    portfolios
                                                                                                                    Capital Markets
                                                                                                                     GIL decreased $94 million, due to the resolution of two previously
         $3,857                                                                                                       impaired loans in the Real Estate and Related, and Mining and Metals
                              $3,195                                                                                  sectors
                                                   $2,872               $2,777               $2,561
                                                                                                                    Wealth Management (including CNB)
                                                                                                                     GIL decreased $18 million, as muted new formations were more than
                                                                                                                      offset by continued resolution of previously impaired loans (through
                                                                                                                      repayments or return to performing) at CNB
         Q3/20                Q4/20                Q1/21                Q2/21                Q3/21

New Formations ($ millions) (1)                                                                                      Net Formations ($ millions)
          1,265
                                                                                                                                                            (39)
           230
                                                                                                                                                                          (124) -
                                                                                                                                             293
           511
                                 551                                       605                                                                                                                    -
                                                      530
                                                       21                  106                                                                                                           (268)
            63                    53                                                            293
                                                       70                  114                   12
                                 226                   56                  78
                                                                                                 55
           461                   90                   383                                                                                                                                                (78)
                                                                           307                  48                           2,777
                                 182                                                            178
          Q3/20                Q4/20                Q1/21                Q2/21                Q3/21                                                                                                      2,561            2,561

                       Canadian Banking                     Caribbean & U.S. Banking                                       Q2/21 GIL        New     Returning to Repayments Write-Offs                  Other        Q3/21 GIL
                       Capital Markets                      Wealth Management                                                            Formations Performing

(1) New formations for collectively assessed portfolios in Canadian Banking and Caribbean Banking are net of amounts returned to perf orming, repayments, sales, FX, and other movements, as amounts are not reasonably
determinable.

24 | RISK REVIEW                                                                                                                                                                                                             RBC
PCL on impaired loans lower for the fifth consecutive quarter
Total RBC ($ millions, bps)                                              Wealth Management ($ millions, bps)
     23                                                                        21

                   15                                                                        0                         2            -1
                                 13
                                              11                               $43                       -13
    $398                                                     8                                                         $3
                                                                                            $0
                  $251          $218                                                         $-
                                             $177                                                                                   $(2)
                                                           $146                                          $(27)

    Q3/20        Q4/20         Q1/21         Q2/21        Q3/21              Q3/20         Q4/20        Q1/21        Q2/21         Q3/21

  Lower provisions QoQ in Canadian Banking, partially offset by          Provisions remain muted, with a $2 million net recovery in the
   lower recoveries QoQ in Capital Markets                                 quarter

Canadian Banking ($ millions, bps)                                       Capital Markets ($ millions, bps)

       23                                                                      25            27
                                  18
                                               16                                                          7
                    14                                      13
                                                                               $73           $68                                      -7
                                                                                                                       -13
      $264                                                                                                $18
                                 $217         $195
                   $169                                    $161                                                                     $(16)
                                                                                                                       $(29)

     Q3/20         Q4/20        Q1/21        Q2/21         Q3/21              Q3/20        Q4/20         Q1/21        Q2/21         Q3/21

  Retail: Lower provisions QoQ, primarily in personal lending and        In Q3/2021, a provision in the Transportation sector was more than
   small business. Provisions for residential mortgages and write-offs     offset by net reversals in the Real Estate and Related, and Oil and
   on cards were relatively stable QoQ                                     Gas sectors
  Commercial: Lower provisions QoQ, primarily due to reversals on        Lower recoveries QoQ, given higher reversals on previously impaired
   previously impaired accounts in the Automotive sector this quarter      loans in the Oil and Gas and Other Services sectors last quarter

25 | RISK REVIEW                                                                                                                            RBC
Commercial Real Estate (CRE) portfolio summary
Q3/2021 Highlights                                                                Exposure by Business Segment                              Exposure by Geography
 CRE exposure of $61 billion at Q3/2021                                                                                Other (2)
                                                                                                                         1%
  accounts for 8.5% of total loans and
  acceptances                                                                                      Wealth                                              Other
                                                                                                 Management                                        International
 Remains well-diversified by geography,                                                            18%                                                14%
  business, and property type
                                                                                                                                                                     Canada
                                                                                                                        P&CB                        U.S.              55%
                                                                                             Capital                                                31%
                                                                                                                         43%
                                                                                             Markets
                                                                                              38%

Exposure by Property Type
                                                                                                      Stable rent collections and occupancy rates supporting low delinquency rates
                                                                              Office                  Average LTV
Strong underlying credit quality in Canadian Banking
Canadian Banking PCL on Impaired Loans and Gross Impaired Loans                                                                                                CB Retail FICO Score Distribution (Q3/21)
                                      Q3/21 Avg PCL on Impaired Loans                             Gross Impaired Loans                       Avg                                                   720
Total                                     504.0             23           16           13            30           28              25          788                                            81%

 PCL and GIL ratios lower QoQ across all portfolios, reflecting low new formations, due in part                                                                Credit quality remains high with just 3% of the
  to the impact of ongoing government support                                                                                                                    portfolio with a FICO score below 620

CB Delinquencies By Days Past Due (bps) (5)                                                                            CB 30-89 Day Delinquencies by Product (bps) (5)
40                                                                                                                         160                  Q3/20         Q4/20         Q1/21        Q2/21         Q3/21
                                       30-59 Days              60-89 Days
35                                                                                                                         140
30                                                         9                                                               120
25                                                                                                                         100
                                                                                                                            80
20                                    7
                                                                                                       7                    60
15              5                                                                7
                                                          25                                                                40
10                                                                                                                          20
                                     17
               11                                                               12                   14
  5                                                                                                                          0
                                                                                                                                   Residential      HELOCs          Personal          Cards           Small        Commercial
  0                                                                                                                                Mortgages                         Lending                         Business
             Q3/20                Q4/20                 Q1/21                 Q2/21                Q3/21                                                           (Excluding
                                                                                                                                                                    HELOCs)
 30-89 day delinquencies of 21 bps increased 2 bps QoQ, with the                                                       Commercial and small business delinquencies were up QoQ, but are
  increase coming in loans 30-59 days past due                                                                           lower YoY, and remain at or below pre-pandemic levels
(1) Calculated using average net of allowance on impaired loans. (2) Includes $11BN of mortgages on multi-unit residential buildings originated in P&CB Business Banking. (3) Represents 90+ Days Past Due, as there are no GIL
balances for Credit Cards. (4) In Q2/21, following capital treatment guideline change, ~$5.4BN of exposure previously classif ied as Commercial was reclassified as Small Business exposure. (5) Includes restrained accounts, where
loans 30-59 days past due result from administrative processes, such as mortgage loans where payments have been restricted pending payout due to sale or refinancing.

27 | RISK REVIEW                                                                                                                                                                                                                  RBC
Canadian residential portfolio has strong underlying credit quality
Q3/2021 Highlights                                                                                                      Canadian Banking Residential Lending Portfolio(1)
  Strong underlying quality of uninsured residential lending portfolio(1)                                                                                               Total $349BN                  Uninsured $275.3BN
       53% of uninsured portfolio have a FICO score >800                                                                                                                    $314BN                             $240.3BN
                                                                                                                        Mortgage
  GTA and GVA average FICO scores remain above the Canadian                                                            HELOC                                                 $35BN                               $35BN
   average                                                                                                                     (2)
                                                                                                                        LTV                                                     49%                                 47%
  Only 1.4% of our residential lending portfolio has an LTV >80% and
                                                                                                                             GVA                                                45%                                 45%
   FICO score of 720 or lower, and is predominately all insured
                                                                                                                             GTA                                                46%                                 46%
  Condominium outstanding balance is 11% of residential lending
   portfolio                                                                                                            Average FICO           Score (1)                         801                                806
                                                                                                                        90+ Days Past          Due (1)(3)                     15 bps                              11 bps
                                                                                                                           GVA                                                 9 bps                               9 bps
                                                                                                                           GTA                                                 6 bps                               6 bps

 Canadian Residential Mortgage Portfolio(2) ($ billions)                                                                Canadian Banking Residential Lending Portfolio(1)
                                                    LTV (1)                                                                   LTV (2)                                                                        FICO Scores
         47%               46%               59%               51%              52%               51%                                           3%
                                                                                                                              >80%                                                                                >720
     $164.6
                                                                                                                                                                                                                  681-720
                                              Insured         Uninsured                                                                                                 16%
                                             $100.0             $246.0                                                  65%-80%                                                                                   620-680
        79%
                                             (29%)              (71%)

                                                                                                                                                                                   23%
ACL coverage: Lower-risk residential mortgages a large part of our balance sheet
  Allocation of ACL by Product
                                                                       Q2 / 2021                                                                                 Q3 / 2021

                                                          % of Loans & Acceptances                                                                    % of Loans & Acceptances

           Product                   Stage 1          Stage 2        Stage 1 & 2         Stage 3             Total               Stage 1          Stage 2       Stage 1 & 2   Stage 3     Total
Residential mortgages (1)              0.1%              2.1%             0.1%            22.0%             0.14%                  0.1%              2.2%          0.1%       23.2%      0.12%
Other Retail                           0.8%             12.9%             2.1%            38.4%             2.20%                  0.8%             12.2%          1.8%       39.0%      1.92%
     Personal                          0.6%              9.2%             1.3%            41.4%             1.41%                  0.6%              8.9%          1.2%       42.7%      1.28%
     Credit cards                      2.4%             25.6%             6.8%                -             6.84%                  1.9%             24.7%          5.5%          -       5.54%
     Small business                    0.9%              4.6%             1.4%            31.9%             1.70%                  0.9%              3.8%          1.3%       31.8%      1.55%
Retail                                 0.2%             8.9%              0.6%            27.7%             0.65%                  0.2%             9.1%           0.5%       28.3%      0.56%
                (1)
Wholesale                              0.4%             4.8%              0.9%            30.6%             1.14%                  0.3%             5.3%           0.7%       31.9%      0.95%
Total ACL                              0.3%             6.7%              0.7%            29.5%             0.79%                  0.3%             7.1%           0.6%       30.5%      0.67%

  Allocation of Loans By Product Within Each IFRS 9 Stage
                                                                       Q2 / 2021                                                                                 Q3 / 2021

                                                          % of Loans & Acceptances                                                                    % of Loans & Acceptances

           Product                    Stage 1          Stage 2        Stage 1 & 2         Stage 3        Total ($BN)              Stage 1          Stage 2      Stage 1 & 2   Stage 3   Total ($BN)
                               (1)
 Residential mortgages                 97.8%             2.0%             99.8%             0.2%             357.8                 98.5%             1.3%          99.8%       0.2%       370.5
 Other Retail                          89.5%            10.2%             99.7%             0.3%             118.2                 90.7%             9.1%          99.7%       0.3%       121.2
     Personal                          91.6%             8.1%             99.7%             0.3%              90.5                 92.4%             7.3%          99.8%       0.2%        92.2
     Credit cards                      80.9%            19.1%            100.0%             0.0%              16.6                 84.1%             15.9%        100.0%       0.0%        17.4
     Small business                    85.0%            13.9%             99.0%             1.0%              11.1                 86.3%             12.8%         99.1%       0.9%        11.6
 Retail                                95.7%             4.0%             99.8%             0.2%             476.0                 96.6%             3.2%          99.8%       0.2%       491.6
                 (1)
 Wholesale                             88.7%            10.5%             99.2%             0.8%             212.8                 91.3%             8.0%          99.3%       0.7%       219.5
 Total Loans                           93.6%             6.0%             99.6%             0.4%             688.7                 94.9%             4.7%          99.6%       0.4%       711.1
(1) Items not subject to impairment are loans held at FVTPL: Residential mortgages (Q3/21: $252MM, Q2/21: $243MM); Wholesale (Q3/21: $10.6BN, Q2/21: $8.6BN).

29 | RISK REVIEW                                                                                                                                                                                      RBC
Technology @ RBC
Investors value RBC for its industry-leading franchises and innovative approach

                                                 7.9MM active digital users (1)                                                                                               4 Borealis AI     labs connected
                                                 2.6MM+ clients on-boarded                                                             Data &                                    with top universities across
   Creating More
                                                     onto MyAdvisor with a                                                             Artificial                                 Canada, with 40+ PhDs
       Value
                                                     personalized plan                                                               Intelligence                              1.9BN+               insights read by
    for Clients                                     5.4MM active mobile clients(1)                                                    Insights                                   clients on NOMI in the RBC
                                                     on the RBC Mobile app                                                                                                        Mobile app(2)

        Driving                                                                                                                     Innovation                                 6 innovation labs globally
      Efficiency &                               584MM client transactions                                                          Ecosystem                                 14 RBC Ventures in market
      Operational                                    daily(3)                                                                            &                                     #1(4) workplace in Canada to
       Excellence                                                                                                                   Partnerships                                  grow your career

(1) These figures (in 000s) represent the 90-Day Active customers in Canadian Banking only and are spot values. (2) Insights read on a launch to date basis. (3) Daily average number of transactions. (4) Based on LinkedIn’s 2021 Top
Companies in Canada list

31 | TECHNOLOGY @ RBC                                                                                                                                                                                                            RBC
Our technology platforms are enabling all businesses to exceed client expectations

32 | TECHNOLOGY @ RBC                                                          RBC
We have developed a rich innovative ecosystem that attracts top talent

                         Unique Partnerships
                         (FinTech, Big Tech)

  6 Innovation Labs                                 Research
  around the world                                 Institutions

 Fostering Engineering                         RBC Ventures,
  & Innovation Culture                         Incubators and
                                                Accelerators

                          Digital RBC

33 | TECHNOLOGY @ RBC                                                    RBC
Our 14MM+ Canadian Banking clients continue to adopt our digital channels
        Active Digital Users (000s)(1)                                           Digital Adoption Rate (2)                                      Active Mobile Users (000s)(1)

                              5%                                                                260 bps                                                                 10%

                              7,873               7,876                                            56.8%               56.4%                                                                5,394
                                                                                                                                                                        5,266
          7,527                                                                53.8%                                                                4,917

         Q3/20               Q2/21                Q3/21                         Q3/20               Q2/21               Q3/21                       Q3/20              Q2/21               Q3/21

           Mobile Sessions (000s)(3)                                          Self-Serve Transactions(4)                                                         Branches

                             27%                                                               (100) bps                                                                (1)%
                                                                               94.5%
                          111,616             111,634                                             93.5%                93.5%
                                                                                                                                                     1,204
                                                                                                                                                                         1,193               1,189
       87,994

        Q3/20               Q2/21              Q3/21                          Q3/20               Q2/21                Q3/21                        Q3/20               Q2/21               Q3/21

(1) These figures (in 000s) represent the 90-Day Active customers in Canadian Banking only and are spot values. (2) Digital Adoption rate calculated using 90-day active users. (3) These figures (in 000s)
represent the total number of application logins using a mobile device. (4) Financial transactions only.
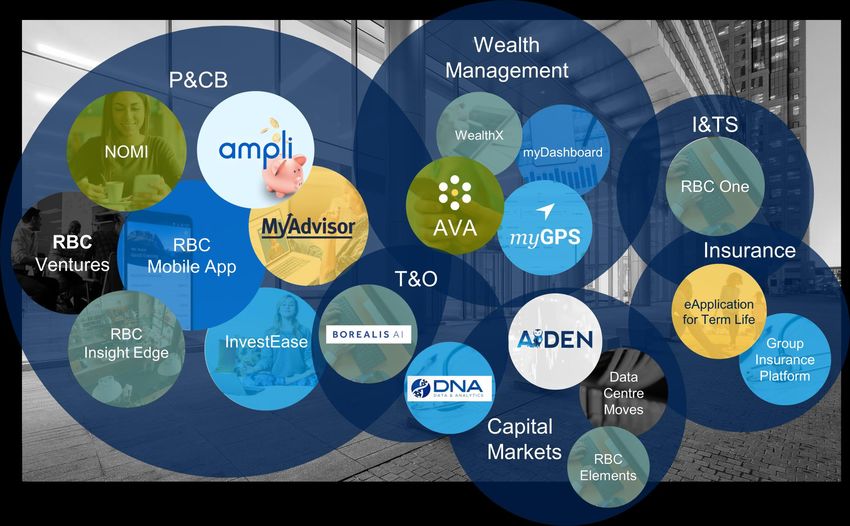
34 | TECHNOLOGY @ RBC                                                                                                                                                                                 RBC
RBC Ventures
Ventures moves RBC
beyond traditional
banking to deliver
unique value for all
Canadians                                                            Helping retirees make
                                                                         connections
                                                                                                         Helping doctors with their billing
                                                                                                                     needs

                                 Public transit arrival times and                                                                      Helps entrepreneurs start their
                                            locations                                                                                            business

                                                             Mobility                     INNOVATIVE
                                                                                                                            Health
                                                                                        PRODUCT LEADER                    & Wellness

                      Connecting consumers to                                                                                                             Helping newcomers be
                         trusted contractors                                                                                                              successful in Canada
                                                                    PROPRIETARY                                   STRATEGIC
                                                                     REW ARDS                                   PARTNERSHIPS

                                                    Hom e                                                                                B2B

                 New home searching                                                                                                                        Finding dream jobs for recent
                     made easy                                                                                                                                      graduates
                                                                      DATA AND
                                                                                                                  DIVERSIFIED
                                                                    TECHNOLOGY
                                                                                                                 DISTRIBUTION
                                                                       SCALE

                                                                                         PERSONALIZED
                          Keeping you in the know                                           ADVICE                              B2C
                                                         U.S. Ventures                                                                         Financial literacy for kids and
                             on the little things
                                                                                                                                                           parents

                                                        Making moving                                                           Earning cashback at
                                                         hassle free                                                              local merchants

                                                                                  Amplifying cash back across national
                                                                                                 brands

  36 | RBC VENTURES                                                                                                                                                                        RBC
Environment, Social & Governance (ESG)
ESG performance highlights: Putting our Purpose into practice
                                                               Royal Bank of Canada is a purpose-driven, principles-led organization

           How we deliver value

    Building & attracting talent                                          Sustainable finance and                                     Climate change: accelerating clean                                              Preparing youth for the
     and driving a diverse &                                              responsible investment                                               economic growth                                                            future of work
         inclusive culture

  • 46% women executives(1) and                                    • $73.3 billion(4) in sustainable     • Enterprise climate change strategy, RBC • Through RBC Future Launch,
    42% women(1) on RBC’s Board                                      finance in 2020, building towards     Climate Blueprint, aims to support clients we are dedicating $500
    of Directors                                                     our target of $500 billion by 2025    in the net-zero transition                 million over 10 years to help
                                                                                                                                                      young people gain meaningful
  • 21% of executives(1)(2) are                                    • Successfully completed a US$750 • Joined pilot project on climate risk           employment through work
    BIPOC                                                            million Green Bond offering in        scenarios stress testing led by the Bank   experience, skills
                                                                     Q3/2021, in partnership with a        of Canada and OSFI                         development and networking;
  • #4 globally in the Refinitiv                                     syndicate of diverse-owned broker                                                we have reached over 2.5
    Diversity & Inclusion Index,                                     dealers                             • Joined PCAF to advance the
                                                                                                                         (5)                          million(4) Canadian youth
    ranking over 9,000 listed                                                                              measurement of our indirect emissions      through 500+ partner
    companies                                                      • Focused strategy to integrate ESG                                                programs since 2017
                                                                     across all businesses in Capital    • Committed to net-zero emissions in
  • Increasing our staffing goals for                                Markets led by a dedicated            our lending by 2050 and carbon neutral • Committed to investing $50
    BIPOC executives from 20% to                                     Sustainable Finance Group             in our global operations since 2017        million from 2020 to 2025 to
    30% with a focus on increasing                                                                                                                    create meaningful and
    Black and Indigenous                                           • Total value of socially responsible • Over 125 organizations supported with      transformative pathways to
    representation(3)                                                investments and impact assets         over $27 million in funding through RBC    prosperity for 25,000 BIPOC
                                                                     under management grew to $12.5        Tech for Nature since 2019                 youth(3)
                                                                     billion (4)

    RBC is recognized as an “Outperformer” or “Leader” by our top tier ESG rating agencies (6) and indices, including:

                                                                                                                                                                                                                                ‘A-’ score for our
   Banking industry ranking                                      ESG Risk Rating of                                                                                           Overall score 78
                                                                    16.9 (low risk)                                            “A” Rating                                                                                         2020 Climate
      in 98th percentile                                                                                                                                                      90th percentile                                   Change response
(1) Represents data as at October 30, 2020 for our businesses in Canada governed by the Employment Equity Act (Canada); Board composition is reflective as of February, 2021. (2) Based on employee self-identification and aligned to the definitions of the Employment
Equity Act in Canada. (3) RBC’s Actions Against Systemic Racism. (4) As of FY2020. (5) The Partnership for Carbon Accounting Financials (PCAF). (6) Includes Sustainalytics, FTSE4Good, MSCI, VigeoEIRISand S&P Corporate Sustainability Assessment. As of FY2020.

38 | ESG                                                                                                                                                                                                                                                           RBC
Our suite of ESG disclosures
Annual voluntary and regulatory ESG performance disclosures

  ESG Performance Report      Public Accountability Statement
                                                                             TCFD Report
      & SASB Index                        (PAS)                                                             City National CSR         Corporate Governance and
                                                                                                                  Report         Responsible Investment Annual Report

     RBC Green Bond             RBC Enterprise
         Report               Diversity & Inclusion             A Chosen Journey            Employment                                         Modern Slavery Act
                                                                                                                     RBC GAM
                                 Statement of                        Report                Equity Report                                           Statement
                                                                                                                    TCFD Report
                                  Performance

Position statements and policy and program “backgrounders”

  RBC Climate Blueprint      RBC Human Rights Position           About Corporate Citizenship suite of policy and    Policy Guidelines for Sensitive Sectors
                                    Statement                              program “backgrounders”                       and Activities (Coal and Arctic)

                           For more details, see our suite of ESG disclosures on our Corporate Citizenship Reporting website.

39 | ESG                                                                                                                                                            RBC
Economic Backdrop
Canada’s strong fiscal position
 Strong rating as a result of fiscal prudence, conservative bank lending practices and a solid economy
 Lowest net debt-to-GDP ratio among G7 peers (1)

Net Debt as % of GDP(1)                                                                                         Canadian GDP by Industry(2)
(2021)                                                                                                          (May 2021)

                                                                                                                                                                         Finance, Insurance & Real
                                                                                                                                                                         Estate
                                                                                                                                12%
                                                                                                                                                                         Manufacturing
                                                                                                                                                            21%
                                                                                      172.3
                                                                                                                      4%                                                 Wholesale and Retail Trade
                                                                            144.2
                                                                                                                8%                                                       Scientific, Technical &
                                                                                                                                                                         Educational Services
                                             106.1      108.8     109.0                                                                                                  Public Administration and
                                     97.2
                                                                                                                                                                   10%   Utilities
                                                                                                               8%                                                        Mining, Oil & Gas Extractions

                          52.5
                                                                                                                                                                         Construction
               37.0                                                                                                 5%
                                                                                                                                                             11%
                                                                                                                                                                         Health Care
                                                                                                                            10%
                                                                                        Japan
                                      U.K.
                 Canada

                           Germany

                                               France

                                                                    U.S.

                                                                              Italy
                                                        Average

                                                                                                                                                12%                      Transportation, Warehousing
                                                          G7

                                                                                                                                                                         Other

(1) Net debt refers to General Government net debt. International Monetary Fund April 2021 Fiscal Monitor. (2) Statistics Canada, RBC Economics Research.

41 | ECONOMIC BACKDROP                                                                                                                                                                               RBC
Economy’s recovery strengthening as containment measures ease
 The Canadian economy slowed during a spring resurgence of COVID-19 spread but still grew in Q2 with virus spread and containment
  measures easing in June. Unemployment remains elevated, but government support programs continue to provide larger-than-normal
  income replacements for those losing work
 New virus variants continue to pose a threat to the Canadian economy's recovery, but vaccination rates have increased sharply
  making future broadly-based lockdowns less likely. We continue to expect GDP growth will re-accelerate over the second half of 2021
  and labour markets will continue to improve
 Year-over-year Consumer Price Index (CPI) growth is expected to remain high in the near-term because of very low year-ago prices,
  particularly for gasoline. Excluding energy prices, inflation pressures are expected to build through the year as higher raw-material
  prices filter through to end-product consumer prices and consumer demand for services recovers
 The recovery in the U.S. economy is expected to be boosted by large amounts of fiscal stimulus. U.S. GDP is expected to increase
  6.5% in 2021 following a 3.4% drop in 2020

  Canadian Inflation (YoY)(1)                                                                                      Canadian Labour Markets (YoY)(2)

 (1) Statistics Canada, RBC Economics Research. (2) Statistics Canada, Bureau of Labor Statistics, RBC Economics Research.

42 | ECONOMIC BACKDROP                                                                                                                                RBC
2021 Economic Outlook
Projected Economic Indicators for 2021(1)

                                                                                                   Unemployment                   Interest Rate              Current Account      Budget
                                               GDP Growth                    Inflation
                                                                                                       Rate                      (3 mth T-bills)              Balance/GDP(2)   Surplus/GDP (3)

Canada                                                6.3                       3.0%                       7.5%                        0.20%                          0.8%         (7.8%)

U.S.                                                  6.5                       3.7%                       5.5%                        0.05%                          (3.4%)       (15%)

Euro Area                                             4.5                       1.6%                       8.4%                          NA                           2.8%          (6.7)

                                  The Canadian economy is forecast to rebound 6.3% in 2021 following a 5.3% drop in 2020. GDP declined in April and May
                                   during the spring wave of virus spread and containment measures but early estimates are pointing to a rebound in June as
                                   restrictions eased
                                  Remaining economic weakness is disproportionately concentrated in the travel and hospitality sectors, but household
  Canada                           spending has strengthened in the summer. Household disposable incomes have been propped up by government support
                                   for those unemployed and interest rates remain low. A relatively successful Canadian vaccine rollout to-date is expected to
                                   limit the extent of future restrictions on economic activity from virus spread
                                   The U.S. economy is expected to grow 6.5% in 2021 after a 3.4% decline in 2020. The level of GDP recovered to back
                                    above pre-pandemic levels in Q2 2021 and is expected to continue to grow over the second half of this year as the
                                    service-sector continues to recover from virus spread and containment measures
  U.S.                             The unemployment rate is expected to average 5.5% in 2021, still well-above pre-shock levels but much lower than the
                                    8.1% average in 2020
                                   The economy’s recovery will be boosted as containment measures ease and by very large fiscal stimulus supports that
                                    have increased household incomes and savings through the pandemic
                                  Vaccine distribution has continued to ramp up in Euro area economies and eased containment measures are supporting
                                   stronger near-term GDP growth
  Euro Area
                                  Growth in both the Euro area and the U.K. economies is expected to remain strong over the second half of this year with
                                   vaccine distribution to-date limiting the likelihood that widespread virus containment measures will be reimposed

(1) RBC Economics Research as of July 8, 2021 and reflect forecasts for calendar 2021. (2) RBC Economics Research, IMF WEO (April, 2021). (3) IMF WEO (April 2021).

43 | ECONOMIC BACKDROP                                                                                                                                                                           RBC
You can also read