Opportunities for the sheep sector - Market Intelligence April 2021 - NET
←
→
Page content transcription
If your browser does not render page correctly, please read the page content below
Market Intelligence April 2021

                 Opportunities for the
                        sheep sector

                                 1
CONTENTS
 3   Background

 6   Sheep trade

10   Domestic consumer demand

17   International consumer demand

22   Competition analysis

24   Conclusions and implications

Annex 1 – UK trade agreements

Annex 2 – UK market access for sheep meat

Annex 3 – Importance of specification to end product

                                    2
BACKGROUND
Within this Horizon report, we assess the key opportunities for the sheep
sector over the next 10 years. Every six months, the AHDB Market Intelligence
team produces a sector outlook, incorporating production forecasts, trade
prospects and the consumption outlook. In producing recent outlooks, our
attention has turned to the longer-term prospect for sheep meat. Some key
changes will occur in the sheep sector. With the issue of the UK exit from the
EU now resolved, this is an opportune moment to explore the evidence and
understand what needs to be done to grasp the opportunities ahead.
At the time of writing (March 2021), lamb and sheep meat prices are at relative highs.
Some unusual supply and demand dynamics, such as higher exports pre-EU exit and
coronavirus lockdowns driving domestic retail demand, have driven prices upwards.
It is clear that the supply and demand drivers that ultimately determine prices will shift
again in future. Nonetheless, the current market highs provide a strong vantage point
to look at what lies ahead.

There are around 33.5 million sheep in the UK, spread over 78,000 farm holdings.
The average number of sheep and lambs on each holding is 430, although this number
hides a wide range of farm sizes. About 10,400 holdings have fewer than 20 head of
sheep, and 9,400 have more than 1,000 head.

Sheep are predominantly, but not exclusively, found in the north and west of the UK.
These are typically hillier areas with high levels of rainfall. This provides excellent
conditions for growing grass and is less well suited to other types of farming. More
than half of grazing livestock farms in the UK are in designated less-favoured areas
(LFAs) for agriculture.

It is farming at different altitudes that produced the ‘stratified system’, whereby draft
ewes from the uplands are bred with rams from lower altitudes. They produce male
lambs for slaughter, but also crossbred females, which are then bred with lowland
terminal sires to produce lambs for slaughter. The sheep sector has come to rely less
on this flow of genetics down the mountain in recent years, with more lowland flocks
breeding their own ewe replacements.

Looking forward, fundamental changes will occur in three key areas which will impact
the sheep sector. Firstly, in the area of trade, we know that the UK’s trading relationship
with the EU and other countries around the world is likely to change. Secondly, we also
know that English1 agricultural policy is shifting, with direct payments to farmers being
phased out. Finally, with evidence from consumers, we can see that their attitudes and
shopping behaviour continues to change, both at home and overseas. The report aims
to explore each of these issues and what they mean for our farming levy payers, others
in the supply chain, government and AHDB itself.

1. For the sheep sector, AHDB’s geographic remit is focused on England, although it undertakes certain functions, such
as export market development, which benefit the UK as a whole. There are separate levy boards for the sheep sector for
Scotland (QMS), Wales (HCC) and Northern Ireland (LMC).

                                                           3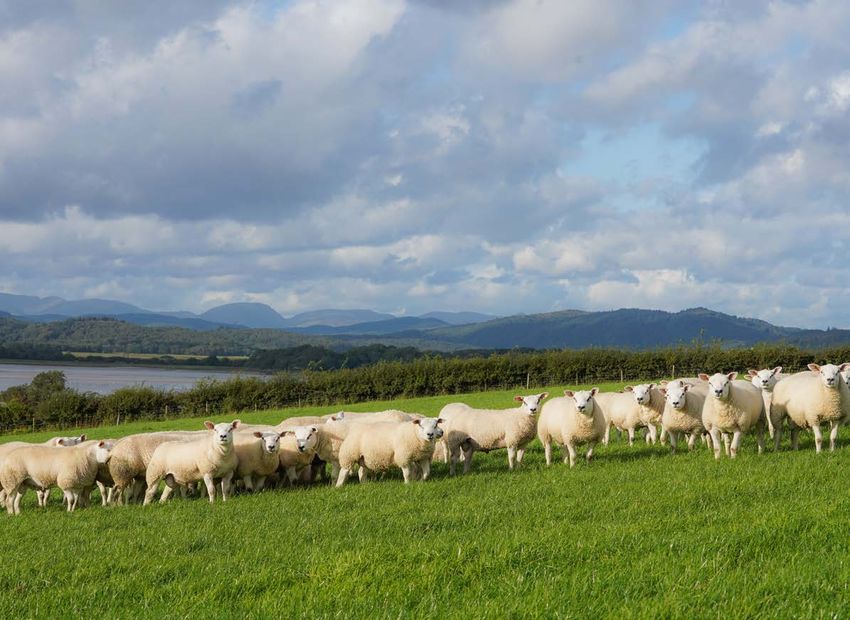
Trade
In recent years, any market analysis of UK sheep would have been dominated by EU exit
issues. The sector was particularly exposed to the risks associated with a no-deal Brexit.
Previous Horizon reports, including Understanding Brexit: an impact assessment and
Brexit prospects for UK beef and sheep meat trade, have explored this in detail.

With more certainty on trade with the EU, we are able to move the debate on. The report
explains how the sheep market operates and explores key issues, such as:

•   What will the new trading relationship with the EU mean for the sector?

•   How important is seasonality of supply and trade to the market?

•   What implications will there be from changing sheep meat imports to the UK from
    countries like New Zealand and Australia?

Agriculture policy
In November 2020, Defra outlined its agriculture transition plan. Central to this transition
is an intention to reduce and then stop direct payments, between 2021 and 2028.
Instead, government funds will focus on paying farmers to deliver public goods around
the environment, improved animal health and welfare, and to reduce carbon emissions.
A new Environmental Land Management (ELM) approach, which will incorporate a
Sustainable Farming Incentive, will be key.

It is important to acknowledge that basic payments have been important in underpinning
the profitability of farming business in England. As outlined in Figure 1, the average basic
payment received in 2019–20 was £27,800, which accounted for 60% of the £46,000
average farm business income (a measure of profit). However, the reliance on basic
payments is much more significant for the livestock sector, where, on average, farms
made losses from their agricultural activities.

For lowland-grazing livestock farms, basic payments average £15,800 and equate to
168% of farm business income. For less-favoured-area (LFA) grazing livestock, basic
payments averaged £25,500 and equate to 112% of farm business income. Payments
relating to agri-environmental schemes also contribute income to these businesses and
these will change through the agricultural transition period as the new Environmental
Land Management (ELM) scheme is rolled out.
Figure 1. Farm Business Income, England, 2019-20

                £46,000
                                                                                            £22,800

                £27,800
                                                       £9,400
                                                                                            £25,500

                                                      £15,800
                £13,000                                                                      £2,600
                                                       £5,900                               £11,300
                   £5,300                              £3,900
                   -£100
                                                      -£16,300                              -£16,600

               All farms                     Grazing livestock (lowland)             Grazing livestock (LFA)

     Agriculture            Agri-environmental payments         Diversified income       Basic payment scheme

Source: Farm Business Survey, Defra

                                                          4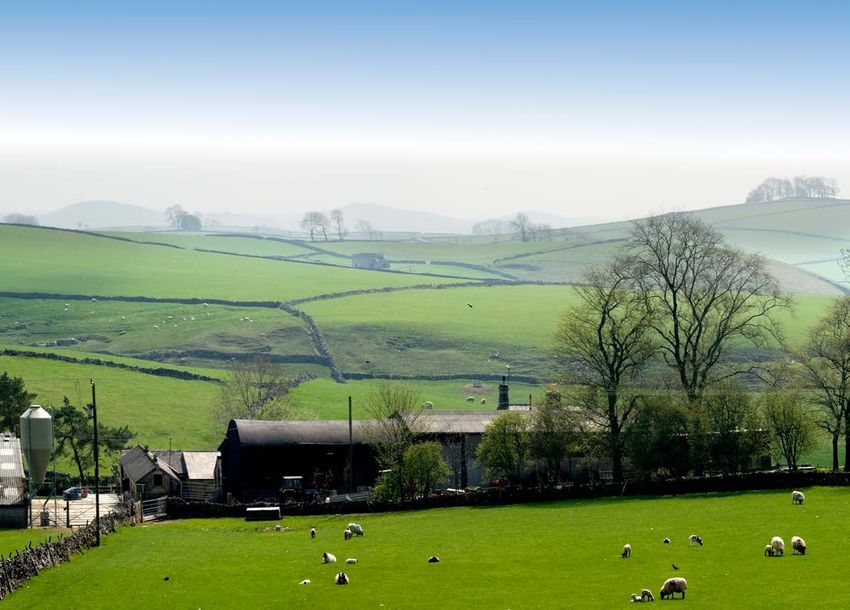
The removal of basic payments will present a significant challenge to livestock farms.
Many aspects of the new policy are being designed to be open to all farms and should
provide a future income stream. However, it is unlikely that most farmers will be able
to offset their lost income from basic payments in its entirety through ELM. Later in
the report, we discuss issues relating to costs of production on farm and profitability.
As direct payments decline, this will squeeze profitability and bring change for
many businesses.

Consumer demand
Consumer demand for sheep meat shows differing trends domestically and globally.
Within the UK, consumption of lamb has declined over the past 40 years in per capita
terms and is now focused on older, more affluent consumers. The report assesses
the key issues around domestic consumption, such as consumer perceptions, meal
occasions and the importance of the halal market. Opportunities to grow lamb
consumption domestically are discussed.

The story is different when we turn to global markets. Here, steady growth is expected
over the next 10 years. The picture globally is mixed, with many developed markets,
such as the EU, showing similar trends to the UK. However, driven by the dramatic
expansion of middle-class consumers, the Asia-Pacific region, and China in particular,
is expected to see significant growth. Ensuring the UK has access to the right markets
is important. Tariff and non-tariffs barriers to trade are discussed and whether the UK
has the technical agreements in place to enable market access to export sheep meat.

                                            5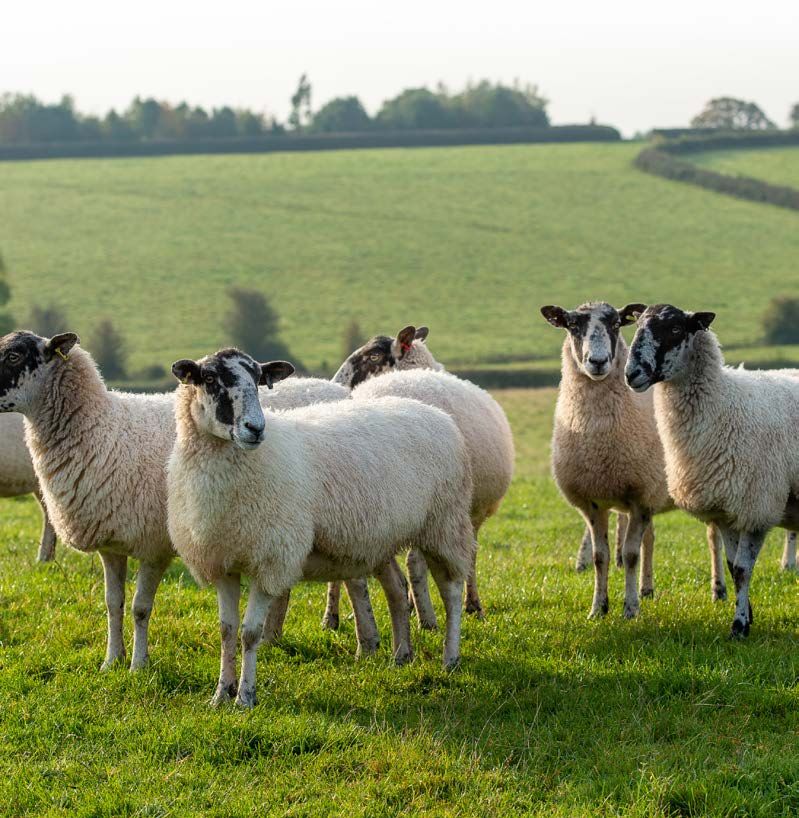
SHEEP TRADE
The UK is both a significant importer and exporter of sheep meat. Since 2018,
exports have exceeded imports in volume terms, as shown in Figure 2. This is
mainly as a result of declining New Zealand imports and declining domestic
consumption. If the trends shown here continue, this position as a net exporter
will become the norm.
Figure 2. UK sheep meat balance

                         450                                                                                      120

                         400
                                                                                                                  100
                         350

                                                                                                                        Self-sufficiency (%)
 Thousand tonnes (cwe)

                         300                                                                                      80

                         250
                                                                                                                  60
                         200

                         150                                                                                      40

                         100
                                                                                                                  20
                          50

                          0                                                                                       0
                           98
                               99
                                    00
                                       01
                                            02
                                                 03
                                                  04
                                                        05
                                                            06
                                                               07
                                                                   08
                                                                        09
                                                                         10
                                                                             11
                                                                                   12
                                                                                    13
                                                                                        14
                                                                                             15
                                                                                                 16
                                                                                                       17
                                                                                                            18

                                                                                                        20 9
                                                                                                              e
                                                                                                          20
                                                                                                            1
                          19
                               19
                                 20
                                     20
                                            20
                                             20
                                                 20
                                                       20
                                                          20
                                                             20
                                                                   20
                                                                    20
                                                                        20
                                                                             20
                                                                              20
                                                                                   20
                                                                                        20
                                                                                         20
                                                                                               20
                                                                                                   20
                                                                                                       20
                                                                                                         20
                         Self-sufficiency             Production         Imports             Exports        Consumption*

Source: Defra, IHS Maritime and Trade – Global Trade Atlas®, AHDB
*Supplies available for consumption (calculated)

UK sheep meat is exported to a range of countries, where there are technical
agreements in place to enable trade (see Annex 2). The EU is currently the most
important destination for UK sheep meat, accounting for around 90% of exports in 2020.
The new trade deal agreed with the EU means that the UK is now a third country, outside
the EU customs union. In effect, this means that UK sheep meat is now ‘exported’ to
the EU rather than simply ‘delivered’. This change has brought significant logistical
difficulties and an increased administrative burden and cost. Some of the costs currently
being experienced will be reduced in time, but the requirements for customs checks and
paperwork are likely to persist. These add costs to doing business, impacting on the
price competitiveness of UK product in EU markets.

Based on previous research funded by AHDB, QMS and HCC, the non-tariff costs for
roll-on, roll-off driver-accompanied routes are estimated to rise from 0.4% (when the UK
was part of the EU) to between 1–8.2% for chilled lamb carcases. The higher figure is
relating to physical checks being applied to the specific load, compared with
a probability-based checking.

                                                                         6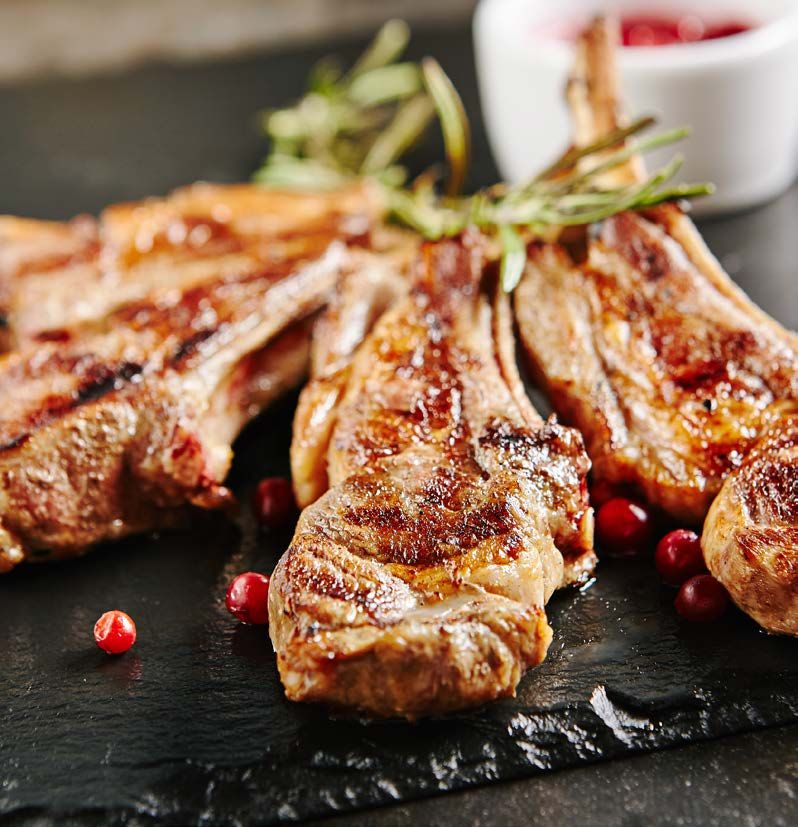
Global trade
The UK is the world’s third-biggest exporter and fourth-biggest importer of sheep meat.
Global sheep meat exports are dominated by Australia and New Zealand, while China,
the USA and France import the most.
Figure 3. Major sheep meat exporters and importers (in tonnes)

          500,000
                                       Exporters                                Importers
          450,000
          400,000
          350,000
          300,000
 Tonnes

          250,000
          200,000
          150,000
          100,000
           50,000
               0
                    Australia    New     United Ireland   Spain   China   USA    France      United United
                                Zealand Kingdom                                             Kingdom Arab
                                                                                                    Emirates
Source: FAO 2019

Australia, New Zealand and Ireland can be considered specialist exporters, with
relatively small domestic markets compared with the amount of sheep meat they
produce. This means their regulatory, farming and processing systems are heavily
focused on producing exactly what their customers overseas need. The biggest market
for UK sheep farmers and processors is their own domestic market, although some
supply chains are dedicated to export markets, principally in the EU.

Global trade actually creates two opportunities for UK producers. Growing export
demand means exports are likely to play a more important role, if we can adapt to
changing customer demands both in terms of pricing and product specifications.
At the same time, we’ve seen New Zealand imports declining in recent years as they
target other markets. This means there is a bigger share of the UK home market on offer.
Nonetheless, the long demand dynamics in the UK versus broader international markets
are very different.

Seasonality in the UK and why else to trade

                                                          7
Lamb production in the UK is seasonal. Production is highest in the autumn, when
new-season lambs come to market in volume. In the first part of the calendar year,
supplies are tighter, but more lamb from the southern hemisphere is available to help
meet demand. As such, the UK is typically a net importer in the first part of the year and
a net exporter in the second. But this is only half the story and trade in both directions
takes place every month. This is not just a reaction to the production profile but also to
achieve carcase balance.
Figure 4. Seasonality in UK sheep meat trade

                          15,000
 Tonnes, shipped weight

                          10,000

                           5,000

                              0

                          -5,000

                      -10,000
                            Fe 19
                            M 19
                            Ap 19
                            M 19

                            Ju 19

                             Ju 9
                            Au 9
                            Se 19
                            O 19
                            N 19
                            De 19
                            Ja 19
                            Fe 20
                            M 20
                            Ap 20
                            M 20
                            Ju 20
                             Ju 0
                            Au 0
                            Se 20
                            O 20
                            N 20
                                 20
                                 1
                                l1

                                 2
                                l2
                               n
                               b
                              ar

                               r
                              ay

                               n

                               g
                               p
                              ct
                             ov

                               c
                               n
                               b
                              ar

                               r
                              ay

                               n

                               g
                               p
                              ct
                             ov
                            Ja

                                   Imports – legs                              Exports – legs
                                   Imports – other cuts (excluding legs)       Exports – other cuts (excluding legs)
                                   Imports – carcases                          Exports – carcases

Source: IHS Maritime and Trade Net trade
                               – Global   position
                                        Trade Atlas®(imports minus exports)
                                                    , HMRC, AHDB

In its simplest terms, the UK tends to export sheep meat in the form of whole carcases,
mainly to France and Germany, while it imports legs and loins, mainly from New Zealand.
This is because the cuts that UK consumers prefer the most tend to come from the legs
and loins. However, in recent years, New Zealand has been pivoting its export volumes
towards the Asian market. If this continues, this creates opportunity for UK farmers through
reduced competition in our domestic market, but this opportunity would be clearly focused
on legs and loins. As such, it amplifies the carcase balance issue and would mean the UK
would have to also increase the exports of other cuts, switching away from the shipment
of whole carcases. With this in mind, the experiences of New Zealand in shifting from an
export trade focused on whole carcases is worth further consideration.

                                                                           8
Case study: New Zealand
When the UK joined the European Economic Community in 1973, New Zealand’s
sheep sector was largely focused on exporting to the UK. The limits to tariff-free
trade to the UK market, which were put in place, were a catalyst for profound change
in New Zealand’s sheep sector. In 1970, more than 90% of exports were shipped
from New Zealand as carcases, but by 2020 this was less than 10%. By investing
in cutting capacity, exporters could add more value to each cut within the carcase.
By targeting different markets around the globe and identifying those that value
specific cuts the highest, New Zealand’s exporters were able to more than offset
the additional costs of producing those cuts domestically.
Figure 5. New Zealand sheep meat exports
    100

     90

     80

     70

     60

     50
%

     40

     30

     20

     10

      0
          1

                6

                     1

                          6

                                1

                                     6

                                           1

                                                 6

                                                          1

                                                               3

                                                                     4

                                                                            5

                                                                                  6

                                                                                       7

                                                                                            8

                                                                                                   9

                                                                                                         0
          –7

               –7

                    –8

                         –8

                               –9

                                    –9

                                         –0

                                               –0

                                                      –1

                                                              –1

                                                                   –1

                                                                            –1

                                                                                 –1

                                                                                      –1

                                                                                           –1

                                                                                                   –1

                                                                                                        –2
     70

           75

                80

                      85

                               90

                                    95

                                         00

                                              05

                                                     10

                                                          12

                                                                  13

                                                                       14

                                                                             15

                                                                                    16

                                                                                         17

                                                                                              18

                                                                                                    19
    19

           19

                19

                     19

                          19

                                19

                                      20

                                            20

                                                 20

                                                          20

                                                                20

                                                                      20

                                                                             20

                                                                                  20

                                                                                       20

                                                                                             20

                                                                                                    20
                     Chilled        Frozen boneless           Frozen cuts        Frozen carcases

Source: Beef and Lamb New Zealand Economic Service

Technological advances allowed some product to be shipped chilled, rather than
frozen, further adding value. This is possible with long-shelf-life products (84 days
compared with 40 in the UK) as a result of exceptional process hygiene and a very
effective product chilling. This has been enhanced further with the development
of refrigerated supply chains into China in particular. It was New Zealand’s trade
agreement with China in 2009 that marked the end of its sheep meat quota to the
EU being filled each year.

UK consumption of lamb has been falling and so have imports, while production
and exports have been steady. So against this background, could the UK learn from
the New Zealand approach? A big difference is the size of the domestic market, with
around two-thirds of UK lamb consumed domestically, compared with just 1% of
New Zealand production consumed in New Zealand. There may be an opportunity
in future to focus on sending cuts to markets that offer the highest return, including
legs and loins to the UK itself, rather than shipping out whole carcases.

                                                      9
DOMESTIC CONSUMER DEMAND
Within the UK, consumption of lamb has declined over the past 40 years.
Data from Defra’s Family Food Survey below shows UK meat consumption
since the 1980s. The steady decline for lamb is in contrast to the longer-term
rise of chicken. We discuss some of the reasons for this later, which include
price and pressure from evolving consumer needs and tastes. In particular,
the last decade has seen the desire for quick, convenient and healthy meal
options intensify. The bottom line is that UK per capita consumption of lamb
at home has fallen by 80% since 1980.
Figure 6. Quantity of food purchased for UK households (average g per person per week)

  250

  200

  150

  100

   50

    0
     80

          82

               84

                     86

                          88

                                   90

                                        92

                                             94

                                                  96

                                                       98

                                                            00

                                                                 02

                                                                      04

                                                                           06

                                                                                08

                                                                                     10

                                                                                          12

                                                                                               14

                                                                                                    16

                                                                                                         18

                                                                                                              20
   19

        19

              19

                   19

                        19

                              19

                                    19

                                         19

                                               19

                                                    19

                                                         20

                                                              20

                                                                   20

                                                                        20

                                                                             20

                                                                                  20

                                                                                       20

                                                                                            20

                                                                                                 20

                                                                                                      20

                                                                                                           20
                         Beef                Lamb           Pork           Fish           Chicken

Source: Defra Family Food Survey

Consumption patterns during 2020 took a dramatic shift, due to coronavirus.
Overall, lamb retail volumes were up 4% in the year (Kantar Worldpanel). This was
behind the market average for total food and non-alcoholic drink volumes, which
were up 11%. However, that was a significant contrast to the pre-coronavirus trend.
As restrictions ease and lifestyles adjust to a ‘new normal’, it is expected that lamb will
face continued strong competition from other fresh proteins and plant-based alternatives.

Lamb consumer profile and eating habits
Understanding the shopper profile and how lamb is consumed provides crucial context.
Lamb has a heavy proportion of older consumers, with 60% of retail sales from those
aged 55+ (compared with 51% for all meat/fish/poultry). In terms of household type, the
majority are either retired, older dependants or empty nesters (have children who are no
longer living with them). The current consumer profile points to continued contraction of
the domestic market. As such, widening appeal to young consumers is important in the
longer term.

                                                         10
Figure 7. Lamb retail sales by consumer demographics
400,000
Spend (£000) – Actual 300,000
200,000
100,000
0
8
4
4
4
4
+
ily
s
rs
s
ts
s
ed
ar
ar
er
r2
–3
–4
–5
–6
65
an
ea
m
tir
Ye
Ye
st
28
35
45
55
de
-fa
Y
nd
d
Re
ne
ge
4
9
+
un
d
d
d
d
e
pe
0–
5–
10
Pr
y
ge
ge
ge
ge
ra
pt
de
d
ra
ra
ra
ra
ily
ily
ily
ge
pe
Em
er
m
m
m
pe
pe
pe
pe
ra
op
ld
fa
fa
Fa
op
op
op
op
pe
Sh
O
g
e
Sh
Sh
Sh
Sh
dl
un
op
id
Yo
Sh
M
26 Jan 20 24 Jan 21
Source: Kantar Worldpanel – Spend (£000) | Actual | Total lamb | 52 w/e
Just under a third (28%) of lamb meal occasions occur on a Sunday – this rises to
around half if you look just at lamb roasting joints (Kantar Usage 52 w/e 29 Nov 2020).
This highlights the importance of Sunday roasts to overall category performance.
The longer-term decline of the traditional Sunday roast is making it increasingly
important to evolve lamb’s offering into other dishes. Lamb consumption peaks at
Easter and Christmas, highlighting a wider opportunity to make lamb more appealing
beyond these two key seasonal periods.
Lamb is often seen as a treat and fits well within special occasions in the mindset
of consumers. Pre-coronavirus, lamb was more likely to be chosen over other meat,
fish and poultry where there were five or more people present – the reason being the
meal was a social occasion. Obviously, this was heavily impacted during 2020 due to
household restrictions, but in the longer term there is an opportunity as restrictions
ease and consumers look to recreate these occasions.
Halal market
The domestic halal market is key for the sheep sector. Although Muslims account for
just under 5% of the UK population, they provide notable opportunities for lamb because
lamb and mutton consumption is significantly higher among halal consumers than the
wider population. More than 60% of halal consumers eat lamb at least once a week,
compared with just 6% of the general UK population.
Previous AHDB research has highlighted that more than 20% of sheep meat produced
in England is consumed by Muslims. Opportunities exist in social events, such as
weddings and naming ceremonies and key Islamic festivals (Ramadan, Eid al-Fitr and
Eid al-Adha) which happen throughout the year. AHDB highlighted scope for maximising
the opportunity with marketing, extended in-store ranging and more premium products
in a recent report, Demand for halal meat, June 2020.
Processors looking to tap into the growing UK domestic halal market need to understand
halal consumers’ preference for meat, according to the method of production, point of
sale and other quality parameters. For instance, a number of studies have reported that
the majority of halal consumers prefer to shop in Muslim-operated retail premises due
to trust issues surrounding the authenticity of halal meat. Many mainstream retailers
have adapted to this by making provision for Muslim-operated butcher counters in
their stores. The method of slaughter also influences consumer choice for halal meat.
11Case study: Key Islamic festivals
Eid al-Fitr is the festival of breaking the fast. It is celebrated a day after the end of the
29/30 days of Ramadan. Families usually gather for the Eid al-Fitr celebration and
sheep meat is typically used in kebabs and curries. The estimated date for the Eid
al-Fitr festival in 2021 is Thursday 13 May, depending on the sighting of the moon.
Ramadan and Eid al-Fitr
Ramadan is the ninth month of the Islamic lunar calendar, during which Muslims
abstain from the consumption of food from dawn to sunset. Because the Islamic
calendar is a lunar one, the dates for the festivals are not fixed; they move forward
10 or 11 days every year. In 2021, Ramadan is expected to start on Monday 12 April
and end on Wednesday 12 May, but this depends on the sighting of the moon.
Ramadan is observed over 29 or 30 days, depending on the sighting of the moon;
this is immediately followed by the Eid al-Fitr festival. Many Muslims break the fast
with extended family or with communal meals in which lamb is heavily featured.
Peak halal meat consumption occurs at this time. Eid al-Fitr is the festival of breaking
the fast. It is celebrated a day after the end of Ramadan. Families usually gather for
the Eid al-Fitr celebration and sheep meat is typically used in kebabs and curries.
Qurbani/Eid al-Adha Festival
Eid al-Adha is the most important Islamic festival. It is known as the festival of feast.
Ten of thousands of animals are procured for the Qurbani/Eid festival annually.
For farmers and processors looking to access this market, it is important to note
that demand for sheep meat during this festival is split into two categories: meat
for the Qurbani charitable giving and meat for the normal Eid festival. Animals for
the Qurbani market must meet certain requirements with regard to sexual maturity
and other features. There are no specific requirements for meat destined for the
Eid-al-Adha market.
The estimated date of Qurbani in 2021 is 20 July. The processing of Qurbani animals
must be completed over three days, starting after Eid al-Adha prayers on the tenth
of Dhul Hijjah (twelfth month of the Islamic lunar calendar). AHDB has produced
educational materials on the Qurbani market which can be used by farmers and
abattoir operators wishing to access this important market.
12Price challenge
The most notable consumer consideration for lamb is its price and consumers’ reaction
to that, with AHDB research indicating that 64% of consumer agree that lamb is too
expensive to eat on a regular basis (AHDB/YouGov Consumer Tracker, Feb 2020).
With price already acting as a barrier, the economic fallout from coronavirus could see
increased challenges for lamb, pushing it further into the treat/special occasion bracket.
Signals are that consumers are increasingly seeking value for money, with 43% of
consumers stating they have become more price-conscious in the last month
(AHDB/YouGov Consumer Tracker, Nov 2020).
Figure 8. Average price paid by GB shoppers, 52 w/e 27 Dec 20
12.00
9.78 10.02
10.00 9.49
8.81
8.00 7.62
6.83
5.88
K/Kg
6.00
4.84 4.67
3.92
4.00
2.00
0.00
Beef Pig meat Lamb Chicken Fish
Total Primary only
Source: Kantar, 52 w/e 27 Dec 20
Lamb’s price point is a challenge when compared with chicken, beef and pig meat,
placing it at the higher end of the scale across meat options. In addition, lamb’s price
point has also grown the most over the past five years, with the retail average price
per kilogram 19% higher than five years ago (Kantar 52 w/e 27 Dec 20). This rate of
growth is much higher than beef (+5%), pig meat (+10%) and Chicken (-1%). The price
differential is evident when it comes to meat centrepieces, as well as versatile, cheaper
products such as mince. This makes it vital that lamb justifies the price point by clearly
communicating taste and quality attributes to consumers.
Consumer perceptions
Evidence around consumers’ perceptions of lamb
highlights a number of strengths and weaknesses.
Notable attractions of lamb for consumers are it is
‘tasty’ (58%) and a ‘good source of protein’ (50%).
However, only 27% of consumers perceive lamb
as being ‘good for you’, with many thinking that
lamb can be ‘fatty’ (57%) (AHDB/YouGov Consumer
Tracker, Nov 2020). Given the growing importance
of health to many consumers, on which AHDB has
published insight previously, this presents
a challenge to the lamb market.
Another key area the industry must address is that
just 34% of consumers agree that lamb is ‘versatile’
(AHDB/YouGov Consumer Tracker, Nov 2020).
13This is significantly lower than agreement towards other meat choices, such as chicken
(78%), beef (64%) and pork (47%). With the increased popularity of ‘dish-based’ cuisines,
such as Italian, Indian, Chinese and Mexican, finding ways to align lamb to more world
cuisines may increase relevance for a wider group of consumers. For instance, traditional
cuts, such as leg, shoulder and chops, can be used in a variety of Mediterranean, Middle
Eastern and North African-inspired dishes, such as tagine and kleftiko.
Lamb fat
Lamb carcases are graded based on the EUROP grid. This system classifies
carcases based on fat class and conformation. Different markets have different
requirement, so AHDB encourages farmers to identify potential markets or
customers first and then produce animals which suit their needs. Most deadweight
markets pay up to 21 kg and tend to pay the greatest premium for carcases graded
as R3L or better.
In 2020, AHDB data shows that only 57%
of GB sheep met the R3L or better ‘target
specification’ – this figure has remained
steady over the past five years. Pictured
is a supermarket pack showing lamb
chops from an overly fat lamb. In addition
to the downside in terms of appeal to
the consumer, excess fat is a cost for
the farmer (in terms of increased feed).
It also increases food waste and adds
cost to the processor. Further images
showing the difference between different
lamb carcase specifications are shown in
Annex 3.
Environment perceptions
The environment is another area of growing consumer interest. Here, most consumers
(64%) believe farmers care about the planet (AHDB/Blue Marble Trust Research, 2020).
Indeed, many aspects of UK sheep meat production, such as grass-based and extensive,
may lend themselves to a good news story on the environment.
In recent years, concerns about the environment, together with health, have become the
key reasons why those consumers who limit the amount of meat in their diets choose to
do so. Rightly or wrongly, the majority (54%) of consumers believe a vegan diet is more
environmentally friendly (AHDB/YouGov Consumer Tracker, Nov 2020). This is one factor
behind the recent growth in sales of products marketed as meat-free. There has been a
significant volume of new product development (NPD) and new brands within
this category.
However, during lockdown, the number of households buying meat-free products
dropped by almost two percentage points – while the number of households buying
red meat grew in comparison. This is clearly welcome news for the livestock sectors,
although the reductions may be temporary. In what is still a relatively small market, the
meat-free sector is expected to grow in the longer term. For sheep meat, the message
is clear: it is important that the supply chain introduces new products which appeal
to consumers and addresses concerns around the environment. Demonstrating and
communicating environment credentials to consumers is a must for our industry.
14Looking ahead, it is essential that lamb is communicated as a tasty and nutritious product
– these were key pillars of AHDB’s domestic marketing campaigns, such as ‘Lamb hits
you in the chops’ in 2019 and ‘Make it Lamb’ in 2020, alongside statements about the
health benefits of eating red meat in AHDB’s recent ‘Eat balanced’ 2021 campaign.
Case study: ASDA
Hayley Whittaker
Buying Manager – pork, lamb and offal
“As a supermarket buyer, the key thing which influences my buying decisions
for lamb always starts with our customer needs. We look at our product offer and
assess what gaps we have and what products are performing for our competitors.
For instance, last year we saw that marinaded products were growing in the market.
We then work closely with the processor to work out the value offer for customers.
“We have a dual supply arrangement, with lamb coming from the UK and New
Zealand. It won’t be a surprise that a large proportion of our volume is from New
Zealand, because we focus on legs. We over-index on joints, particularly among the
older demographic of our customers. They are used to that cut, and there are big
sales demand around Easter and Christmas. It wouldn’t be possible to meet
demand without flexing our supply.
“Carcase balance is an issue, and we are conscious and sensitive to this. There is a
need to switch the dial to work out what the barriers are and how we get round them.
We do continue to stock some cuts, like rolled breast, to help with overall carcase
balance, but customers like what they like and go for certain cuts. We want to get
on the journey to change this, but it will take time and we need to get customers on
board. There would be a need to re-educate and re-introduce them to other cuts.
“The quality of UK lamb works for us, but the price volatility can be a challenge at
times. We need to do our promotional planning two months in advance, so if prices
are moving about that can be a challenge. There is greater stability with the New
Zealand prices. If we could get greater price stability in the domestic supply, it would
give me more confidence to launch product and plan promotions.
“Lamb is one of the more expensive proteins in store, so we try to promote to
get people buying the range. Otherwise there would not be many new customers
switching to lamb. It has a loyal, traditionally older demographic. We want to drive
volume, so need to overcome barriers for all customers.”
15Case study: Dalehead Foods
Lorraine Fountain
Commercial Manager for lamb
Lisa Magennis
Category Manager for lamb and pork, counters, ready to cook
“In September 2019, we made a decision in conjunction with Waitrose to schedule
the transition to 100% British lamb, having already completed the organic transition.
This was to be a two-year process. It was partly a corporate social responsibility
decision, in terms of supporting British farmers and doing the right thing, but also
based on a future understanding of what the world market is going to look like
and what relevance New Zealand may have to the UK market in future years. As a
premium retailer Waitrose need to maintain a forward-looking offer and risk assess
their supply chain, whilst maintaining the highest product quality their customers
expect. We wanted to evolve and strengthen our supply chain ahead of the curve
and that required some strategic change.
“With some lack of understanding from customers around the “best in season” policy, it
was challenging to deliver a consistent and coherent all year round message on quality.
“This transition does not come without some significant challenges. We’ve had to
do a bit of thinking outside the box in terms of how we’re going to deliver the Easter
peak. So much of Easter is really driven by what customers have been led to believe
is the lamb they should choose. The typical behaviour is led by the more traditional
shopper and buy in to a deep leg-based promotion. We need to change that mindset
to a more sustainable British-based offer, so the lamb offer is balanced and appeals
to a breadth of missions and age groups.
“Waitrose has always marketed the whole lamb. It’s a fundamental of sustainability.
Building towards this transition, we’ve focused through promotions or editorial
pieces on delivering a sustainable and whole carcass message.
“The current lamb price presents a number of challenges. Despite the inflation in
New Zealand pricing in recent years, there’s considerable divergence between the
British lamb price that we are currently experiencing and New Zealand lamb price.
Clearly, we have unprecedented experiences in terms of the world market at the
moment which has created temporary disruption. However, we know that the Asian
population is going to continue to grow and middle class developing world areas
who have not had meat in their diet historically will want meat in their diet.”
16INTERNATIONAL CONSUMER DEMAND
The willingness and ability to pay for sheep meat varies across the globe.
As economic income rises, so does demand for meat and dairy products,
compared with more staple items in people’s diets. During 2020, the global
coronavirus pandemic adversely affected economic growth in all regions.
However, despite significant uncertainty, the global economy is projected,
by the latest International Monetary Fund (IMF) outlook, to grow 5.5% in 2021
and 4.2% in 2022.
Another factor that will drive consumption is population growth. Over the past 30 years,
the worldwide population growth rate fell from more than 2.0% per year to 1.5% –
a trend expected to continue. But in absolute numbers the world’s population is growing
faster than ever before. The next 35 years are projected to add another 2.5 billion
people, with 90% of these in developing countries (UN World Population Prospects,
2019). China and South East Asia, along with Africa and India, are predicted to
experience the biggest population growth between 2015 and 2050.
Surge of the middle class
The combination of economic growth and population growth creates increased demand
for meat and dairy products. The interplay between population and economic growth is
important, together with the distribution of income. The surge of the global middle class
is a trend which captures this. Forecasts show the number of middle-class consumers is
expected to grow by more than 40%, to 5.4 billion, over the next 10 years. As shown in
Figure 9, the vast majority of the growth will be concentrated in the Asia-Pacific region.
Figure 9. The size of the global middle class, 2020, 2030
6,000
5,000
4,000
Millions
3,000
2,000
1,000
0
2020 2030
Sub-Saharan Africa Middle East and North Africa Central and South America
North America Europe Asia-Pacific
Source: Kharas (2017), The unprecedented expansion of the global middle class
17This World Bank uses a definition of ‘middle class’ based on an income range of
US$10–US$100 per day, which may seem low by Western standards. However, at
these income levels, consumers begin to have more disposable income to purchase
consumer goods and are open to an increasingly Western diet, with higher levels of
protein consumption.
Growth in consumption
Driven by these factors, the OECD and FAO forecast that global sheep meat
consumption will grow 1.7–1.9% annually in the coming years, with its share of global
meat protein consumption to gradually rise but remain below 5%. The main factor in this
upward trend is the developing markets with a rapidly emerging affluent middle class,
led by Asia-Pacific, which, according to OECD, will account for 95% of forecast growth
in the next decade.
Figure 10. Forecast for global sheep meat consumption
12
Mostly developing markets Mostly developed markets
10
Million tonnes cwe
8
6
4
2
0
Africa South and Asia-Pacific North America Europe Oceania
Central America
2017 2027 forecast
Source: OECD-FAO 2018 Agriculture Outlook
Note: East and North Africa (MENA) split across Africa and Asia-Pacific.
Europe
Europe has been the main destination for UK lamb exports, with around one-third of
production going to EU countries each year. The main bulk of exports is in the form
of fresh whole and half carcases.
With the UK–EU Trade and Cooperation Agreement now in place, the high tariff
barriers that UK lamb would have faced entering the EU have been avoided. However,
non-tariff barriers and trade friction mean that it is not business as usual. Some of
the issues, including physical checks, the requirement for Export Health Certificates
(EHCs), advance notification to border inspection posts, rules of origin, labelling and
documentation requirements are all part of trading as a third country and supply chains
will need to adapt to the new norm. AHDB has published a number of articles and
podcasts around these issues in the EU exit section of our website.
UK lamb is generally regarded as a high-quality product, within the trade, with excellent
taste and good eating qualities. In addition, it is viewed as ‘natural’, being produced
on mainly grass-based outdoor production systems. UK lamb also has a freshness
advantage, being physically closer to EU markets than Australian or New Zealand (NZ)
lamb and reaching supermarket shelves 24 hours ahead of Irish lamb (prior to EU exit).
The trade friction previously mentioned has eroded this advantage. The EU exit has not
benefitted the UK brand within the EU. With labelling requirements to show clearly the
country of origin (GB), selling agents in the EU suggest this will present a marketing
challenge and may negatively impact demand for UK sheep meat going forward.
18Asia-Pacific The UK currently has limited access to Asia’s sheep meat markets. This is because focus has been predominantly on gaining access for pork, due to the high demand and market potential, coupled with freedom from transmissible spongiform encephalopathy (TSE) related restrictions. In a previous Horizon report, on international buying behaviour, we highlighted that consumers in China and elsewhere in Asia place great importance on food safety. China has recently lifted the ban on UK beef exports and Japan has also lifted bans for both beef and lamb. Japan is renowned for its stringent food safety and import controls regime and opening this market is expected to send positive signals to other countries regarding the safety of UK exports. In South Korea, there is no access for sheep meat, due to sanitary and phytosanitary (SPS) issues, but the UK does have access for pork. The tariff for lamb into China is 15%, South Korea 2% (down from 22.5% general tariff through the UK–South Korea trade agreement) and Japan is 0%. The Asia-Pacific market is dominated by China – the world’s largest producer, consumer and importer of sheep meat. Since 2014, China has gradually been lifting restrictions for UK market access, and in 2019, the UK gained access for beef. However, there is a ban on UK imports to China for lamb products due to concerns around transmissible spongiform encephalopathy (such as scrapie). If market access is achieved, in the future the tariff for sheep meat imports into China is 15%, outside of a Free Trade Agreement (FTA). Lamb consumption in China tends to be predominantly from higher-income consumers and has been steadily increasing as this sector of the population expands. Although per capita consumption at 3.8 kilograms is relatively low compared with pig meat, beef and chicken, this is expected to rise by 28% by 2027 (OECD Outlook 2020). This rapid per capita rise, combined with the size of the population in China, means the increase in demand for sheep meat is likely to rise faster than either domestic supply or that from current importers. The vast majority of Chinese import demand is currently met by Australia and New Zealand, who account for 98% of total imports. Both of these countries have a scrapie-free status. The signing of FTAs, with associated tariff rate reductions, gives both countries a competitive advantage over other suppliers. Focusing on domestic production, China has been unable to achieve sufficient productivity gains, hampered by land degradation and resource constraints. The emergence of China as a major importer in recent years has completely transformed the global sheep meat market and driven prices to record levels. Further upward pressure on prices has resulted from the emergence of African swine fever in the pig herd and the subsequent protein shortage in the region. Photo: © Hereford Cattle Society 19
North and South America
The UK currently has access to the Canadian sheep meat market at zero tariff, but not
the USA or Mexico. The World Trade Organisation tariff for lamb to the USA is 0.7c per
kilo (equivalent to 0.8% based on a world average import price 2017–20) and to Mexico
is 10%.

The USA is not a major producer of sheep meat; between 2001 and 2020, the sheep
population decreased from approximately 7 million to 5.2 million head (compared
with 33.5 million in the UK). However, the USA is the second-largest importer of sheep
meat in the world, importing around 110,000 t each year – Australia (75%) and New
Zealand (24%) accounting for most imports. This represents more than half the total
US consumption and tends to be premium cuts, especially legs.

Per capita consumption of lamb in the USA is low but is stable and forecast to remain
so going forward, according to the FAO. The US Northeast, with its high concentrations
of Middle Eastern, Caribbean and African consumers, is a major market for lamb
products. The typical lamb consumer is an older, ethnic-minority individual who lives
in a metropolitan area and who prefers to eat only certain lamb cuts.

There are non-tariff barriers to access the US market. Regulations currently prohibit
UK sheep meat and goat meat imports as a measure designed to reduce and eliminate
scrapie within the USA. This measure is known as the ‘small ruminants’ rule. Countries
wishing to gain new access for exports to the USA face a lengthy application process,
which includes demonstrating an equivalent level of food safety to the US system.

The UK position has improved in recent years, as, following a multi-species audit that
included sheep, the USA lifted its 20-year ban on beef in 2020 and recognised UK meat
inspection as equivalent to its own. This means that premises for lamb exports can be
added to the UK equivalence once the ‘small ruminants’ rule is addressed.

The South American sheep meat market is described as a potentially high-value niche
market. The UK does not currently export sheep meat to South America, where potential
markets are yet to be explored.

Middle East and North Africa
Turning to the Middle East and North Africa, the UK has market access to many markets.
The UK has relatively few preferential trade agreements in place, with Egypt and
Morocco notable exceptions. However, tariff barriers tend to be quite low, with many
of the countries net importers. For instance, the UK currently does not have a trade
agreement with the UAE and Saudi Arabia. This means trade takes place under WTO
rules, where UK exporters pay the duty set by those countries. A tariff of 5% applies for
frozen lamb into both the UAE and Saudi Arabia. In contrast, there are no tariffs applied
to fresh lamb.

There are non-tariff barriers which need to be addressed to access these markets.
For example, all meat consignments destined to the Middle Eastern market must be
accompanied by a halal export certificate issued by an accredited UK halal certification
body. There are in excess of eighteen halal certification bodies in the UK, however, only
a handful of them are accredited to issue halal export certificates to countries in the
Middle East. Processors looking to access these markets must therefore ensure that
they select a local certification body that can issue a valid halal export certificate.

The situation in North Africa is slightly different: while there is a requirement for exporters
to demonstrate the halal status of meat (usually with a halal certificate), there is no
requirement for the UK certification body to be accredited.

                                              20
The Middle East and North Africa region (MENA) is a key global importing market for
sheep meat. There is a strong tradition of consuming sheep meat and demand continues
to grow. An increase in per capita consumption of sheep meat is projected, with demand
growth tightly linked to the oil market, which heavily influences both the disposable
income of the middle class and government spending patterns (OECD, 2019).
Halal and major export destinations
There are opportunities for the export of UK halal sheep meat to the EU, with the
major destinations being France, Germany and Belgium. Outside the EU, there is
appetite for UK sheep meat in Muslim-majority countries, including countries in the
Middle East and Asia. Figures from HMRC show that between 2018 and 2019, there
was a 301% increase in the volume of UK lamb exported to the Middle East from
animals that were stunned prior to slaughter, in compliance with the relevant halal
standards in the Middle East. The volume of fresh and frozen sheep meat exported
to the UAE, for instance, increased from 112 tonnes in 2019 to 853 tonnes in 2020.
While the volume of UK lamb and mutton exported to the Middle East is relatively
low in comparison with Australia and New Zealand, interest in UK lamb is growing
across the region. AHDB recently appointed an agent in the region to engage in
outreach and other promotional activities in order to highlight UK sheep meat as a
high-quality and versatile product.
While the size of the global halal market continues to expand, consumer choices may
be influenced by the method of production and other factors. For markets outside
the EU, the biggest challenge faced by UK processors is the shelf life of sheep meat.
Competing suppliers from some major exporting countries are able to supply sheep
meat with a shelf life up to 120 days, due to exceptional hygiene processes, with that
of UK products averaging around 40 days. Other factors hindering the supply of UK
halal meat to the Middle East and Asian markets include price volatility due to the
seasonality of lamb production and exchange rate fluctuations.
21COMPETITION ANALYSIS
The UK faces competition from sheep production in other countries and also
from other proteins. We know that, in general, the UK is a high-cost producer
of high-quality products, but how do we compare in the sheep sector?
The charts in this section show the costs and returns for sheep enterprises on selected
typical farms, collated by the agri-benchmark network, of which AHDB is a member.
The countries selected in Figure 11 are those the UK trades with or are main competitors
in globally traded sheep meat. Farms are mainly family-run, some with additional paid
labour. With a little variation, they are all producing lambs for slaughter in the region of
40–44 kg liveweight.
Figure 11. Typical farm lamb production costs and output, 2019
600
USD per 100 kg lamb liveweight
500
400
300
200
100
0
00
50
nd
p)
)
n
ce
ill)
w
ai
(u
(H
(lo
an
30
12
la
Sp
Ire
0
Fr
0
S_
S_
0
50
70
45
AU
AU
K_
K_
K_
U
U
U
Cash costs Depreciation Non-cash costs Sheep returns
Source: agri-benchmark
The chart shows that most farms have returns lower than their cash costs, which include
variable inputs (e.g. purchased feed, fertiliser, veterinary, shearing costs) and overheads
(e.g. fuel, machinery repairs, insurance, paid labour, paid rent). The situation is starker
when the depreciation of farm machinery and buildings and non-cash costs, such as the
value of unpaid labour and the rental value of owned land, is incorporated. Using the full
economic costs, only the lowest-cost farm, Aus_3000, is profit-making.
New Zealand is no longer a member of the agri-benchmark network. However, data from
previous years repeatedly showed that the costs of production of typical NZ sheep farms
was slightly lower than Aus_3000, with similar returns.
22The costs of the UK farms, particularly UK_500 and UK_450, are lower than those
found on typical farms in Spain and France. However, they are nearly double the level of
Aus_3000 and those found on typical New Zealand farms. There may be lessons which
UK sheep producers can take from lower-cost producers elsewhere in the world.
New Zealand and Australia have lower costs due to more ewes being managed per
full-time labour unit and lower costs for machinery and buildings. Typically, systems are
extensive, with rotational paddock grazing practised. Costs on the Ireland farm are also
lower; typically, Ireland has smaller farms, worked on a part-time basis and with greater
reliance on contractors, thus reducing their machinery costs.
The agri-benchmark/AHDB typical farms
Due to the variety of different systems which operate, it is impossible to identify a
single ‘typical’ farm. As such, three different farms are included, as outlined below:
UK_450
A lowland farm based in Devon in the South West. It is 200 ha, half of which is
rented. The 450-ewe flock of Lleyn ewes produces its own replacements and
finished lambs sired by terminal sires. There are also 70 spring-calving suckler cows,
some heifer calves kept as replacements and the remaining calves finished on farm.
The farm feeds home-grown barley.
UK_500
An upland grass farm based in the North East. It is 300 ha, half of which is rented.
The 500-ewe flock of Swaledale ewes produces its own replacements, sells some
lambs finished and the rest as stores. There are also 65 spring-calving suckler cows,
some heifer calves kept as replacements and remaining calves sold as yearling
stores for someone else to finish.
UK_700
A sheep-only hill farm based in the North West. It is 195 ha, with the sheep grazing
in-bye grassland as well as access to moorland, which is part of a Higher Level
Stewardship scheme. The majority of the farm, over 90%, is owned. The 700
purebred Swaledale ewes produce their own replacements, some ewe lambs are
sold for breeding and the rest as stores for someone else to finish.
More detail on the farms and information on those shown in other countries
can be found on the agri-benchmark website.
23CONCLUSIONS AND IMPLICATIONS
For UK producers, strong prospects for sheep meat at the global level need to
be balanced with our current focus on a contracting domestic market and our EU
neighbours. When we look ahead, it’s clear that ‘doing what we’ve always done’ won’t
leave us in a strong position to capitalise on the future opportunity. At the same time,
using phrases like ‘step change’ or ‘revolution’ are ill-suited to a sector where we know
gains are incremental and change occurs over many years. Nonetheless, there are
some focus areas where the sheep meat sector needs to think and act differently.
The following aren’t restricted to farmers, incorporating aspects where a range of
businesses and organisations in the supply chain (including AHDB) can play their role.
Prepare for policy change
Farmers:
• Consider the costs and benefits of accessing new governmental income sources,
such as the new Sustainable Farming Incentive within ELM
• Assess what the phasing-out of direct payments means for the future viability of
their farm business. Base this assessment on average market prices over a three- or
five-year period (rather than recent prices, which are unlikely to be maintained in the
medium to long term)
• Consider accessing shorter-term government programmes, such as Countryside
Stewardship funding, which are introduced ahead of the full roll-out of ELM in 2024
AHDB and the supply chain:
• Raise awareness of the policy changes which are occurring
• Support farmers to adapt their businesses to these changes
Government:
• Provide clarity on the new schemes by communicating the details as soon as possible
• Provide evidence around the costs and benefits of involvement
• Consult on possible exit schemes for the industry
24Increase market access for sheep meat in overseas markets
AHDB and the supply chain:
• Continue work to improve UK market access in overseas markets, focusing on
priority markets
• Work with government to identify and improve new digital solutions to minimise the
extra costs and administration requirements currently impacting sheep meat exports
to the EU. For instance, the work to develop Export Health Certificates (EHC) Online
to replace the current system
• Assess opportunities to shift EU exports from predominantly carcase-based to
cuts-based, assuming that solutions to current exporting difficulties are found
Government:
• Work with industry to identify and improve new digital solutions to minimise the extra
costs and administration requirements currently impacting sheep meat exports to the
EU. For instance, the work to develop Export Health Certificates (EHC) Online to
replace the current system
• It would benefit the sheep sector if government prioritised breaking down market
access barriers for sheep exports in discussions with other countries
• It would benefit the sheep sector if government ensured preferential access for UK
sheep meat exports are included in future trade deals. Trade deals with key markets
which have a demand for sheep meat imports (such as China and the US), together
with growing markets in the Asia-Pacific region, could be prioritised
Be ready to compete
Farmers:
• Focus on cost of production and business efficiency. Our competitive position analysis
shows that controlling overheads and machinery costs should be the initial focus.
There may be learnings from our previous Horizon report on the characteristics of
top-performing farms
• Consider and respond to market demands
AHDB and the supply chain:
• Greater innovation and new product development (NPD) in sheep meat would
encourage greater consumption domestically and overseas – particularly for
younger consumers
• Assess the export opportunities and barriers to producing fresh lamb products
with longer shelf life, in line with Australian and New Zealand competitors
Know what our markets require and reward
Farmers:
• Focus on the needs of the end consumer by delivering lambs which meet
the specification of the market which is being targeted
• Consider working with the supply chain to target demand peaks such as Easter,
Christmas and other religious festivals
• Consider the importance of assurance schemes in addressing the needs of
the end consumer
25AHDB and the supply chain:
• Utilise evidence around changing consumer needs to inform planning and protect
plate share
• Connect with the next generation of lamb consumers, who are willing to pay more
for the unique intrinsic qualities of lamb, so that we extract the most value from every
animal, as well as redefining the ‘lamb brand’ with a younger audience
• Focus on positioning lamb as a positive contributor to wellbeing so it benefits from the
growing consumer interest in health. Leverage the sustainability and naturalness of lamb
to appeal to a broader consumer base of ‘mindful eaters’
• Seek opportunities to increase value in traditional channels such as halal, where the
opportunity exists to create a premium proposition for ‘foodies’ that elevates the value
of cuts through NPD
• Identify opportunities to differentiate the product, where there is demand for this.
This might involve branding or messaging around quality, provenance or even
sheep breed
Government:
• Ensure that there is transparency in sheep meat markets, utilising the powers of the
Agriculture Bill where appropriate
26ANNEX 1 – UK TRADE AGREEMENTS
The UK has agreed a number of preferential trade agreements with countries around the
world. Most of these are ‘continuity’ trade agreements which seek to replicate deals the
UK benefited from as a member of the EU. The map below details the countries where
deals are in place, as well as potential new agreements where negotiations are underway.
UK TRADE AGREEMENTS 2021
Countries where agreements are in place:
European Union Nicaragua Papua New Guinea
Colombia Panama Samoa
Ecuador Chile Solomon Islands
Peru Côte d’Ivoire Palestinian Authority
Cameroon Mauritius Singapore
Antigua and Barbuda Seychelles South Korea
Barbados Zimbabwe Botswana
St Kitts and Nevis Egypt Eswatini
Belize Faroe Islands Lesotho
Bahamas Georgia Mozambique
Saint Lucia Ghana Namibia
Dominica Iceland South Africa
Dominican Republic Norway Switzerland
Grenada Israel Tunisia
Jamaica Japan Turkey
St Vincent and the Kenya Ukraine
Grenadines Kosovo Vietnam
Trinidad and Tobago Lebanon Mexico
The Republic of Guyana Liechtenstein Albania
Costa Rica Moldova Jordan
El Salvador Morocco Canada
Guatemala North Macedonia
Honduras Fiji
Countries where agreements are being negotiated:
Algeria Serbia USA
Bosnia and Herzegovina Australia
Montenegro New Zealand
Source: UK Government
27You can also read