RUHR ECONOMIC PAPERS - THE ROLE OF SCHOOLS IN TRANSMISSION OF THE SARS-COV-2 VIRUS: QUASI-EXPERIMENTAL EVIDENCE FROM GERMANY - RWI ESSEN
←
→
Page content transcription
If your browser does not render page correctly, please read the page content below
RUHR
                                                     ECONOMIC PAPERS

Clara von Bismarck-Osten
         Kirill Borusyak
         Uta Schönberg

                           The Role of Schools in Transmission of
                           the SARS-CoV-2 Virus:
                           Quasi-Experimental Evidence from
                           Germany

                                                                   ARCH
                                                               RESE ORK
                                                               NETW       #882
Imprint

Ruhr Economic Papers
Published by
RWI – Leibniz-Institut für Wirtschaftsforschung
Hohenzollernstr. 1-3, 45128 Essen, Germany
Ruhr-Universität Bochum (RUB), Department of Economics
Universitätsstr. 150, 44801 Bochum, Germany
Technische Universität Dortmund, Department of Economic and Social Sciences
Vogelpothsweg 87, 44227 Dortmund, Germany
Universität Duisburg-Essen, Department of Economics
Universitätsstr. 12, 45117 Essen, Germany

Editors
Prof. Dr. Thomas K. Bauer
RUB, Department of Economics, Empirical Economics
Phone: +49 (0) 234/3 22 83 41, e-mail: thomas.bauer@rub.de
Prof. Dr. Wolfgang Leininger
Technische Universität Dortmund, Department of Economic and Social Sciences
Economics – Microeconomics
Phone: +49 (0) 231/7 55-3297, e-mail: W.Leininger@tu-dortmund.de
Prof. Dr. Volker Clausen
University of Duisburg-Essen, Department of Economics
International Economics
Phone: +49 (0) 201/1 83-3655, e-mail: vclausen@vwl.uni-due.de
Prof. Dr. Ronald Bachmann, Prof. Dr. Manuel Frondel, Prof. Dr. Torsten Schmidt,
Prof. Dr. Ansgar Wübker
RWI, Phone: +49 (0) 201/81 49 -213, e-mail: presse@rwi-essen.de

Editorial Office
Sabine Weiler
RWI, Phone: +49 (0) 201/81 49-213, e-mail: sabine.weiler@rwi-essen.de

Ruhr Economic Papers #882
Responsible Editor: Ansgar Wübker
All rights reserved. Essen, Germany, 2020
ISSN 1864-4872 (online) – ISBN 978-3-96973-021-8

The working papers published in the series constitute work in progress circulated to stimulate
discussion and critical comments. Views expressed represent exclusively the authors’ own opinions
and do not necessarily reflect those of the editors.
Ruhr Economic Papers #882
   Clara von Bismarck-Osten, Kirill Borusyak, and Uta Schönberg

The Role of Schools in Transmission of
               the SARS-CoV-2 Virus:
   Quasi-Experimental Evidence from
                             Germany


                                                             ARCH
                                                         RESE ORK
                                                         NETW
Bibliografische Informationen der Deutschen Nationalbibliothek The Deutsche Nationalbibliothek lists this publication in the Deutsche Nationalbibliografie; detailed bibliographic data are available on the Internet at http://dnb.dnb.de RWI is funded by the Federal Government and the federal state of North Rhine-Westphalia. http://dx.doi.org/10.4419/96973021 ISSN 1864-4872 (online) ISBN 978-3-96973-021-8

Clara von Bismarck-Osten, Kirill Borusyak, and Uta Schönberg1

The Role of Schools in Transmission of
the SARS-CoV-2 Virus:
Quasi-Experimental Evidence from
Germany

Abstract
This paper considers the role of school closures in the spread of the SARS-CoV-2 virus. To isolate the impact
of the closures from other containment measures and identify a causal effect, we exploit variation in the start
and end dates of the summer school and fall holiday across the 16 federal states in Germany. Leveraging a
difference-in-differences design with staggered adoption, we show that neither the summer closures nor the
closures in the fall have had any significant containing effect on the spread of SARS-CoV-2 among children
or any spill-over effect on older generations. We also do not find any evidence that schools returning to
full capacity after the summer holidays increased infections among children or adults. Instead, we find
the number of children infected increased during the last weeks of the summer holiday and decreased
in the first weeks after schools reopen, a pattern we attribute to travel returnees and increased testing.

JEL-Code: I10, I18, I28

Keywords: Covid Economics; School Closures; Public Health

November 2020

1 Clara von Bismarck-Osten, University College London; Kirill Borusyak, University College London
and CEPR; Uta Schönberg, University College London, IAB, CReAM, and RWI Research Network. -
All correspondence to: Uta Schönberg, University College London, e-mail: u.schoenberg@ucl.ac.uk

1     Introduction
         The coronavirus pandemic has sparked an international debate on the efficiency of school
closures as a containment measure. As a “second wave” of infections by the SARS-CoV-2 virus
(causing the “COVID-19” disease) is hitting most European countries, the debate is all the more
relevant. The start of the new academic school year and a simultaneous surge in the representation of
children among new cases in the fall 2020 (New York Times, 2020; The Guardian, 2020; ZEIT, 2020)
are adding to the pressure to understand the role of schools in transmission of the SARS-CoV-2 virus.
         Because of their widespread consequences, school closures were among the most
controversial containment policies during the first wave of the pandemic. Prolonged school closures
may have a negative effect on the psychological and emotional development of children, and unequal
remedial measures have been found to widen learning inequalities (Engzell et al., 2020). School
closures also negatively impact the careers of parents obliged to take on more educational
responsibilities and reduce the number of hours supplied in the labour market, which ultimately
lowers GDP (Fuchs-Schündeln et al., 2020). Since women typically shoulder most of the childcare
responsibilities, school closures are also feared to widen the gender wage gap in the long run (Alon
et al., 2020).
         These costs are weighed against the effectiveness of school closures as a strategy to contain
the spread of SARS-CoV-2. The main mechanism through which school closures are expected to be
effective is by preventing social interactions among children in schools. Reduced contact between
children may further break the chain of infection from child to parent and grandparent, thereby
reducing infection rates in the adult population. School closures may also induce a series of either
offsetting or reinforcing behavioural adjustments. On the one hand, children may substitute school
interactions with other activities that introduce additional risks of transmission. On the other hand,
school closures could force parents to work from home, reducing their work-related contacts and,
thereby, their risk of contagion.1
         We aim to identify the effect of school closures on children as well as various age groups of
adults. Understanding the “spill-over” effects on adults is of central importance, as the severity of the
disease has been found to be closely linked to age. Adults are relatively overrepresented among
confirmed COVID-19 cases and have a higher risk of dying from the disease, with 95% of the deaths
in Germany attributed to the group aged 60 and above. Children under the age of 15, by contrast,
account for only 7.2% of Germany’s cumulative confirmed SARS-CoV-2 cases, despite making up

1
  A more worrying labour force response would constitute in the reduction of the health-care workforce available. A study
in the United States estimates that a total of 28.8% of healthcare providers have childcare obligations (Bayham and
Fenichel, 2020).

                                                           2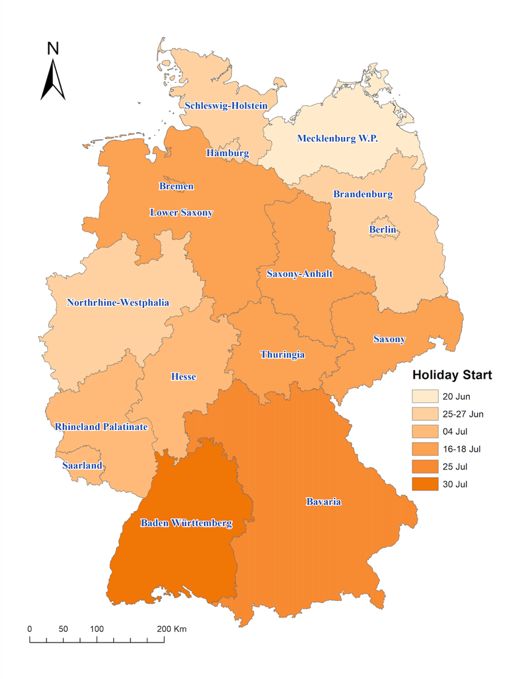
13.6% of the country’s population.2 They generally experience mild symptoms (Wang et al., 2020),
although recent reports suggest an increase in the incidence of children experiencing severe
inflammatory symptoms, which could be linked to SARS-CoV-2 (Pouletty et al., 2020).
         The evidence on the effectiveness of school closures as a containment measure is mixed. Most
epidemiological studies zoom into the level of a single school or other small samples to estimate
infection rates, which subsequently feed into models that project the spread of the virus in the general
population. Recent studies of this kind conducted in France, Germany and Italy have reached vastly
conflicting conclusions on plausible infections rates and contagiousness of children (Fontanet et al.,
2020; Berner, 2020; Fateh-Moghadam et al., 2020).3,4
         In this paper, we take a different approach. We consider school closures and openings as
“treatments” and apply modern econometric tools to identify the “causal” effects of school closures
and openings on SARS-CoV-2 infections among children, as well as their potential spill-over effects
on adults. We exploit variation in the start and end dates of school summer holidays across federal
states of Germany for difference-in-differences identification, building on the strategy developed by
Adda (2016) in the context of influenza, gastro-enteritis, and chickenpox in France. Germany’s
sixteen states Germany have staggered summer holidays to avoid overcrowding the national travel
infrastructure. In 2020, children in the state of Mecklenburg-Western Pomerania began their summer
holiday on June 20, whereas children in Baden Wurttemberg had to wait a further six weeks, until
July 30. Similarly, the fall holidays, which are typically two weeks long, started on October 3 in the
states of Schleswig-Holstein children and Hesse, but only on October 24 and 31 in the states of Baden
Wurttemberg and Bavaria. We exploit this quasi-experimental variation using an estimator developed
by Borusyak et al. (2020) for difference-in-differences settings with staggered adoption of treatment
and heterogeneous treatment effects, which offers advantageous robustness and efficiency properties.
         Two features of the German summer and fall holidays make them attractive as the source of
causal identification. First, whether the holiday starts early or late in each state is decided upon years

2
  These estimates were computed on our own with data described in Section 2.2, as of October 26, 2020. To date, it is
unclear whether the under-representation of children among confirmed cases is related to a higher probability of an
asymptomatic course of disease, lowering the number of recorded cases, or a lower susceptibility to infection.
3
  A “closed cohort study” of a high school in France that was among the first to report a COVID-19 case reported high
infection rates among pupils (Fontanet et al. 2020); a larger-scale study in schools in and around Dresden, Germany,
suggested a low prevalence of antibodies and lower susceptibility to infections (Berner 2020). A third study from Trento,
Italy using contact tracing found that children under 15 years were the most contagious of any age group (Fateh-
Moghadam et al. 2020, with a sample size of 14).
4
  An alternative to the “cohort studies” is to examine the viral concentration in the upper respiratory tract in test samples.
Most such studies published in the course of the summer 2020 found no evidence of a smaller viral load in children than
in infected adults (Heald-Sargent et al. 2020; Jones et al. 2020). Viral concentration studies come with a host of caveats,
one of which is sample selection. Symptomatic subjects may be overrepresented in the clinical samples of tests studied,
making it difficult to draw inferences on a population of children with a large share of asymptomatic cases.

                                                             3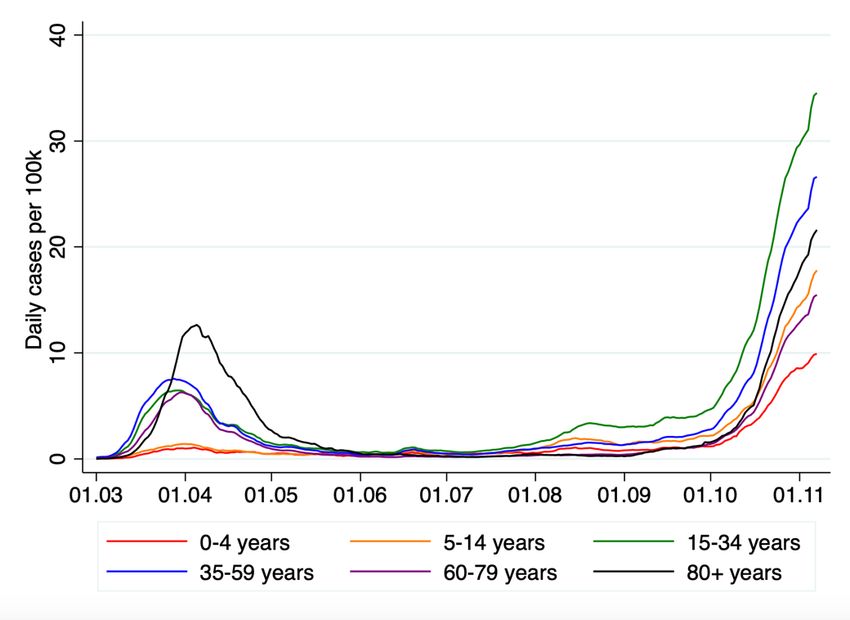
in advance and was unaltered by the pandemic. Therefore, the variation in the start and end date of
the holidays across German states was not confounded by the spread of SARS-CoV-2 in the state.
Second, in contrast to school closures during the first lockdown in March, the start and end of summer
school holidays did not coincide with the introduction of other containment measures, such as the
closing of bars, restaurants and non-essential shops, allowing us to isolate the impact of school
closures. This was also the case for the fall holiday, with the exception of a partial lockdown5
announced at the federal level implemented November 2, which is why we focus on the fall holiday
closures and restrict the empirical analysis to the period preceding the lockdown announcement,
October 28.6
          Difference-in-differences estimation of the effects of schools on the spread of SARS-CoV-2
at the regional level is also attractive from a policy perspective. These estimates identify an overall
impact, encompassing all behavioural adjustments that school closures bring about, such as increased
activities of children outside school and reduced work-related contacts of parents. Moreover, the
baseline against which school closures are evaluated is not the status quo before the pandemic, but a
situation in which various other containment measures are in place. By analysing the effects of both
school closures and reopenings, we evaluate whether schools that operated at partial capacity (as it
was the case before the summer holiday) play a more limited role in spreading SARS-CoV-2 than
schools that reopened to full capacity, with additional hygiene rules and other restrictions, at the end
of the summer holiday. By comparing the effects of the summer and fall holiday closures, we assess
whether closures are more effective at containing the spread of SARS-CoV-2 in situations when cases
in the population are high (as in the fall) compared to situations when they are low (as in the summer).
Our estimates are, therefore, directly informative on the trade-offs that policymakers may face in the
future.
          At the same time, some limitations of our methodology are worth pointing out. The summer
holidays are a time of increased travel for families. Most likely, this increased the risk of infection,
especially since the infection rates in typical destination regions were higher than in Germany. With
our strategy, it is challenging to disentangle any rise in confirmed COVID-19 cases due to travel from
a rise due to school reopenings per se. Moreover, Germany started testing travel returnees, including
children, at an increasing rate starting August 1, potentially raising the number of positive cases even
without a true increase in the infection rate. To tackle this difficulty, we leverage the exact timing of

5
  The lockdown implemented November 2 involves closures of cultural entertainment venues, restaurants, pubs and
bars. Schools or day care centers were set to remain open.
6
  By October 28, the fall holidays have ended in most states with the exception of Thuringia, Saxony, Baden Wuerttemberg
and Bavaria.

                                                          4
the increases in cases around the date of reopening after the summer holiday to determine the most
likely explanation. While the fall holidays are less likely to be contaminated by travel behavior (since
families travel considerably less during the fall than the summer), their short duration and more
limited cross-state variation in timing prevent us from considering fall school closures and reopenings
as separate events.
       We find little evidence that school closures in the summer lowered SARS-CoV-2 infection
rates among school-aged children or elder generations. At best, according to the lower bound of the
95% confidence interval of our baseline estimates, only 0.33 infections per 100,000 school-aged
children (ages 5-14) and 0.03 infections per 100,000 adults aged 60 and above have been prevented
per day in the first three weeks of the school summer holiday.
       Similarly, we don’t find that the return to full-time schooling after the summer holiday led to
an increase in infections among school-aged children. Instead, we find that SARS-CoV-2 infection
rates tend to increase in the last weeks of the summer holiday and decline in the first days after schools
open, a pattern visible in all age groups, but more pronounced in the younger population. We consider
this to be best explained by an increase in testing of families returning home from their travels or the
higher risk of infection they are exposed to while travelling. It could, however, also be attributed to
precautionary testing before the start of the school term.
       Our findings based on the fall holiday confirm that school closures do not significantly reduce
COVID-19 cases among either children or adults, even in situations when COVID-19 cases in the
population are higher. These results are, however, limited to two weeks after the start of the holiday
and therefore may not capture spillover effects that take longer to appear; they are also less precisely
estimated.
       Our results are broadly in line with contemporaneous work by Isphording et al. (2020), who
use a similar research design to estimate the impact of school reopenings after the end of the German
summer holiday. Two differences are worth noting, however. While their analysis exclusively focuses
on the reopening of schools at the end of the summer holiday, we evaluate school closures and
reopenings in the summer as separate events and provide complementary evidence on the closures
induced by the fall holiday. In addition, we pay extra attention to the period just before schools
reopened in the summer and identify a significant increase in infection rates during that time. This
leads us to conclude that travel returnees may have contributed to the spread of SARS-CoV-2.
       At the same time, our findings differ from those of Adda (2016) who found that school
holidays reduce the incidence of viral diseases such as gastro-enteritis and influenza among both
children and adults. One explanation for the difference in findings could lie in the differences between
SARS-CoV-2 and other viruses. Alternatively, the difference could stem from the hygiene rules and

                                                   5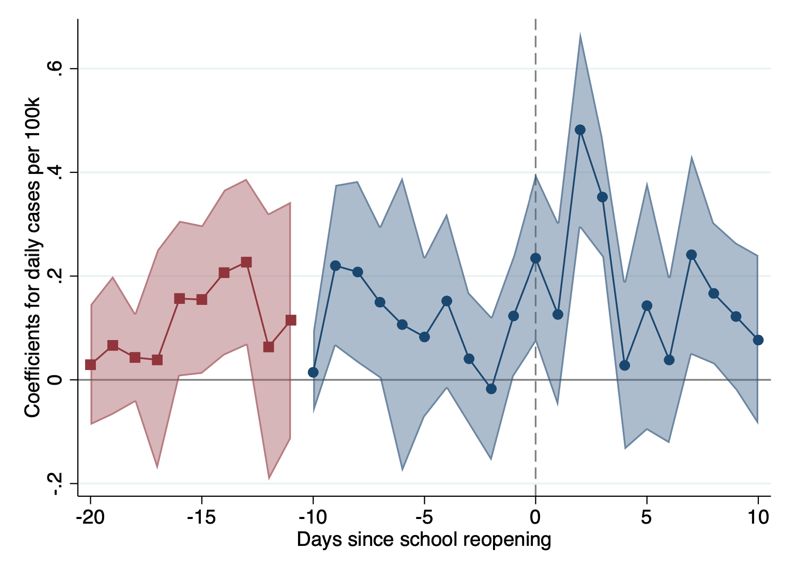
procedures currently in place in schools to avoid contagion, which are not typically implemented
during the seasonal outbreaks of other diseases studied by Adda (2016).
       Overall, our findings cast doubt on the assumption that school closures are successful at
reducing the spread of SARS-CoV-2 in the population. Our results also provide little support for the
hypothesis that school openings at the start of the academic year substantially contributed to the surge
in infections observed in the fall of 2020.
       The remainder of this paper is organised as follows. Section 2 provides background
information on the spread of the SARS-CoV-2 virus in Germany, the containment measures
implemented, school holidays, and introduces the data. The empirical strategy is described in Section
3. Section 4 reports the empirical results, and Section 5 concludes.

 2       Background
   2.1 The Institutional Setting in Germany
       Germany’s Policy Response to the Pandemic
       Germany’s early response to the pandemic in spring 2020 differed from its later and current
response. In the German federal system, the states have large autonomy to legislate, including on
matters of disease prevention. For that reason, the start of the outbreak was characterised by
uncoordinated policy responses by the state governments. Independent state decisions on issues such
as compulsory mask wearing in public transit and closing bars and restaurants were often timed
similarly (see the see IAB database on the containment measures in Germany; Bauer and Weber,
2020). But implementation and enforcement of these policies varied from state to state.
       Similar patterns characterized school closures during this early period. Drawing on the
experience with influenza, where school closures proved particularly effective (Viner et al., 2020;
Adda 2016), schools were closed early in the outbreak of SARS-CoV-2, around March 16. After the
Easter holidays (around April 18), all states proceeded to partially reopen schools, although not for
all cohorts and not for all school types symmetrically (Frankfurter Allgemeine Zeitung, 2020).
Cohorts with examinations were prioritised and shifts were introduced as a solution in many schools.
It was the task of schools to gauge how best to guarantee compliance with social distancing rules and
hygiene standards.
       This policy environment makes the spring period unsuitable for our analysis: the variation in
the timing of school closures is limited and was strategically chosen by states in response to the local
dynamics of the pandemic. Moreover, other containment measures coincided with school closures.

                                                  6
In contrast, the summer and fall holidays happened during the period when fewer new policies
were being introduced (with exceptions discussed below), and containment measures tended to be
homogenous across states. The latter was a consequence of the Federal Government’s coordination
efforts in late spring, in order to increase policy transparency and ensure compliance. We therefore
start our analysis on June 1, by which point the coordination process was largely over.
Three important policy measures were introduced during our period of study, in a
homogenous way across states. First, the state governments coordinated to ensure that at the end of
the summer holidays schools across Germany returned to teaching at full capacity (Handelsblatt,
2020). Second, the Federal Government ensured the testing of returning travellers across the country.
On August 1, it waived the cost of testing for these returning travellers, and on August 8, it introduced
compulsory testing for travellers returning from high-risk countries.7 Third, Germany announced on
October 28 and implemented on November 2 a partial nation-wide lockdown, involving closures of
entertainment venues, restaurants, pubs and bars. Schools and day care centres, however, were set to
remain open. This partial lockdown does not affect our analysis on the closures and reopenings in the
summer but overlaps with the fall holiday in Bavaria (and marginally in three other states where the
holiday ended on November 2). When analysing the impact of fall holiday closures on COVID-19
cases, we therefore restrict our analysis to infections up to October 28, the day the lockdown was
announced.
The Summer and Fall School Holidays
Since our empirical strategy will exploit the variation in the start and end dates of the
summer and fall holiday across the 16 German states, it is important to explain the process
generating this variation. In Germany, school summer holiday dates are planned several years in
advance, with most states alternating between early and late summer holiday starting dates.
Figure 1 offers an overview of the holiday start and end dates in the summer (Panel A) and
fall (Panel B) of 2020. Summer holidays last six weeks in all German states. There are also six
weeks between the state with the earliest and latest start of the school summer holidays. The summer
holiday period stretches across almost three months, with the first schools closing on June 20 and
last schools reopening on September 13. The fall holiday starts as early as October 3 in the states
of Mecklenburg Western Pomerania, Schleswig-Holstein, Hesse and Hamburg and as late as
October 24 and 31 in the states of Baden Wurttemberg and Bavaria. In 12 out of the 16 states, fall
7
One state constitutes a small exception, as it had introduced these policies before the Federal Government. In
Mecklenburg-Western Pomerania the summer holidays ended on August 2, and tests were made compulsory at the state
level beforehand (Deutschlandfunk, 2020).
7holidays last two weeks; in four states, they last one week only. States that start their summer
holiday early typically also start their fall holiday early.
Figure 2 illustrates the geographic variation in the summer holiday start date, showing that
summer school holidays started first in one of Germany’s most Northern states (Mecklenburg
Western Pomerania) and last in Germany’s most Southern states (Baden Wurttemberg and Bavaria).
The fall holidays are of independent interest to study for two reasons. First, because they
fell into a period when infection rates were considerably higher than during the summer holidays
and when the effectiveness of school closures in containing the spread of SARS-CoV-2 may thus
have been higher. Second, because two week-long school closures have been discussed as possible
“circuit breakers” in for example England (The Telegraph, 2020). Despite their relevance, the fall
holiday setting has important drawbacks. Because of their short duration and the more limited cross-
state variation in start dates, we can reliably estimate the effects of fall school closures on the spread
of SARS-CoV-2 only up to two weeks since the start of the fall holiday and, even over this time
period, estimates are less precise than for summer school closures and reopenings.
2.2 Data
This paper relies on data from the federal government agency known as the Robert Koch
Institute (RKI), which is responsible for the prevention and control of epidemics in Germany, as
well as for epidemiological research. Their database has recorded all confirmed positive cases,
deaths and recoveries in Germany on a daily basis since the first COVID-19 case was reported on
January 15, 2020.8 In our descriptive and empirical analysis, we use data up until October 28. The
data are available at the county (“Landkreis”) or city (“Stadtkreis”) level. Berlin constitutes an
exception, where the data are available by borough (“Bezirk”). Altogether, the dataset comprises
415 regional entities which we refer to as districts.
Each positive case is coded with a “reporting date” when it became known to the local
health department, which is generally the same day the test results were received.9 All positive
cases are either (i) confirmed recovered, (ii) deceased or (iii) neither recovered nor deceased when
they are still under quarantine restrictions. This information allows us to obtain the number of
deaths at the regional level. The deaths are coded according to the reporting date, the day on which
8
Retrieved on November 14, 2020, from:
https://www.arcgis.com/home/item.html?id=f10774f1c63e40168479a1feb6c7ca74.
9
Source: RKI, phone interview. For around 60% of cases a “reference” date is also provided, when the first symptoms
appear. However, due to a large fraction of missing data (in particular, because of asymptomatic cases), we do not use
these reference dates in the analysis.
8the deceased person tested positive for the virus, and not the day of death. In addition, the data
contain information regarding age brackets for each case, classified as 0–4, 5–14, 15–34, 35–59,
60–79 and over 80-years-old.
Positive cases are registered in the district in which the person is staying on the reporting
date and where the quarantine regulation is enforced. The district to which a positive case is
attributed does not, therefore, necessarily correspond to the place of residence. However, it is to
be expected that the wide majority returning from travels get tested in their place of residency.10
From a list of confirmed reported cases, we transform the data into a daily panel dataset.
We then augment it to include population counts by age brackets which were retrieved from the
regional database (“Regionaldatenbank”) and correspond to December 31, 2018.11 For the
boroughs of Berlin, the data were instead obtained from the Statistical Office of Brandenburg-
Berlin as of December 31, 2019.12
2.3 A Descriptive Outlook on the Spread of SARS-CoV-2 in Germany
Before proceeding to the analysis, we provide an overview of the dynamics of the SARS-
CoV-2 spread in Germany. Figure 3 contrasts daily cases (Panel A) and daily deaths (Panel B) per
100,000 inhabitants in Germany (red line), the United States (purple line) as well as four selected
European countries (France, Italy, Sweden and the United Kingdom), based on the data from the
European Centre for Disease Prevention and Control (ECDC).
In Germany, the peak of daily cases in the first wave of infections was reached on the March
28, 2020, with 7.51 reported cases per 100,000 inhabitants (6,294 overall), and the peak of daily
deaths on April 16 with 0.38 deaths per 100,000 (315 overall).13 Daily cases remained relatively low
– fewer than one reported case per 100,000 – throughout May and June when lockdown measures
were gradually eased. Since late-July, reported cases have been steadily increasing, with a noticeable
uptick in cases in early October. For the first time on October 15, the ECDC reported more cases per
100,000 than at the peak of the first wave (7.92 per 100,000; 6,638 overall).
By international comparison, Germany showed a similar trend in newly reported cases as
other European countries such as Italy, France and the United Kingdom between March and June.
10
Information received via email exchange with the Robert Koch Institute.
11
Retrieved from:
https://www.regionalstatistik.de/genesis/online?language=de&sequenz=tabelleAufbau&selectionname=12411-04-02-4
12
Retrieved from: https://www.statistik-berlin-brandenburg.de/datenbank/inhalt-datenbank.asp
13
These numbers use the data from the European Centre for Disease Prevention and Control (ECDC). According to the RKI
database (which our empirical analysis relies on), the peak of daily new cases and daily new deaths were both reached on the
April 2, 2020, with 7.88 reported cases per 100,000 inhabitants (6553 overall) and 0.50 deaths per 100,000 (415 overall). Note
that the RKI database reports the date the deceased person was reported positive, and not the date of death.
9While most European countries experienced an acceleration in daily reported cases during the
autumn, the increase has been less pronounced in Germany than in France, the United Kingdom, and
Italy. The United States followed a different time pattern, in that new cases per 100,000 never fell
below 9 per day, reached a first peak of about 20 in late July, and started increasing again in
September, albeit at a slower pace than in most European countries.
Relative to other countries, Germany stands out in terms of the relatively low death toll. At
the peak of the first wave, the death rate per 100,000 inhabitants was about 0.38 (315 overall) in
Germany, but above 1 in Italy, France, the United Kingdom and Sweden. While the second wave of
the pandemic has turned out to be less deadly than the first wave, an uptick in daily deaths per 100,000
inhabitants starting in early October is clearly visible in the United Kingdom, France and Italy, and
to a lesser extent in Germany. In Germany, and likewise for other countries, adults aged 60 and above
have a considerably higher risk of dying from the COVID-19 disease and make up 95% of all deaths.
Figure 4 shows daily SARS-CoV-2 cases per 100,000 over time by six age brackets.
Strikingly, during the first wave of the pandemic in March and April —when, for the most part,
schools were closed due to general lockdown measures—infection rates among children (aged 14 and
below) were low, both in absolute terms and relative to other age groups. In contrast, during the
“second wave” of the pandemic in September and October—when schools were open—infection
rates among children rose at a similar pace to those of adults. The increasing share of children among
newly confirmed cases appears to coincide with the end of the summer school holiday and has been
linked to school openings by the press (New York Times, 2020; ZEIT, 2020). The quasi-experimental
variation in the school holiday dates in Germany offers a unique setting to investigate that relationship
in a rigorous manner.
3 Methodology
Identifying the impact of school closures and openings on the spread of SARS-CoV-2 using
modern econometric tools is complicated for several reasons. School closures and openings are
typically enforced nation-wide, making it impossible to disentangle these effects from general time
trends. Moreover, when there is variation in school closures across regions within the same country,
it typically results from the regional responses to rising infection rates and hence cannot plausibly
be considered unconfounded. A similar problem arises in studies that exploit variation in the timing
of school closures and openings across countries; such studies are additionally plagued by
differences in the testing procedures of these countries.
In addition, school closures and openings typically go hand in hand with the introduction
10and easing of other lockdown measures, making it impossible to isolate the impact of school
closures and openings on SARS-CoV-2 infection rates. For example, when schools were closed
country-wide in Germany in March 2020, all non-essential shops, including bars, were also closed,
travel restrictions were expanded, workers were told to work from home wherever possible, and
simultaneously limitations on contact between households were introduced.
To overcome these identification challenges, we build on Adda (2016) and exploit the
variation in the timing of summer and fall school holidays across German states to isolate the impact
of school closures and reopenings from other factors on the spread of SARS-CoV-2. As outlined in
Section 2.1, the schedule of school holidays in 2020 was unaltered by the pandemic and did not
coincide with other state-specific lockdown measures. The German setting is particularly interesting
in this context, since, as also explained in Section 2.1, the variation in the timing of both summer
and, to a smaller extent, fall school holidays is larger than in other countries.
For identification, we rely on a difference-in-differences design with staggered adoption of
treatment. This methodology assumes that the true causal model for the outcome of interest reported
in district ! on day " is
#!" = %! + '" + (!" )!" + *!" . (1)
Here %! and '" capture the district and day fixed effects and )!" = 1[" ≥ 1! ] is the indicator that the
district is “treated” (i.e., schools have closed or reopened, depending on the analysis), where 1! is the
day when district ! is treated. We separately consider two treatments: school closures and openings
in the summer and the closures in the fall. Further, (!" captures the “treatment effect”—that is, the
impact of the school closures and openings on the spread of SARS-CoV-2—while *!" is the residual
such that 1 [ *!" ∣ %! , '" , )!" ] = 0. The model in (1) incorporates the parallel trends assumption,
whereby the expected outcome absent the treatment is %! + '" . It also allows for heterogeneous
treatment effects by district and time, and thus by the number of days since treatment.
To characterize treatment effects, we use the “imputation estimator” of Borusyak et al. (2020).
A recent literature has shown that estimating equation (1) as a conventional event study, i.e. by OLS
with two-way fixed effects and some lags and leads of treatment, produces estimates that are not
reliable in presence of effect heterogeneity and potentially even have a wrong sign. Several robust
estimators have been recently proposed (e.g., de Chaisemartin and D’Haultfœuille 2020; Sun and
Abraham 2020). Relative to these estimators, the imputation estimator possesses attractive efficiency
properties, is transparent, and conservative standard errors are available for it, which can be computed
analytically.14
14
We implement the analysis using the did_imputation Stata command provided by Borusyak et al. (2020).
11The imputation estimator is constructed in three steps. First, the district and day fixed effects
%! and '" in equation (1) are estimated by OLS on the subsample of untreated observations only, i.e.
those with )!" = 0. In the case of the school closures we, therefore, estimate %! and '" using the data
until the last day of school before the start of the holiday in each state. Second, we obtain an unbiased
estimate (̂!" = #!" − %9! − ':" for each treated observation. While treatment effects for each day and
district cannot be estimated consistently, Borusyak et al. (2020) show that averages of (̂ !" across many
observations can, under appropriate regularity conditions. Any such average of interest can therefore
be reported in the third step. We focus here on the average effect a given number ℎ days since
treatment (ℎ ≥ 0):
$
(̂ # = |& | ∑!∈&! (̂!,(" )# , (2)
!
where ># is the set of districts ! observed in period 1! + ℎ.
For each horizon ℎ, the imputation estimator leverages all difference-in-differences contrasts
between some district ! in period 1! + ℎ (i.e., on a day ℎ days after treatment) relative to periods
before treatment, " < 1! , and relative to other districts which have not been treated yet by 1! + ℎ.
This estimator is only available for ℎ < @, where @ is the gap between the earliest and latest event
dates observed in the sample (six weeks in our case, or five weeks with a reasonable sample size).
This is in contrast to OLS estimates which are in principle possible to estimate for any long horizons
but may not be reliable: there are no difference-in-differences contrasts that can directly identify those
effects, and the estimates are obtained solely by extrapolations appropriate only under constant
treatment effects. We focus on the effects of the school closures and openings in the summer up to
three weeks after the beginning and end of the summer holiday (i.e., for ℎ = 0, … ,20).
In our baseline specification, we define the outcome variable #!" as the number of confirmed
COVID-19 cases per 100,000 inhabitants in some age bracket. We distinguish between children aged
from 5 to 14 years old, whose infection risks may be directly reduced by school closures, and adults,
for whom the effects are indirect. Limited by our data, we consider three adult age groups: a group of
young adults between 15 and 34 years old; a group of middle-aged adults between 35 and 59 years
old, in which most parents of school-aged children will fall; and a group of vulnerable adults older
than 60 years of age. We also consider the number deaths per 100,000 inhabitants in the 60+ age
group, since 95% of the deaths are concentrated in that group.
We start out by estimating the effects of the school closures in the summer on the spread of
SARS-CoV-2. To provide empirical support for the assumption of parallel trends, we follow
Borusyak et al. (2020) and estimate the regression on the set of untreated observations only:
12,$
#!" = %! + '" + B C+ 1[" = 1! + D] + *!" . (3)
+-,.
Here, 1[" = 1! + D] are indicator variables of being treated 1 to F days later; we set F = 14. A
conventional joint test of C+ = 0 is then performed, and the magnitude of C9+ can be visually examined.
It is important to note that this approach for pre-trend testing differs from the convention where pre-
trend or placebo coefficients are estimated jointly with the treatment effects (̂ # . Borusyak et al. (2020)
explain three advantages of this approach. First, it clearly separates validation of the design (i.e. of
the ex-ante assumption of parallel trends) from estimation given the design. Second, by imposing no
pre-trends at the estimation stage, it improves efficiency of treatment effect estimation: all untreated
observations are used in the imputation. Third, it removes the correlation between the treatment effect
and the pre-trend estimators; such correlation introduces bias when the researcher follows the
conventional practice of trusting the results only conditionally on the pre-trend test passing.
When turning to the effects of school reopenings in the summer, we additionally allow for
“anticipatory” effects of treatment present up to H days before treatment; we set H = 14. We do this
to allow for the possibility that SARS-CoV-2 infection rates may increase prior to school openings
because of travel returnees and increased testing. Families often return home in the last two weeks of
the summer holiday and, as described in Section 2.1, typically spend their vacation in regions where
infection rates were higher than in Germany and were tested upon returning home. The imputation
estimator extends directly to the case of anticipation effects, with the treatment indicator redefined to
switch to one H days before treatment: )!" = 1 [" ≥ 1! − H]. We (re)estimate district and day fixed
effects %! and '" in equation (1) using only those observations that are assumed to be unaffected by
the school opening treatment (i.e., observations more than two weeks before the end of the summer
school holiday). We also check for “pre-trends” in a similar way as for school closures, by estimating
equation (3) on a set of untreated observations and by testing whether the C+ coefficients are
individually and jointly equal to zero.
It should be noted that, when examining the effects of school reopenings on the spread of
SARS-CoV-2, we implicitly assume that the preceding school closures in the summer have had no
impact on SARS-CoV-2 infection rates. We explicitly investigate—and provide empirical support
for—this assumption in the first part of the empirical analysis, where we study the effects of summer
school closures on the spread of SARS-CoV-2.
In the final step of the empirical analysis, we estimate the effects of fall holiday closures on
the spread of SARS-CoV-2. We consider anticipatory effects due to travelling behavior unlikely in
this context and therefore test for differential pre-trends in the 14 days prior to the start of the school
13holiday (i.e., we set H = 0 and F = 14). As Panel B of Figure 2 shows, the difference in the start
dates of the fall holidays between states that introduced them first and last is four weeks (compared
to six weeks for the summer holidays), so that we could in principle estimate the effects of fall school
closures up to four weeks since the start of the fall holiday. However, the state in which fall holidays
started latest (Bavaria) appears to exhibit a different time trend in infection rates from other states and
thus is not a reliable control group. Hence, estimates for the impact of fall school closures on the
spread of SARS-CoV-2 beyond the first two weeks rest on a single state (Baden Wuerttemberg). We
therefore focus in our analysis on effects in the first two weeks after the start of the fall holiday and
do not consider fall school closures and reopenings as separate events.
In the appendix, we examine the robustness of our main empirical strategy with two
alternative ones. First, we adopt the conventional event study methodology, which involves
estimating the following equation via OLS:
/,$
#!" = %! + '" + B (# 1[" = 1! + ℎ] + *!" . (4)
#-,0
Here H is the number of treatment leads, corresponding to the allowed anticipation effects, and the
effects H or more days before treatment are assumed to be zero. Focusing on the effects in the first @
days after treatment, we drop observations with " ≥ 1! + @ (which is preferable to the common
alternative of “binning” them together; see Borusyak et al., 2020).
Second, we note that parallel trends in levels may not hold if there are national trends in
infection rates that affect districts proportionately rather than additively. In that case, the following
multiplicative model may be more appropriate:
1[#!" ∣ %! , '" ] = exp(%! + '" + (!" )!" ) . (5)
While, in principle, one could estimate a log-linear specification, it appears infeasible in our
application, as there are many district-day pairs for which no COVID-19 cases were recorded. We
therefore use the Poisson Pseudo-Maximum Likelihood (PPML) method, appropriate for this
assumption (e.g. Santos Silva and Tenreyro, 2006), and use the PPML-HDFE estimator of Correia et
al. (2020) which allows for high-dimensional fixed effects. Since robustness of PPML methods to
treatment effect heterogeneity has not been studied to date, and since robust estimators are not
available, we use the event study formulation analogous to (4).
144 Empirical Findings and Discussion
4.1 The Effect of Summer School Closures on the Spread of SARS-CoV-2
The Impact of School Closures on Infection Rates among Children.
We begin by examining the impact of the school closures induced by the summer holidays on
infection rates among school-aged children. In Panel A of Figure 5, we group states into six categories
according to their school summer holiday start date, ranging from June 20 (red line) to July 30 (black
line), and display COVID-19 cases per 100,000 children, smoothed using a moving average filter
with three lags and three leads, from June 1 until schools reopen at the end of the holiday. The colored
vertical lines indicate the respective starts of the summer holiday. The infection rates among children
remained relatively constant in the three weeks leading up to the summer holiday, as well as the first
three weeks of holiday. Panel A therefore already provides little descriptive evidence to support the
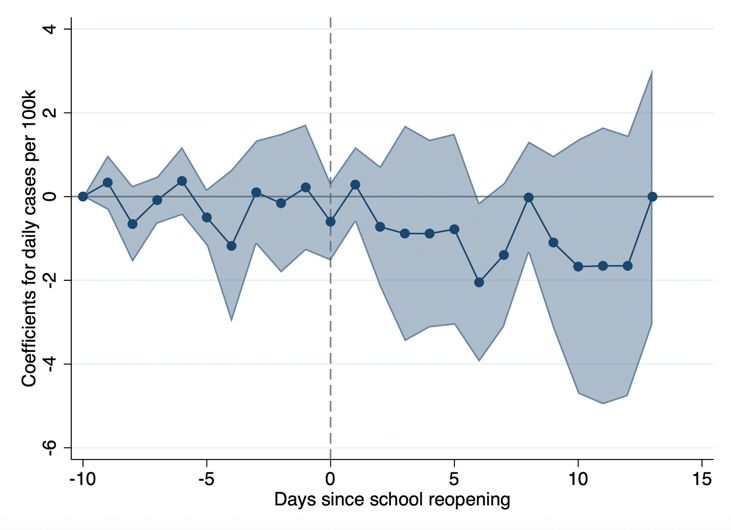
hypothesis that school closures helped bring down rates of infection among children. In Panel B of
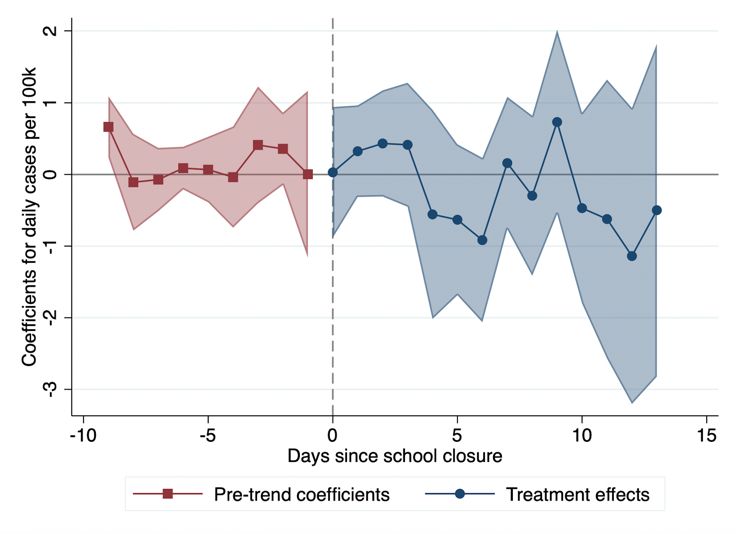
Figure 5, we plot “placebo” estimates prior to treatment obtained from regression equation (3) (the
red squares) and “treatment” effects for three weeks following school closures, estimated according
to equation (2) (the blue dots), together with 95% confidence intervals. The figure validates the
empirical design: the pre-trend coefficients are small and, with one exception, statistically
insignificant.15 Moreover, the figure confirms the pattern observed in Panel A, namely that the school
closures have had little impact on infection rates: the treatment effects are small and typically
statistically indistinguishable from zero.
We report the corresponding treatment effects averaged over the first three weeks of the
summer holiday in the first row of Table 1. The point estimate for the entire three-week period is -0.12
(column (4)), with a 95% confidence interval of [-0.33, 0.09]. Thus, taking the uncertainty of the
estimate into account, the lower bound of the confidence interval implies that the school closures
have – at best – prevented 0.33 infections per 100,000 children daily. This is a rather small effect in
terms of absolute magnitude. It should be noted, however, that the mean daily infection rate of
children in the week before the start of the summer holiday was also very low (0.68, see column 5 of
Table 1).
The Impact of School Closures on Infection Rates among Adults.
Next, we turn to the impact of the school closures on SARS-CoV-2 infection rates among
adults, where we distinguish between adults in the age ranges of 15-34, 35-59, and 60+. Figure 6
15
It should be noted that the F-test weakly rejects the hypothesis that coefficients are jointly equal to zero with a p-value
of 0.011. However, coefficients are sometimes below and sometimes above zero and do not exhibit a clear upward or
downward trend.
15repeats the structure of Figure 5 for each of these groups, with rows (2) to (4) of Table 1 providing
the corresponding averages. Overall, they provide little support for the hypothesis that school closures
would help bring down infection rates. For example, the lower bound of the confidence interval for
the most vulnerable group of adults – the population older than 60 (row (4) and column (4) in Table
1) – signifies that school closures prevented at most 0.025 infections per 100,000 per day in this
group.
In Figure 7 and in row (5) of Table 1, we repeat the analysis of deaths per 100,000. Here, we
restrict the analysis to adults aged 60 and above, the age category comprising 95% of all COVID-19
deaths in Germany. Not surprisingly, given our previous findings, there is no indication the closures
helped prevent deaths.
To summarize, the summer closures appear to have had little impact on SARS-CoV-2
infections among children and adults. These results are robust to alternative estimation methods
such as the conventional event study (Appendix Figure A1) and PPML (Appendix Figure A2). To
put these results into perspective, it is important to bear in mind that schools typically operated at
only half capacity before the summer holiday. Moreover, in the weeks before the start of the school
holiday, SARS-CoV-2 infection rates were generally low in all states, with an incidence of around
0.7 per 100,000 inhabitants per day. In such a situation, it may not be surprising that school closures
in the summer did not help reduce the infection rate further.
4.2 The Effect of School Reopenings after the Summer Holidays on the Spread
of SARS-CoV-2
Having established that the school closures in the summer have had little impact on the spread
of SARS-CoV-2, we turn to the impact of school reopenings on infection rates. After the summer
holiday, schools generally started to operate at full capacity, although strict hygiene rules and clear
procedures specifying what to do in the event of a school outbreak were introduced. The effects of
the school closures and reopenings are therefore unlikely to be negatively symmetric. Moreover, there
may be “anticipation” effects of school reopenings at play, driven by increased testing upon return
from travels or precautionary testing before the start of term.
The Impact of School Reopening on Infection Rates among Children.
In Panel A of Figure 8, we display daily infection rates per 100,000 children, smoothed
using a moving average filter with three lags and three leads, from June 1 to October 5 (or until the
fall school holiday started, whichever is earlier). The figure distinguishes between six groups of
16states with differing school reopening dates, indicated by the colored vertical lines. A striking
pattern emerges. Infection rates among children tend to increase in the two weeks before the end of
the summer holiday and decline shortly after schools have reopened.
We report treatment estimates based on the imputation method by Borusyak et al. (2020) in
Panel B of Figure 8, where we allow for two weeks of “anticipation effects” of school reopenings
(blue dots). The estimates confirm the pattern visible in Panel A: Point estimates increase and are
statistically different from zero in the last two weeks of the summer holiday; they then decline from
the third day of schools being open and turn negative from the second week. “Placebo” estimates
prior to two weeks before schools reopened (red squares) are generally small in magnitude and not
statistically significant different from zero – in line with our findings that the school closures in the
summer had little impact on the spread of the SARS-CoV-2 virus in the child population.16 The
pattern of increased infections before schools reopened, followed by a decline in cases after schools
reopened, is robust to alternative estimation procedures: the conventional event study (Appendix
Figure A3, Panel A) and PPML (Appendix Figure A4, Panel A).
While the significant negative effects in the second and third weeks after school reopenings
may appear puzzling, we do not place much emphasis on this finding. The negative effects stem
from the two states which reopened their schools last (Baden Wuerttemberg and Bavaria, the purple
and black lines in Panel A of Figure 8), where cases seem to have increased four weeks before the
end of the holiday rather than two.17 Removing these two states from our sample in Panel C of
Figure 8 causes the negative effect to disappear and allows us to confirm the increase in cases before
reopening, which dissipates shortly after.18
The fact that SARS-CoV-2 infection rates among children start to increase before schools
reopen makes it highly unlikely that increased contact with other children, caused by the reopening
of schools, is responsible for the uptick in cases among children. In our view, the most plausible
explanation for the pattern of treatment effects relates to travel behavior. Families often spend their
summer holiday in areas where infection rates were higher than in Germany. Family members,
including children, were then tested at much higher rates upon returning to Germany, typically
during the last two weeks of the summer holiday.
We report corresponding treatment effects, averaged over one-week periods starting from
16
It should be noted, however, that the F-test rejects the hypothesis that coefficients are jointly equal to zero with a p-
value of 0.005, which is in part related to the patterns for late-treated states described below. Note that coefficients are
sometimes below and sometimes above zero and do not exhibit a clear upward or downward trend.
17 One reason for why Bavaria and Baden Wuerttemberg could exhibit different patterns than the other states is that they
are typical destinations for domestic travel by Germans.
18
Removing these states from our sample reduces the time horizon over which treatment effects can be reliably estimated,
which is why we present treatment effects only up to 10 days before and after treatment.
17two weeks before and until three weeks after the end of the summer holiday, in row (1) of Table 2.
Columns (4) and (5) report the average daily coefficients in the second and third week after school
start – by which the temporary increase due to travel behavior and increased testing should have
subsided. These estimates provide no support for the conjecture that school reopenings increase the
risk of infection among children (because of increased contact with other children or for other
reasons).
The Impact of School Reopenings on Infection Rates among Adults.
In Figure 9 we repeat the analysis for the three age groups of adults and obtain broadly
similar results. The raw data displayed in Panel A shows upticks in confirmed cases before school
reopenings, followed by a decline in confirmed cases during the first days of school. This could be
related to increased testing upon return from travels or a higher risk of infection during travels. This
pattern is particularly visible for states in which summer holidays ended and schools reopened early
(e.g., the yellow and red lines in the figure). The estimates in Panel B of Figure 9, as well as their
averages reported in rows (2) to (4) of Table 2, also show no evidence for the hypothesis that school
reopenings could increase SARS-CoV-2 infection rates among adults. This conclusion is
corroborated by estimates from a conventional event study (Appendix Figure A3) as well as by
estimates from PPML regressions (Appendix Figure A4).
In contrast to the raw data displayed in Panel A of Figure 9, and the evidence presented for
children in Figure 8, estimates in Panel B of Figure 9 capture only the negative effects on confirmed
cases following the reopening of schools, but not the preceding increase in cases. When we remove
the two states that reopened schools last (the black and purple lines in Panel A), like in Panel C of
Figure 8, estimates become notably similar to those for children: they show an “anticipatory”
increase in cases and a return to the trend within a week after the schools reopened (see Figure 10).
The estimated negative effects on confirmed cases among adults observed a few days after schools
reopened appear to be driven by two states and hence cannot be considered as robust.
Figure 11 and row (5) of Table 2 further suggest that school reopenings did not increase
COVID-19 related death rates among adults aged 60 and above. The upper bound of the confidence
interval in the first three weeks after school reopenings in row (5), column (5) of Table 2 implies
that daily, at most, 0.014 deaths per 100,000 older adults could have been prevented had schools
remained closed.
184.3 The Effect of Fall School Closures on the Spread of SARS-CoV-2
The effectiveness of school closures as a containment measure may depend on the stage of
the pandemic at which they are enforced. Analyzing the summer holidays, we found school closures
to be an inadequate containment measure at low levels of aggregate infections – with an average of
0.82 new reported cases per day and per 100,000 in the period June to August. However, the
possibility remains that they prove more effective in a high-infection environment. The quasi-
experimental approach of this paper opens a window to test for this possibility using the fall holidays
in Germany as they were also staggered across states and fell into a period of high aggregate
infection levels. The second advantage the fall holidays offer is that traveling is much less prevalent
during this time, both because of the government advice against it and because the vacation is
substantially shorter. A disadvantage, however, is that due to their short length and the more limited
variation in timing across states, we cannot reliably estimate the effects beyond two weeks from the
start of the fall holiday and, even over this time period, estimates are less precise than for the
summer school closures and reopenings.
The Impact of Fall School Closure on Infection Rates Among Children
In Panel A of Figure 12, we again plot the smoothed daily infection rates per 100,000
children, starting from one week after the school reopening after the summer holiday up until the
end of the fall holiday (or our sample period on October 28). The figure distinguishes among five
groups of states with differing school closure dates, indicated by the colored vertical lines. The
figure shows no clear change in infection rates after the holiday starts in any state. A noticeable
feature of the figure is that, from October 1 onwards, infection rates among children increase at a
considerably faster pace in the state of Bavaria, the last state to start the fall holiday (the purple
line), than in the other states. Abstracting from this outlier, the development of infection rates over
time is parallel across states both preceding and during the fall holiday. Since Bavaria clearly
exhibits a different trend from the other states prior to the holiday, we drop it from the remaining
analysis.
In Panel B of Figure 12, we display both “placebo” estimates prior to treatment obtained
from regression equation (3) (the red squares) and “treatment” effects for two weeks following
school closures, estimated according to equation (2) (the blue dots). We report corresponding point
estimates, averaged over a one- and two-week windows in row (1) of Table 3. The figure and table
provide little support for the hypothesis that the school closures in the fall had a containing effect
on the spread of SARS-CoV-2 among children. Point estimates are not significantly different from
19You can also read