RURAL COMMODITIES WRAP - MARCH 2020 Author Phin Ziebell, Senior Economist - Agribusiness - NAB Business ...
←
→
Page content transcription
If your browser does not render page correctly, please read the page content below

RURAL COMMODITIES WRAP

MARCH 2020
Author Phin Ziebell, Senior Economist – Agribusiness
KEY POINTS
                          Let’s start with the good news: Australia is a net agricultural
CONTENTS                  exporter, in a normal season producing enough food for more
                                                                                             NAB RURAL COMMODITIES INDEX
                          than double its population. Most food that Australians eat is      National and by state
3 | In focus
                          grown in Australia. Coronavirus is wreaking havoc on Australia     200
4 | Seasonal conditions                                                                                      National                 NSW
5 | Farm inputs           and the world but people still need to eat and at this stage we    180             VIC                      QLD
6 | Livestock             have not seen any real disruptions to Australian food supply                       WA                       SA
                          outside of panic buying and hoarding from Australian               160             TAS
7 | Winter crops
8 | Summer crops, sugar   supermarkets. Overall, Australian agriculture will play a vital
                                                                                             140
9 | Rainfall data         role in keeping Australians in good health through the crisis.
                          The virus will have an impact on Australian agriculture, likely    120

CONTACTS                  increasing demand in domestic markets but potentially limiting     100
                          export demand and making trade more complex.
Phin Ziebell                                                                                 80
Senior Economist          On the domestic front, panic buying at supermarkets will bring       2010        2012       2014        2016      2018      2020
+61 (0) 475 940 662       forward demand for Australian agricultural products across the
                          board, although some specialty products destined for               MONTHLY COMMODITY PRICE CHANGES
Alan Oster                restaurants will be in surplus. However, with much of the
Group Chief Economist     buying now for hoarding, inventories are being transferred into                     Dec 19         Jan 20         Feb 20
+61 3 8634 2927           households, and these will eventually be run down (assuming          Wheat          ▲ 3.6%         ▲ 4.1%         ▼ 1.6%
Dean Pearson              limited spoilage).
                                                                                               Beef           ▼ 3.9%         ▲ 7.6%         ▲ 25.9%
Head of Economics         With global trade now coming under immense pressure, there
+61 3 8634 2331           is potential for more disruption to Australia’s agricultural         Dairy          ▲ 0.8%         ▲ 2.3%         ▲ 3.1%
                          exports. But, on balance this means more food for domestic           Lamb           ▼ 5.0%         ▲ 7.0%         ▲ 15.8%
                          consumers.
                                                                                               Wool           ▼ 2.1%         ▲ 2.9%         ▼ 0.1%
                          The NAB Rural Commodities Index had its best month on record
                          in February – rising 8.5% month-on-month, largely reflecting         Sugar          ▲ 4.1%         ▲ 6.5%         ▲ 9.6%
                          booming livestock markets. Big rains in many areas have driven
                          re-stocker markets into a frenzy, with hope that the big dry has     Cotton         ▲ 0.6%         ▲ 4.4%         ▼ 0.3%
                          now broken in New South Wales and Queensland. However,
                          substantial climatic risks remain, and if we don’t see a good       Source: NAB Group Economics, ABARES, Meat
                                                                                              and Livestock Australia, Australian Pork,
                          season from here livestock prices are almost certainly overdone     Ausmarket Consultants, Australian Bureau of
 2
                          at this level.                                                      Statistics, Bloomberg and Profarmer.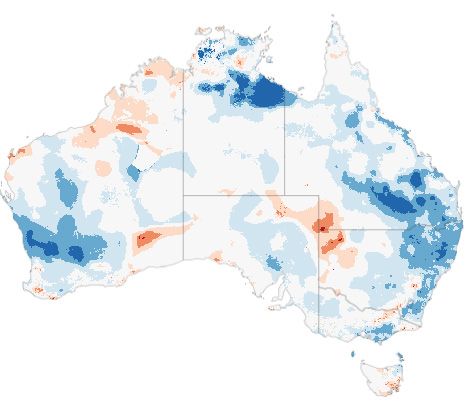
IN FOCUS: CORONAVIRUS AND FOOD SECURITY
COVID-19 has effectively shut down global
travel and is likely to put pressure on          AUSTRALIAN WHEAT PRODUCTION AND USE
transport links, particularly air freight.       Million tonnes per annum
                                                 35
The AUD has collapsed, now trading at
                                                 30
around 57-58c. This is good news for
                                                 25
Australian agricultural exporters, but only to
                                                 20
the extent that global trade flows can
                                                 15
continue in the face of the virus threat.
                                                 10
From first principles, we are well placed         5
with food security as a net export of food        0
products. Australia produces roughly
enough food for 60-75m people and with a
population of 25m much of our agricultural
output is exported.                                                                   production         domestic use        exports

Despite a miserable 2019-20 harvest, there       CORONAVIRUS CASES                                           COVID-19 IMPACT, SELECTED STRATEGIES
is still grain in storage and the livestock
                                                 Total – Australia                                           Health system, UK, Imperial College modelling
industry can still provide meat. Likewise,
fruit and vegetables are still readily
available.
There are two key risks for Australian food
production. Firstly, labour requirements –
particularly for horticulture and livestock
processing – may become an issue. This
could be compounded as the virus spreads
through the community, potentially
shutting sites. Secondly, some inputs such
as agricultural chemicals and fertiliser are
substantially imported. If trade flows break
down these could be affected.
Overall, Australian agriculture will play a           Source: ABARES, www.covid19data.com.au, Imperial College London and NAB Group Economics
vital role in keeping Australians in good
  3
health  through the crisis.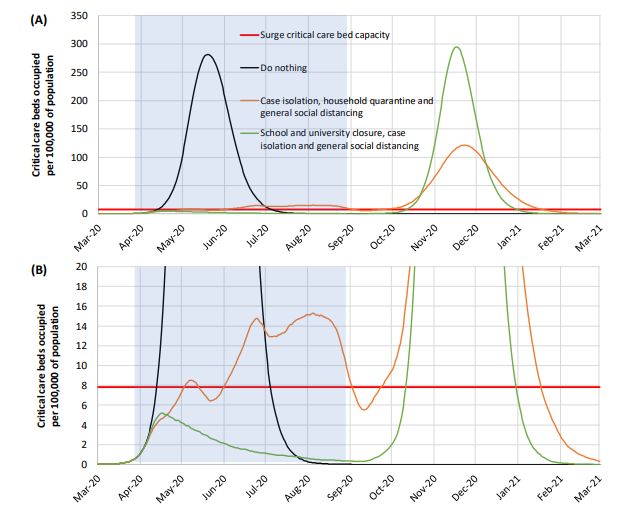
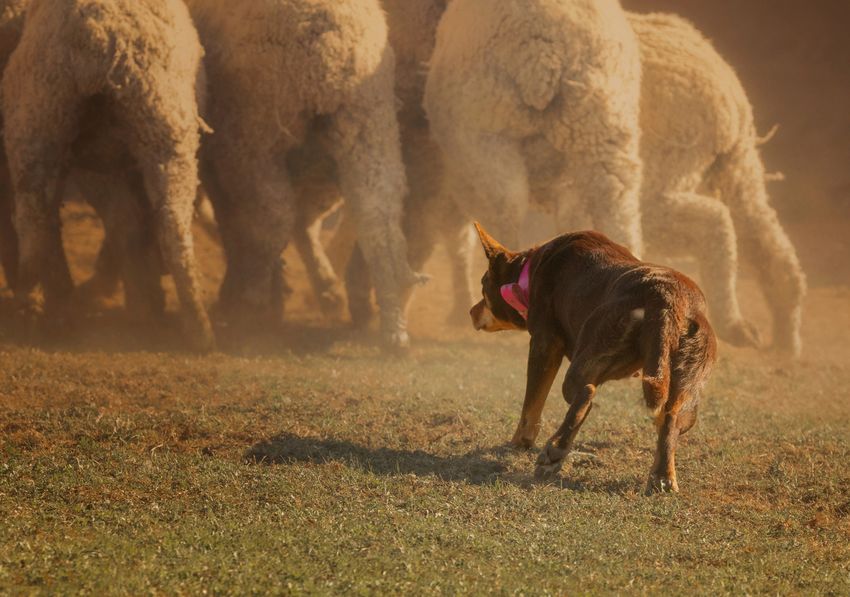
SEASONAL CONDITIONS
2019 was a very tough season in many parts
of Australia. New South Wales and parts of
                                                ROOT ZONE SOIL MOISTURE            BOM RAINFALL OUTLOOK
Queensland saw the most severe rainfall         27 February, relative to average   April – June 2020
deficits over the year.
Since January, many – but not all – of these
areas have seen excellent rainfall. This is
clearly an extremely welcome relief for
producers. Soil moisture levels across
northern New South Wales, the Darling
Downs and central Queensland are
especially encouraging and have led to very
spirited activity in the cattle restocker
market.
However, it is worth comparing underlying
conditions now compared to the last great       THREE MONTH RAINFALL DECILES       THREE MONTH RAINFALL DECILES
EYCI rally in 2016. EYCI peaked at 726c/kg in   December 2019 – February 2020      May – July 2016
August 2016, amid the best seasonal
conditions in arguably decades. The map on
the bottom right shows three months of
rainfall (relative to average) in the lead up
to August 2016 – a sea of blue, with most
areas above average and many very much
above average. Compared to the three
months leading up to the present (map
bottom left) conditions were substantially
better in 2016. While some areas now have
enough moisture to see them through for a
good period, many areas still need a full
season of above average rain.

                                                Source: Bureau of Meteorology
 4
FARM INPUTS
Farm input prices have been pushed lower
NAB FERTILISER INDEX NATIONAL AVERAGE FUEL PRICES by global events, albeit this is partly offset
AUD index AUc/litre by a lower AUD and potential supply issues -
180 petrol particularly for fertiliser and agricultural
240
diesel chemicals.
220
160
200 Petrol prices have absolutely tanked,
reflecting a collapse in crude oil prices –
180
140 Brent is now just USD26/bbl. This partly
160 reflects a sharp drop in demand due to
140 120 coronavirus but also the Saudi-induced
120 breakdown of the OPEC+ supply restrictions.
Diesel is yet to fall to the same extent, but is
100 100 now seeing downside as well. While a lower
2010 2012 2014 2016 2018 2020 2010 2012 2014 2016 2018 2020
AUD has blunted some of this impact, oil
price falls are so substantial that we are
NAB WEIGHTED FEED GRAIN PRICE INDEX ENTITLEMENT TRADE PRICES likely to see cheap petrol at the bowser
AUD/t $/ML, selected valleys unless there is a supply interruption.
400 700 Meanwhile, fertiliser prices fell very
substantially in 2019, but 2020 could be a
600
rollercoaster. Lower oil prices point to
300 downside, but possible supply issues
500
combined with a lower AUD, bears watching
400
200 closely.
300
Feed prices have trended lower this year,
200 3 Lower Goulburn
100 reflecting lower feed demand in NSW and
6 VIC Murray Dart-Barmah
100 Queensland. While this trend is likely to
continue, there are two key caveats. Firstly,
0 0
a lower AUD will push up local prices and
2010 2012 2014 2016 2018 2020 Jul-18 Jan-19 Jul-19 Jan-20
secondly, local demand for human
Source: Bloomberg, Profarmer, consumption may increase.
Department of Agriculture, NAB Group Economics
5LIVESTOCK
2019 was a generally tough year for the
CATTLE LAMB Australian cattle industry, reflecting poor
AUc/kg National Trade Lamb Indicator, AUc/kg seasonal conditions in much of the country.
900 EYCI
1000 But this all changed in 2020, in response to
800 very good rains in many areas. Restocker
US live cattle future 800 interest has been through the roof and
700
600 domestic prices have responded accordingly.
600
500 EYCI has now taken a breather, falling from a
400 record 767c/kg to 742c/kg (it started the year
400
300 on 487c/kg0. A lack of rain in the last two
200 200 weeks combined with coronavirus ravaging
100 export markets, suggests risks are now on the
0 0 downside.
2010 2012 2014 2016 2018 2020 2010 2012 2014 2016 2018 2020
Lamb prices have likewise been boosted by
rainfall but look to have peaked for now –
GDT AUCTION RESULTS WOOL likely reflecting the rainfall situation and
AUD/tonne Southern region, by micron, AUc/kg coronavirus concerns. NTLI now stands at a
Butter 17 19 21 23 very respectable 923c/kg. While China still
9000 3,500
Cheddar 25 28 30 needs protein following African Swine Fever,
8000 Skim milk powder 3,000 export logistics are going to become more
7000 Whole milk powder
2,500 difficult. Wool prices have held up, but
6000 demand is very uncertain in the current
5000 2,000 environment.
4000 1,500
Global Dairy Trade auction results have been
3000
1,000 lower in the last four auctions, although the
2000 sharply lower AUD will offset much of this.
500
1000 Where the market goes from here is difficult
0 0 to predict. On the one hand, China is a
2010 2012 2014 2016 2018 2020 2010 2012 2014 2016 2018 2020 massive buyer and has been otherwise
Source: NAB Group Economics, ABARES, Meat and Livestock Australia, Australian Pork, Ausmarket Consultants, occupied over the last two months, but
Australian Bureau of Statistics, Bloomberg and Profarmer. given the situation in Europe, it is
possible that EU supply could suffer.
6WINTER CROPS
2019-20 provided a pretty miserable crop
overall, with ABARES’ latest wheat
WHEAT PULSES
assessment standing at 15.2mmt, AUD/t AUD/t
1,400 Chick peas Field peas Lupins
representing the worst winter cropping 500
season since 2007-08. Apparent domestic 1,200
400
use (human consumption, stock feed, seed) 1,000
was just under 9mmt in 2018-19. We expect
300 800
the domestic consumption figure for 2019-
2020 to be comparable, or perhaps slightly 200
600
lower.
400
Australian grain continues to trade well 100 ASX east Aust future
200
above international benchmarks, although AUD denominated CBOT
there are signs of this moderating following 0 0
2010 2012 2014 2016 2018 2020 2010 2012 2014 2016 2018 2020
good rains in NSW and Queensland.
Australian grain is still being exported,
although it is unclear how coronavirus will COARSE GRAINS CANOLA
affect shipping and demand for product. AUD/t AUD/t, Newcastle
500 barley (feed) 800
Looking ahead to the 2020-21 crop, some barley (malting, Geelong)
sorghum (Newcastle) 700
areas have now received good enough
400 oats (feed, Albany)
rainfall to have sufficient profile for some 600
months. Planting is likely to be in full swing 500
300
in a month from now. It remains too early
400
to forecast the size of the 2020-21 crop.
200 300
200
100
100
0 0
2010 2012 2014 2016 2018 2020 2010 2012 2014 2016 2018 2020
Source: NAB Group Economics, ABARES, Meat and Livestock Australia, Australian Pork, Ausmarket
Consultants, Australian Bureau of Statistics, Bloomberg and Profarmer.
7SUMMER CROPS, SUGAR AND HORTICULTURE
Good summer rains have been a welcome
relief for summer crop prospects, with
COTTON SORGHUM AND RICE
Sorghum prices having come down a good AUD/bale AUD/t
1,400
700
deal. While the season will see lower than sorghum (Newcastle)
average production (on low plantings), it’s 1,200 600 rice (US rough)
not a bad result given where it started. 1,000 500
Cotton prices have held up, although 800 400
serious questions have to be asked about 600 300
demand in 6 months if coronavirus
continues to smash the global economy. 400 200
200 100
Fruit and vegetable prices were both higher
in February, increasing 12.4% and 5.4% 0 0
respectively. Fresh produce continues to be 2010 2012 2014 2016 2018 2020 2010 2012 2014 2016 2018 2020
widely available in shops, likely reflecting
the folly of panic buying produce that SUGAR FRUIT AND VEGETABLES
rapidly spoils. Labour availability will be an AUD/t Index
issue for horticulture this year, as will the 300
1,000
possibility for outbreaks among workers, Fruit
potentially shutting down operations at 250
800 Vegetables
farms.
200
600
150
400
100
200 50
0 0
2010 2012 2014 2016 2018 2020 2010 2012 2014 2016 2018 2020
Source: NAB Group Economics, ABARES, Meat and Livestock Australia, Australian Pork, Ausmarket Consultants, Australian Bureau of Statistics, Bloomberg and Profarmer.
8MONTHLY AVERAGE RAINFALL IN WINTER CROPPING REGIONS (MM)
Long run average 1900-01 to 2013-14 El Nino years 2019 2018
NEW SOUTH WALES VICTORIA QUEENSLAND
150 150 150
100 100 100
50 50 50
0 0 0
Oct
Oct
Oct
Nov
Feb
Mar
Apr
Sep
Sep
Nov
Feb
Sep
Nov
May
Feb
Mar
Apr
May
Mar
Apr
May
Jul
Jul
Jul
Jun
Aug
Dec
Jun
Aug
Dec
Jun
Aug
Dec
Jan
Jan
Jan
WESTERN AUSTRALIA SOUTH AUSTRALIA TASMANIA
150 150 200
150
100 100
100
50 50
50
0 0 0
Oct
Oct
Oct
Nov
Feb
Sep
Nov
Mar
Apr
Sep
May
Feb
Sep
Nov
Mar
Apr
May
Feb
Mar
Apr
May
Jul
Jul
Jul
Jun
Aug
Dec
Jun
Aug
Dec
Jun
Aug
Dec
Jan
Jan
Jan
Source: Bureau of Meteorology and NAB Group Economics
9Important Notice
This document has been prepared by National Australia Bank Limited ABN 12 004 044 937 AFSL 230686 ("NAB"). Any advice contained in this document has been prepared without taking into account your objectives,
financial situation or needs. Before acting on any advice in this document, NAB recommends that you consider whether the advice is appropriate for your circumstances.
NAB recommends that you obtain and consider the relevant Product Disclosure Statement or other disclosure document, before making any decision about a product including whether to acquire or to continue to
hold it. Please click here to view our disclaimer and terms of use.
Photo | Mai ThaiYou can also read